PivotLinesINTERBANKv2
Download script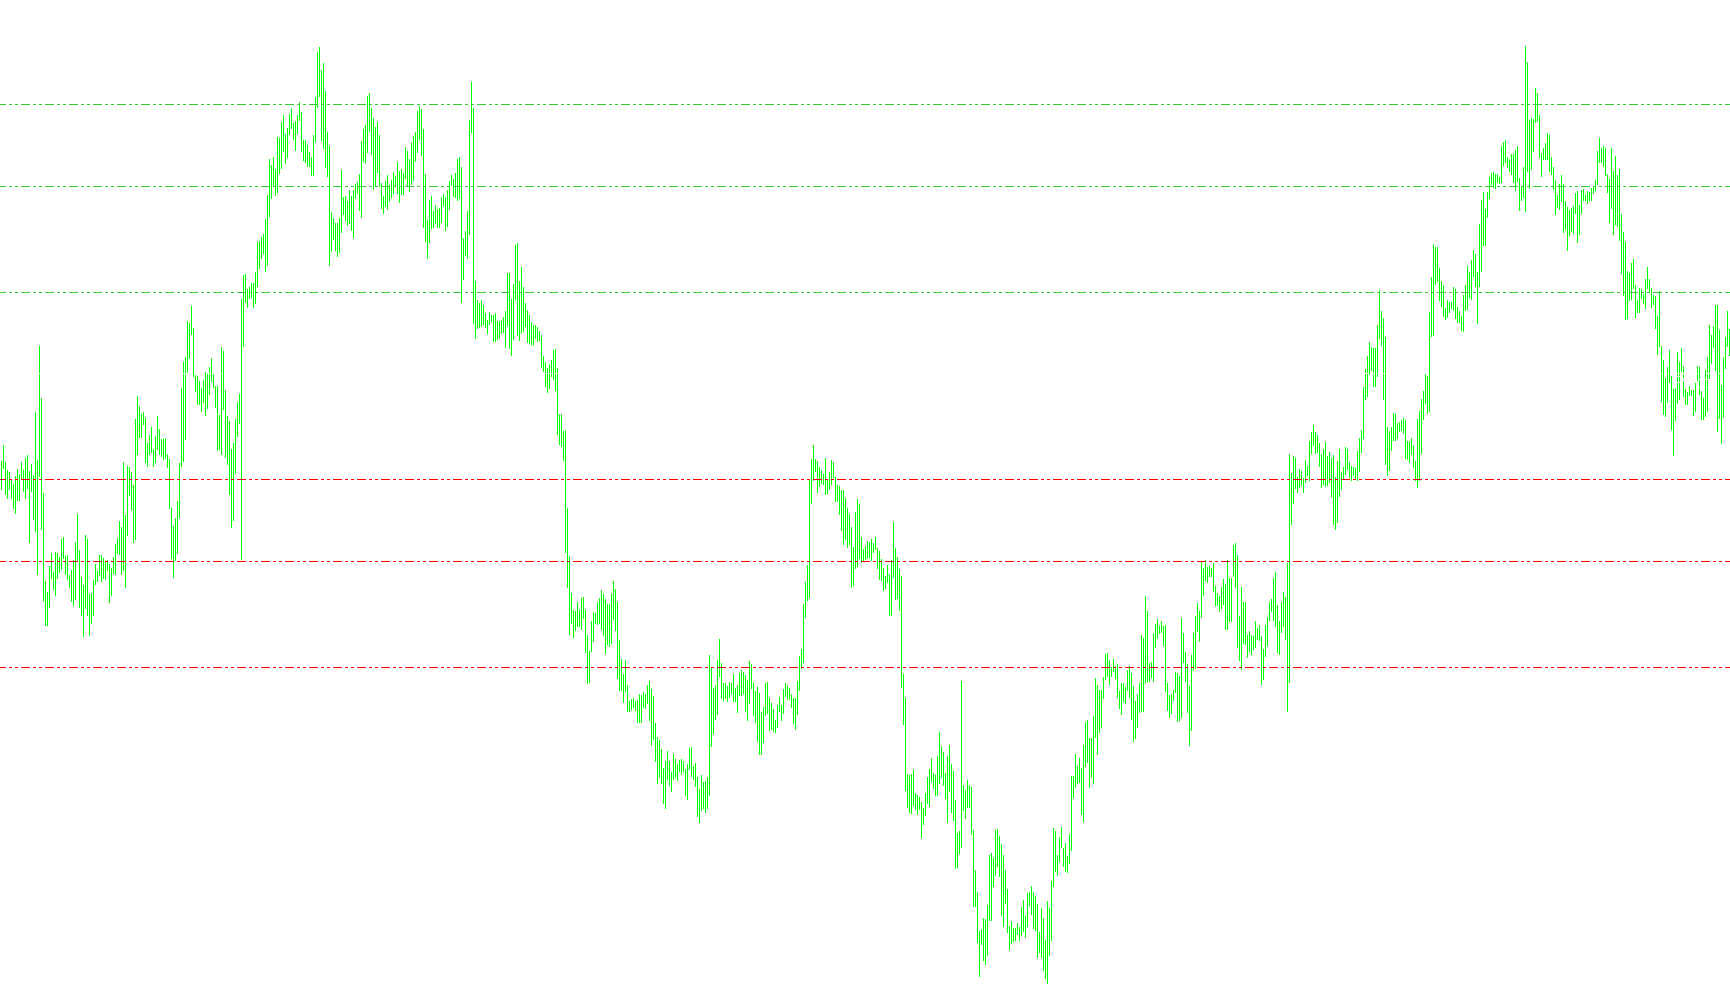
This script is designed to act as a visual trading tool for MetaTrader 4, automatically identifying and plotting significant price levels on your trading charts. It focuses on two primary types of technical analysis: Pivot Points and Camarilla Breaks, which help traders identify potential support and resistance zones where the market might change direction.
Core Functionality
The script scans historical data to determine the high, low, open, and close prices from previous trading sessions. It then uses these figures to calculate and draw several horizontal lines on your chart.
1. Standard Pivot Points
When enabled, the script calculates a series of "Pivot" levels based on the previous day's price action:
- The Pivot (P): The central equilibrium point calculated from the average of the previous day's high, low, and close.
- Resistance Levels (R1, R2, R3): These represent potential "ceilings" where selling pressure might increase or price faces difficulty moving higher.
- Support Levels (S1, S2, S3): These represent potential "floors" where buying interest might strengthen or price faces difficulty falling further.
2. Camarilla Breaks
This is an alternative calculation method used by some traders to identify specific breakout levels. It generates:
- H3 & H4: Specific upper boundaries often used to identify targets for bullish trends.
- L3 & L4: Specific lower boundaries often used to identify targets for bearish trends.
Key Features and User Experience
- Dynamic Visuals: The script doesn't just provide numbers; it draws the actual lines directly onto your chart. It uses different colors (such as Lime Green for resistance and Red for support) and line styles (dotted/dashed) to make the levels easy to distinguish at a glance.
- Automatic Updates: Every time the market moves or a new day begins, the script recalculates these values based on the latest data, ensuring that your levels remain relevant to current market conditions.
- Live Data Monitoring: The script includes a "Comment" feature that displays the high, low, and range of the previous day in the corner of your screen, giving you an instant snapshot of the current trading environment.
- Compatibility Safety: The tool includes a built-in check to ensure it only runs on timeframes smaller than a daily chart (e.g., 1-hour, 15-minute, etc.), preventing errors caused by trying to calculate daily pivots on weekly or monthly data.
How it helps the trader
Instead of manually calculating complex math formulas every morning, this script automates the process. It allows you to see exactly where "important" price zones are located, helping you decide where to place stop-losses, enter new trades, or take profits based on established technical analysis methodologies.
/*-----------------------------+
|			       |
| Shared by www.Aptrafx.com    |
|			       |
+------------------------------*/

//+------------------------------------------------------------------+
//|                                                        Pivot.mq4 |
//|                      Copyright © 2004, MetaQuotes Software Corp. |
//|                                        http://www.metaquotes.net |
//+------------------------------------------------------------------+
#property copyright "Copyright © 2004, MetaQuotes Software Corp."
#property link      "http://www.metaquotes.net"

#property indicator_chart_window

extern bool pivots = true;
extern bool camarilla = false;
extern bool midpivots = true;

double day_high=0;
double day_low=0;
double yesterday_high=0;
double yesterday_open=0;
double yesterday_low=0;
double yesterday_close=0;
double today_open=0;
double today_high=0;
double today_low=0;
double P=0;
double Q=0;
double R1,R2,R3;

double S1,S2,S3;
double H4,H3,L4,L3;
double nQ=0;
double nD=0;
double D=0;
double rates_d1[2][6];

//+------------------------------------------------------------------+
//| Custom indicator initialization function                         |
//+------------------------------------------------------------------+
int init()
  {
//---- indicators
 R1=0; R2=0; R3=0;

 S1=0; S2=0; S3=0;
 H4=0; H3=0; L4=0; L3=0;

//----
   return(0);
  }
//+------------------------------------------------------------------+
//| Custor indicator deinitialization function                       |
//+------------------------------------------------------------------+
int deinit()
  {
//---- TODO: add your code here
ObjectDelete("R1 Label");
ObjectDelete("R1 Line");
ObjectDelete("R2 Label");
ObjectDelete("R2 Line");
ObjectDelete("R3 Label");
ObjectDelete("R3 Line");
ObjectDelete("S1 Label");
ObjectDelete("S1 Line");
ObjectDelete("S2 Label");
ObjectDelete("S2 Line");
ObjectDelete("S3 Label");
ObjectDelete("S3 Line");
ObjectDelete("P Label");
ObjectDelete("P Line");
ObjectDelete("H4 Label");
ObjectDelete("H4 Line");
ObjectDelete("H3 Label");
ObjectDelete("H3 Line");
ObjectDelete("L3 Label");
ObjectDelete("L3 Line");
ObjectDelete("L4 Label");
ObjectDelete("L4 Line");

//----
   return(0);
  }
//+------------------------------------------------------------------+
//| Custom indicator iteration function                              |
//+------------------------------------------------------------------+
int start()
  {

//---- TODO: add your code here

//---- exit if period is greater than daily charts
if(Period() > 1440)
{
Print("Error - Chart period is greater than 1 day.");
return(-1); // then exit
}

//---- Get new daily prices

ArrayCopyRates(rates_d1, Symbol(), PERIOD_D1);
if (DayOfWeek( )!=1){
yesterday_close = rates_d1[1][4];
yesterday_open = rates_d1[1][1];
today_open = rates_d1[0][1];
yesterday_high = rates_d1[1][3];
yesterday_low = rates_d1[1][2];
day_high = rates_d1[0][3];
day_low = rates_d1[0][2];
}
else
{
yesterday_close = rates_d1[2][4];
yesterday_open = rates_d1[2][1];
today_open = rates_d1[0][1];
yesterday_high = rates_d1[2][3];
yesterday_low = rates_d1[2][2];
day_high = rates_d1[0][3];
day_low = rates_d1[0][2];

}

//---- Calculate Pivots

D = (day_high - day_low);
Q = (yesterday_high - yesterday_low);
P = (yesterday_high + yesterday_low + yesterday_close) / 3;
R1 = (2*P)-yesterday_low;
S1 = (2*P)-yesterday_high;
R2 = P+(yesterday_high - yesterday_low);
S2 = P-(yesterday_high - yesterday_low);

	H4 = (Q*0.55)+yesterday_close;
	H3 = (Q*0.27)+yesterday_close;
	R3 = (2*P)+(yesterday_high-(2*yesterday_low));

//	S2 = P-R1+S1;
	S3 = (2*P)-((2* yesterday_high)-yesterday_low);
	L3 = yesterday_close-(Q*0.27);
	L4 = yesterday_close-(Q*0.55);


if (Q > 5)
{
	nQ = Q;
}
else
{
	nQ = Q*10000;
}

if (D > 5)
{
	nD = D;
}
else
{
	nD = D*10000;
}


Comment("High= ",yesterday_high,"    Previous Days Range= ",nQ,"\nLow= ",yesterday_low,"    Current Days Range= ",nD,"\nClose= ",yesterday_close);

//---- Set line labels on chart window

//---- Pivot Lines
   if (pivots==true)
   {
      if(ObjectFind("R1 label") != 0)
      {
      ObjectCreate("R1 label", OBJ_TEXT, 0, Time[20], R1);
      ObjectSetText("R1 label", " R1", 10, "Arial", Black);
      }
      else
      {
      ObjectMove("R1 label", 0, Time[20], R1);
      }

      if(ObjectFind("R2 label") != 0)
      {
      ObjectCreate("R2 label", OBJ_TEXT, 0, Time[20], R2);
      ObjectSetText("R2 label", " R2", 10, "Arial", Black);
      }
      else
      {
      ObjectMove("R2 label", 0, Time[20], R2);
      }

      if(ObjectFind("R3 label") != 0)
      {
      ObjectCreate("R3 label", OBJ_TEXT, 0, Time[20], R3);
      ObjectSetText("R3 label", " R3", 10, "Arial", Black);
      }
      else
      {
      ObjectMove("R3 label", 0, Time[20], R3);
      }

      if(ObjectFind("P label") != 0)
      {
      ObjectCreate("P label", OBJ_TEXT, 0, Time[20], P);
      ObjectSetText("P label", "Pivot", 13, "Arial", Black);
      }
      else
      {
      ObjectMove("P label", 0, Time[20], P);
      }

      if(ObjectFind("S1 label") != 0)
      {
      ObjectCreate("S1 label", OBJ_TEXT, 0, Time[20], S1);
      ObjectSetText("S1 label", "S1", 10, "Arial", Black);
      }
      else
      {
      ObjectMove("S1 label", 0, Time[20], S1);
      }

      if(ObjectFind("S2 label") != 0)
      {
      ObjectCreate("S2 label", OBJ_TEXT, 0, Time[20], S2);
      ObjectSetText("S2 label", "S2", 10, "Arial", Black);
      }
      else
      {
      ObjectMove("S2 label", 0, Time[20], S2);
      }

      if(ObjectFind("S3 label") != 0)
      {
      ObjectCreate("S3 label", OBJ_TEXT, 0, Time[20], S3);
      ObjectSetText("S3 label", "S3", 10, "Arial", Black);
      }
      else
      {
      ObjectMove("S3 label", 0, Time[20], S3);
      }

//---  Draw  Pivot lines on chart
      if(ObjectFind("S1 line") != 0)
      {
      ObjectCreate("S1 line", OBJ_HLINE, 0, Time[40], S1);
      ObjectSet("S1 line", OBJPROP_STYLE, STYLE_DASHDOTDOT);
      ObjectSet("S1 line", OBJPROP_COLOR, Red);
      }
      else
      {
      ObjectMove("S1 line", 0, Time[40], S1);
      }

      if(ObjectFind("S2 line") != 0)
      {
      ObjectCreate("S2 line", OBJ_HLINE, 0, Time[40], S2);
      ObjectSet("S2 line", OBJPROP_STYLE, STYLE_DASHDOTDOT);
      ObjectSet("S2 line", OBJPROP_COLOR, Red);
      }
      else
      {
      ObjectMove("S2 line", 0, Time[40], S2);
      }

      if(ObjectFind("S3 line") != 0)
      {
      ObjectCreate("S3 line", OBJ_HLINE, 0, Time[40], S3);
      ObjectSet("S3 line", OBJPROP_STYLE, STYLE_DASHDOTDOT);
      ObjectSet("S3 line", OBJPROP_COLOR, Red);
      }
      else
      {
      ObjectMove("S3 line", 0, Time[40], S3);
      }

      if(ObjectFind("P line") != 0)
      {
      ObjectCreate("P line", OBJ_HLINE, 0, Time[40], P);
      ObjectSet("P line", OBJPROP_STYLE, STYLE_DOT);
      ObjectSet("P line", OBJPROP_COLOR, Black);
      }
      else
      {
      ObjectMove("P line", 0, Time[40], P);
      }

      if(ObjectFind("R1 line") != 0)
      {
      ObjectCreate("R1 line", OBJ_HLINE, 0, Time[40], R1);
      ObjectSet("R1 line", OBJPROP_STYLE, STYLE_DASHDOTDOT);
      ObjectSet("R1 line", OBJPROP_COLOR, LimeGreen);
      }
      else
      {
      ObjectMove("R1 line", 0, Time[40], R1);
      }

      if(ObjectFind("R2 line") != 0)
      {
      ObjectCreate("R2 line", OBJ_HLINE, 0, Time[40], R2);
      ObjectSet("R2 line", OBJPROP_STYLE, STYLE_DASHDOTDOT);
      ObjectSet("R2 line", OBJPROP_COLOR, LimeGreen);
      }
      else
      {
      ObjectMove("R2 line", 0, Time[40], R2);
      }

      if(ObjectFind("R3 line") != 0)
      {
      ObjectCreate("R3 line", OBJ_HLINE, 0, Time[40], R3);
      ObjectSet("R3 line", OBJPROP_STYLE, STYLE_DASHDOTDOT);
      ObjectSet("R3 line", OBJPROP_COLOR, LimeGreen);
      }
      else
      {
      ObjectMove("R3 line", 0, Time[40], R3);
      }
   }
//---- End of Pivot Line Draw


//----- Camarilla Lines

   if (camarilla==true)
   {
      if(ObjectFind("H4 label") != 0)
      {
      ObjectCreate("H4 label", OBJ_TEXT, 0, Time[20], H4);
      ObjectSetText("H4 label", " H4", 10, "Arial", Black);
      }
      else
      {
      ObjectMove("H4 label", 0, Time[20], H4);
      }

      if(ObjectFind("H3 label") != 0)
      {
      ObjectCreate("H3 label", OBJ_TEXT, 0, Time[20], H3);
      ObjectSetText("H3 label", " H3", 10, "Arial", Black);
      }
      else
      {
      ObjectMove("H3 label", 0, Time[20], H3);
      }

      if(ObjectFind("L3 label") != 0)
      {
      ObjectCreate("L3 label", OBJ_TEXT, 0, Time[20], L3);
      ObjectSetText("L3 label", " L3", 10, "Arial", Black);
      }
      else
      {
      ObjectMove("L3 label", 0, Time[20], L3);
      }

      if(ObjectFind("L4 label") != 0)
      {
      ObjectCreate("L4 label", OBJ_TEXT, 0, Time[20], L4);
      ObjectSetText("L4 label", " L4", 10, "Arial", Black);
      }
      else
      {
      ObjectMove("L4 label", 0, Time[20], L4);
      }

//---- Draw Camarilla lines on Chart
      if(ObjectFind("H4 line") != 0)
      {
      ObjectCreate("H4 line", OBJ_HLINE, 0, Time[40], H4);
      ObjectSet("H4 line", OBJPROP_STYLE, STYLE_DASHDOTDOT);
      ObjectSet("H4 line", OBJPROP_COLOR, Black);
      }
      else
      {
      ObjectMove("H4 line", 0, Time[40], H4);
      }

      if(ObjectFind("H3 line") != 0)
      {
      ObjectCreate("H3 line", OBJ_HLINE, 0, Time[40], H3);
      ObjectSet("H3 line", OBJPROP_STYLE, STYLE_DASHDOTDOT);
      ObjectSet("H3 line", OBJPROP_COLOR, Black);
      }
      else
      {
      ObjectMove("H3 line", 0, Time[40], H3);
      }

      if(ObjectFind("L3 line") != 0)
      {
      ObjectCreate("L3 line", OBJ_HLINE, 0, Time[40], L3);
      ObjectSet("L3 line", OBJPROP_STYLE, STYLE_DASHDOTDOT);
      ObjectSet("L3 line", OBJPROP_COLOR, Black);
      }
      else
      {
      ObjectMove("L3 line", 0, Time[40], L3);
      }

      if(ObjectFind("L4 line") != 0)
      {
      ObjectCreate("L4 line", OBJ_HLINE, 0, Time[40], L4);
      ObjectSet("L4 line", OBJPROP_STYLE, STYLE_DASHDOTDOT);
      ObjectSet("L4 line", OBJPROP_COLOR, Black);
      }
      else
      {
      ObjectMove("L4 line", 0, Time[40], L4);
      }
   }
//-------End of Draw Camarilla Lines

//------ Midpoints Pivots

   if (midpivots==true)
   {


//---- Draw Midpoint Pivots on Chart


   }
//----End of Midpoint Pivots Draw

//---- End Of Program
   return(0);
  }
//+------------------------------------------------------------------+
Comments