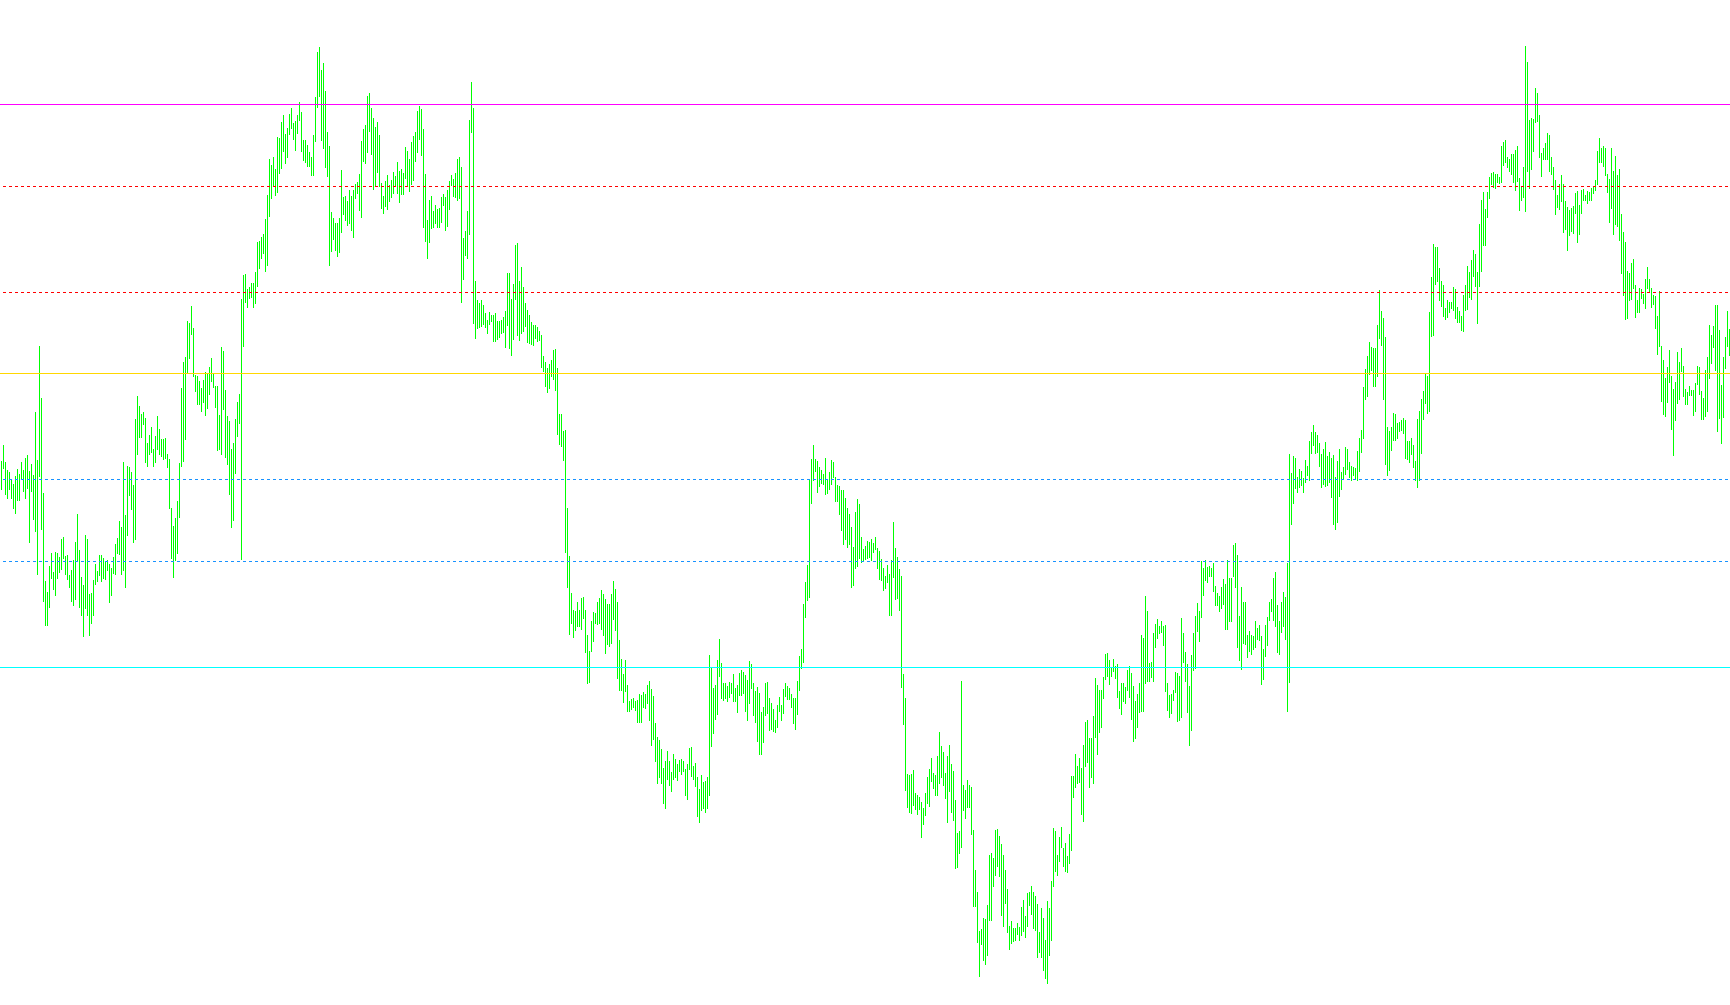
Indicator

Phat_ZigZag

PhilNelSignals
Indicator

PhilNelSignals

iMA

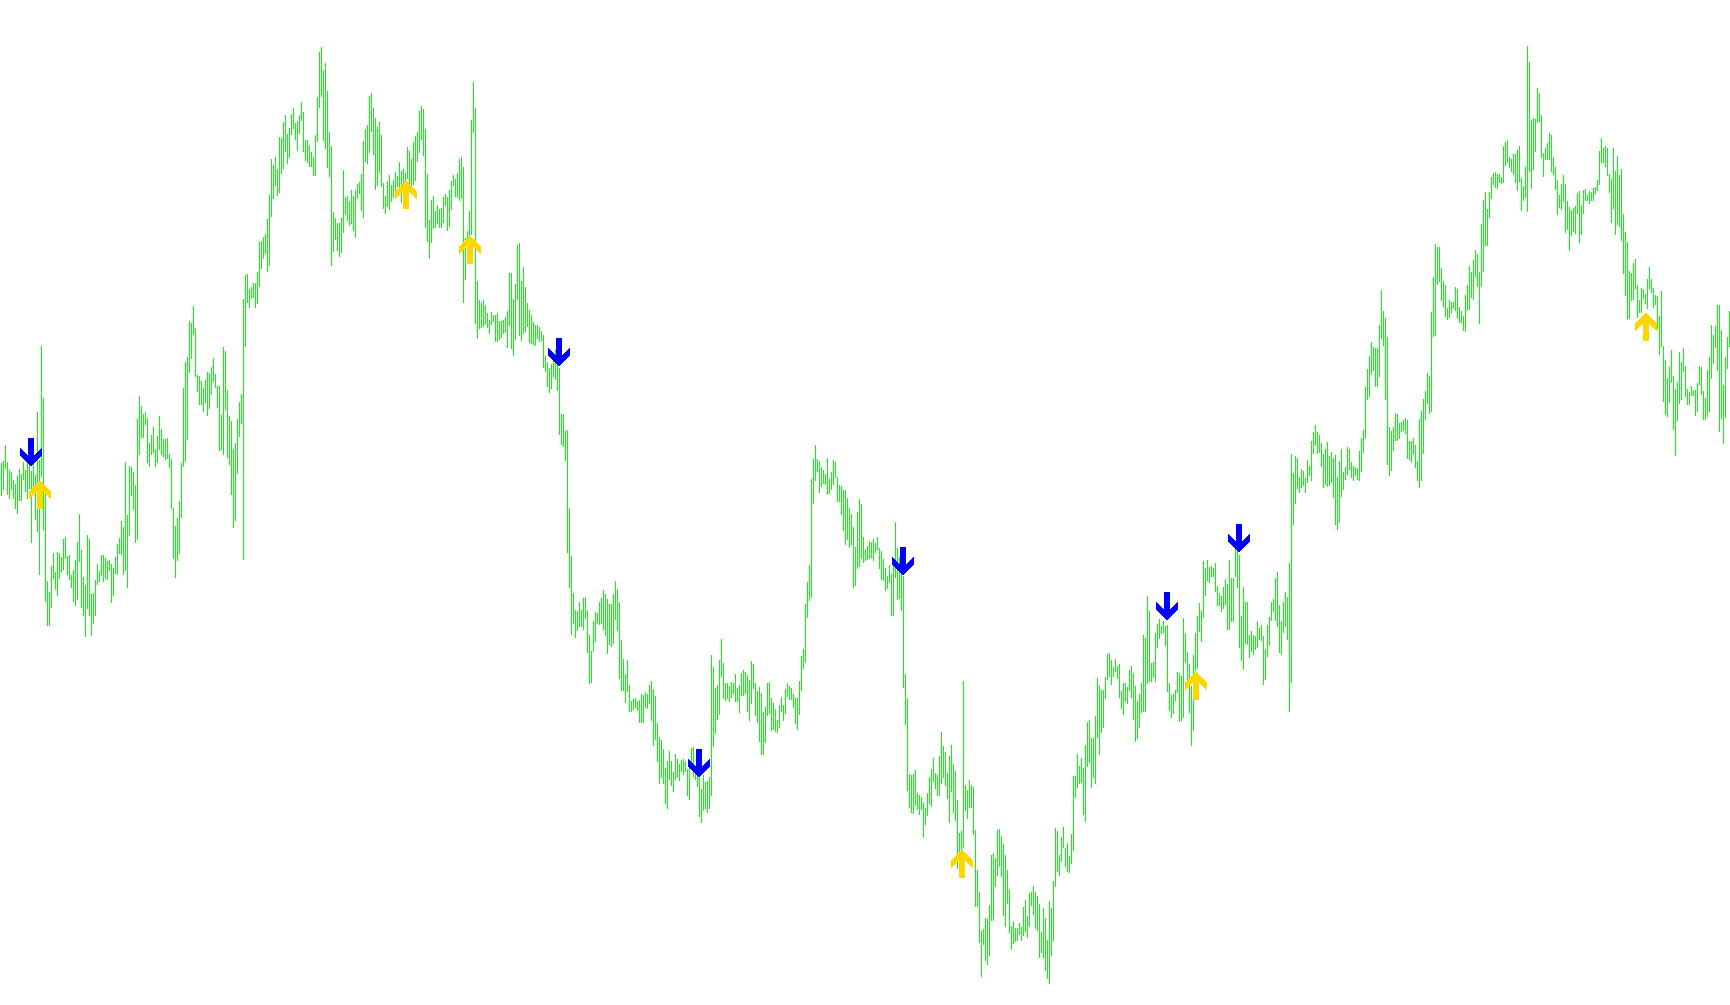
This indicator identifies trend reversals by detecting specific price action entrapments between three distinct moving averages combined with a steep angular slope threshold.

Phoenix5_Ind_1
Indicator

Phoenix5_Ind_1

iEnvelopesiOsMAiMA
Phoenix5_Ind_1_v1
Indicator

Phoenix5_Ind_1_v1

iEnvelopesiOsMAiMA
Phoenix5_Ind_1_v2
Indicator

Phoenix5_Ind_1_v2

iEnvelopesiOsMAiMA
Pi
Indicator

Pi

This script executes a high-precision iterative algorithm to compute the mathematical constant Pi using the Bailey–Borwein–Plouffe formula.

pimpspit-daily-pivot
Indicator

pimpspit-daily-pivot

This indicator calculates and projects daily pivot levels, including standard resistance and support boundaries, derived from the previous day's high, low, and closing prices.

pimpspit-monthly-pivot
Indicator

pimpspit-monthly-pivot

This indicator calculates and plots monthly pivot points, including three distinct levels of resistance and support, derived from the high, low, and closing prices of the previous monthly candles.

pimpspit-weekly-pivot
Indicator

pimpspit-weekly-pivot

This indicator calculates and plots weekly pivot points, support levels, and resistance zones based on the previous week's high, low, and closing price data.

Indicator

PinI4Bbar AHA 0.2

Indicator

PinI4Bbar AHA 0[1].1

PipNailer DashBoard_v1.5
Indicator

PipNailer DashBoard_v1.5

iACiAOiSAR

This indicator synchronizes Parabolic SAR, Awesome Oscillator, and Accelerator Oscillator signals across multiple timeframes to identify concurrent trend reversals for various currency pairs and commodities.

PipNailer iSignals_v2
Indicator

PipNailer iSignals_v2

iACiAOiATRiSAR

This indicator identifies high-probability trade entries by detecting simultaneous directional flips across the Parabolic SAR, Awesome Oscillator, and Awesome Chart filters.

PIPQInd
Indicator

PIPQInd

iATR

This indicator identifies trend reversals and momentum shifts by tracking price action relative to a dynamic trailing stop level adjusted by ATR volatility.

PIPQInd_SLTSm
Indicator

PIPQInd_SLTSm

iATR

This indicator identifies trend reversals by tracking a dynamic trailing stop level and generating visual alerts when price action breaches established support or resistance boundaries combined with ATR-based volatility filters.

PIPQInd_v1
Indicator

PIPQInd_v1

iATR

This indicator identifies potential trend reversals by monitoring price breaches of a volatility-adjusted trailing stop level integrated with ATR-based expansion zones.

PIPQInd_v2
Indicator

PIPQInd_v2

iATR

This indicator identifies trend reversals by tracking a dynamic price boundary that adjusts based on volatility-adjusted pip offsets and historical price pivots.

PipsingV1_Setup
Indicator

PipsingV1_Setup

This script synchronizes and displays user-defined trading parameters as a persistent text overlay on the chart while validating global variable persistence.

PipsingV2_Setup
Indicator

PipsingV2_Setup

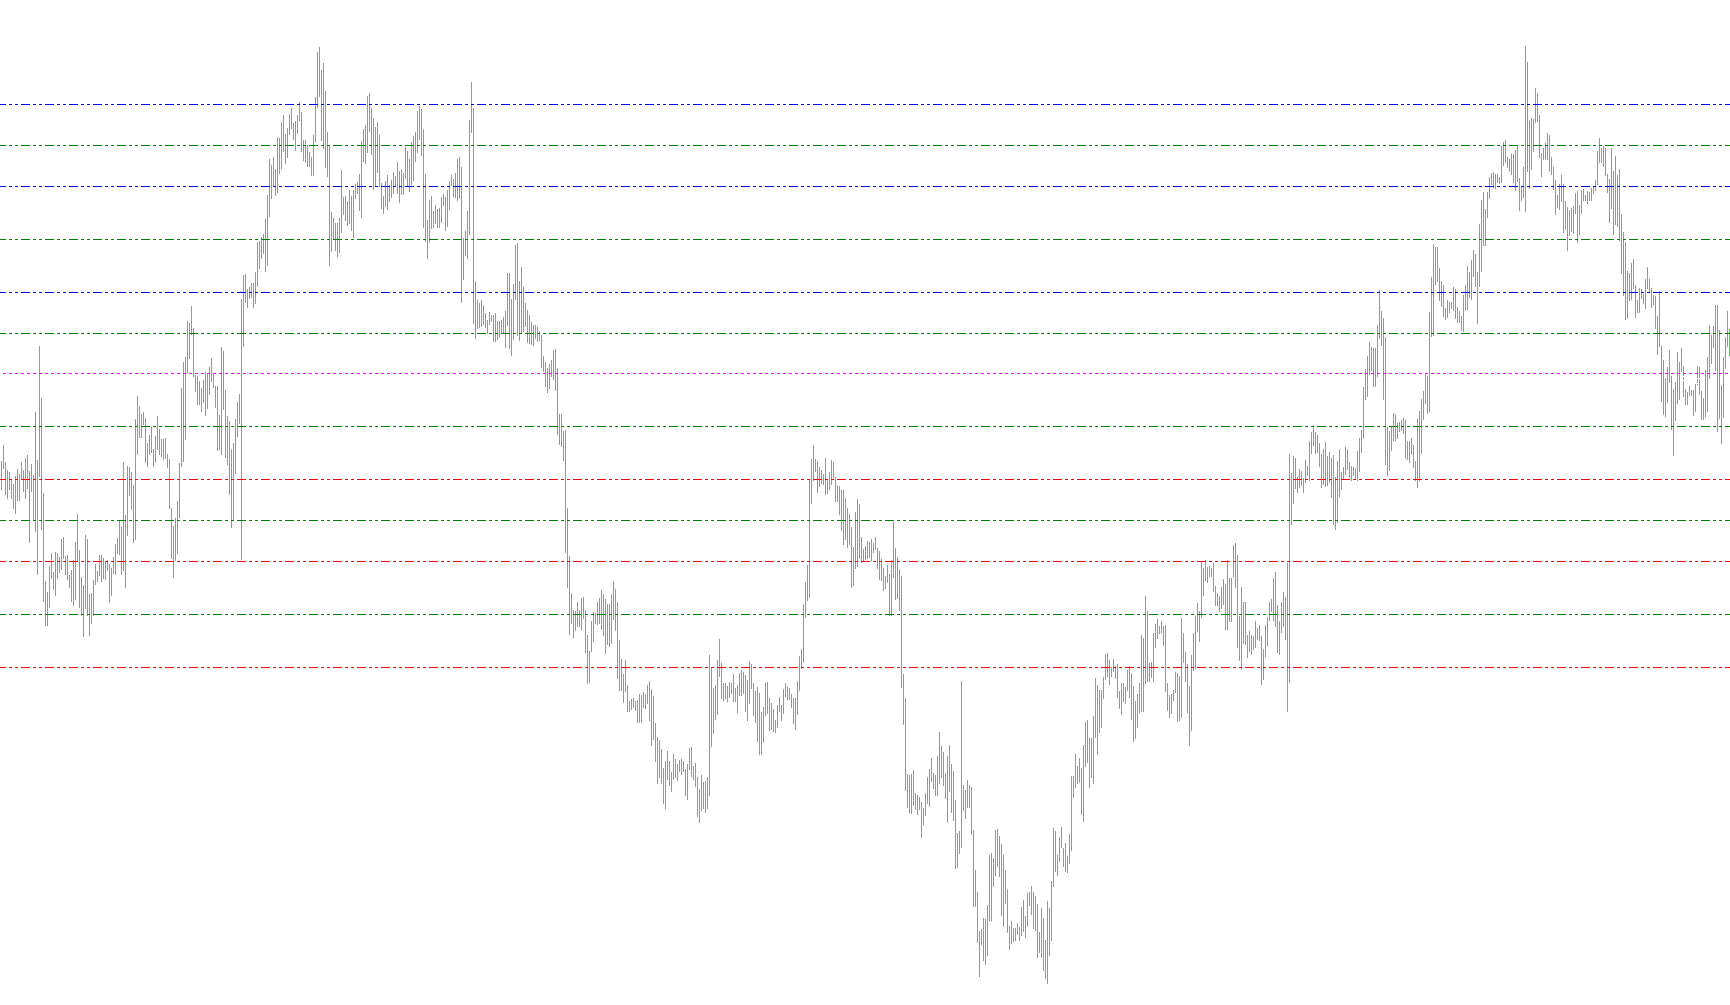
A utility script designed to automate and visualize manual trading parameters by managing multi-stage order entries and updating real-time data on the chart.
Pipsing_CLOSE_on_DROP
Indicator

Pipsing_CLOSE_on_DROP

This script executes targeted order closures by identifying and processing positions within a user-defined price radius triggered via a mouse drop interaction.
pipsutorEURUSD
Indicator

pipsutorEURUSD

iBearsPoweriBullsPower

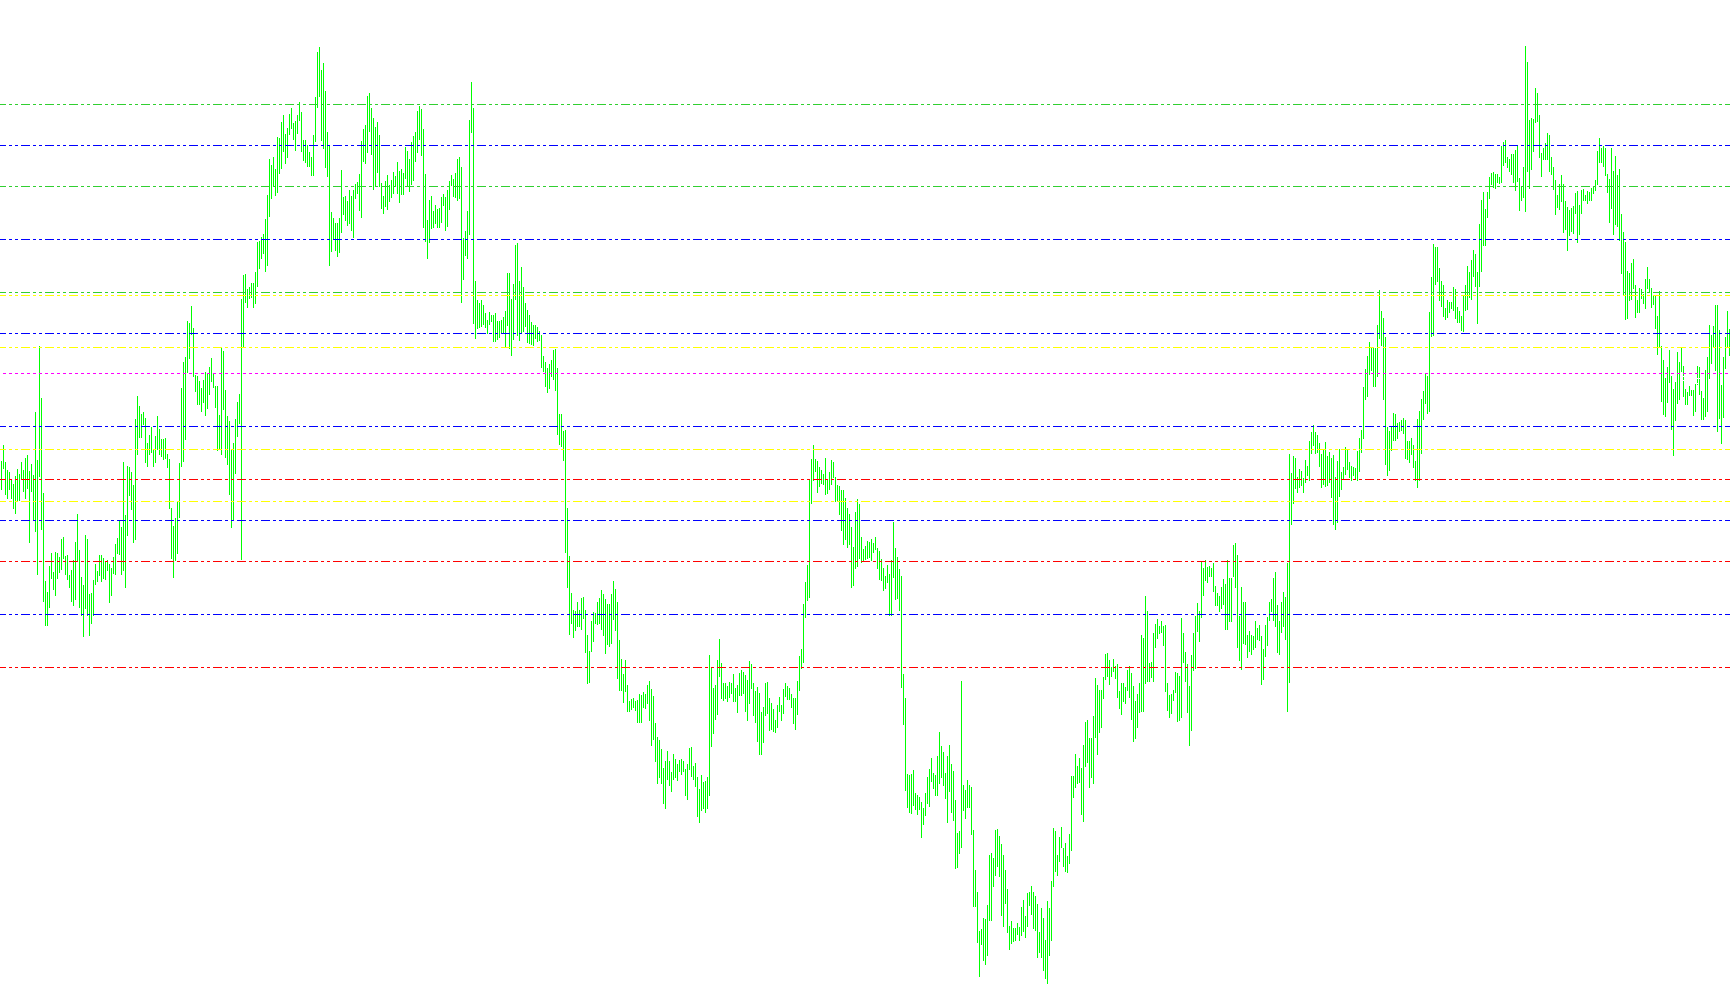
Identifies directional momentum shifts by plotting visual signals when the aggregate sum of Bull Power and Bear Power exceeds specific volatility thresholds.

pipsutorEURUSD_v1
Indicator

pipsutorEURUSD_v1

iBearsPoweriBullsPower

This indicator identifies directional shifts by monitoring extreme divergence in combined bull and bear power oscillators to plot high-probability reversal signals.

Pivot (Midnight to Midnight)_M
Indicator

Pivot (Midnight to Midnight)_M

This indicator calculates daily pivot points based on the previous day's high, low, and close to project six distinct midpoint levels (M0-M5) for intraday price action analysis.

Pivot (Midnight to Midnight)_V2
Indicator

Pivot (Midnight to Midnight)_V2

This indicator dynamically projects daily price floors and ceilings by calculating central pivot points and tiered support/resistance levels based on the preceding day's range.

Pivot (Midnight to Midnight)_V2_001
Indicator

Pivot (Midnight to Midnight)_V2_001

This indicator identifies structural price boundaries by calculating central pivot points and three levels of support and resistance based on the previous day's high, low, and closing prices.

Pivot (Midnight to Midnight)_V2_v1
Indicator

Pivot (Midnight to Midnight)_V2_v1

This indicator calculates and plots daily price equilibrium points and symmetrical support/resistance levels based on previous day's high, low, and closing prices.

Pivot Daily Zone
Indicator

Pivot Daily Zone

This indicator calculates and visualizes multi-level support and resistance boundaries by deriving price extremes from previous daily sessions to identify potential reversal areas.

pivot detector osillator
Indicator

pivot detector osillator

iMAiRSI

The indicator normalizes the Relative Strength Index based on dual threshold boundaries that shift dynamically depending on whether price is above or below its long-term moving average.

Pivot Lines 2
Indicator

Pivot Lines 2

This indicator dynamically projects daily support and resistance levels by calculating classic pivot points, Camarilla breakdown values, and intermediate midpoint zones based on historical price volatility.

Pivot Lines Timezone
Indicator

Pivot Lines Timezone

This indicator dynamically projects standard pivot levels, Camarilla break points, and midpoint intervals based on synchronized historical price action and user-defined timezone offsets.

Pivot Lines Timezone_001
Indicator

Pivot Lines Timezone_001

This indicator dynamically projects standard pivot levels, Camarilla breakouts, and fractional midpoint zones based on historical daily price action and specific time zone offsets.

Pivot Lines Timezone_v1
Indicator

Pivot Lines Timezone_v1

This indicator synchronizes historical price action to project Standard Pivots, Camarilla breakout levels, and intermediate midpoint boundaries across specific time zones.

Pivot Lines Timezone_v2
Indicator

Pivot Lines Timezone_v2

This indicator dynamically plots classic and extended support/resistance levels, including standard pivots, Camarilla breakouts, and midpoint subdivisions based on historical price action and user-defined time zones.

Pivot Lines Timezone_v3
Indicator

Pivot Lines Timezone_v3

This indicator synthesizes standard floor pivots, Camarilla breakout levels, and nested midpoint trajectories into a unified visual grid based on historical price ranges.

Pivot Lines Timezone_v4
Indicator

Pivot Lines Timezone_v4

This indicator dynamically projects standard pivots, Camarilla range levels, and midpoint equilibrium zones based on historical price action and specific timezone parameters.

Pivot Lines Timezone_v5
Indicator

Pivot Lines Timezone_v5

This indicator projects dynamic support and resistance levels by synthesizing standard floor pivots, Camarilla breakout points, and granular midpoint subdivisions based on historical price action.

Pivot Lines
Indicator

Pivot Lines

This indicator projects multi-dimensional support and resistance levels by synthesizing standard pivots, Camarilla breakout points, and sequential midpoint averages derived from daily price action.

Pivot Lines1
Indicator

Pivot Lines1

This indicator synthesizes daily price action data to project standard pivot points, Camarilla breakout levels, and fractional midpoints for multi-layered support and resistance identification.

Pivot Lines2
Indicator

Pivot Lines2

This indicator dynamically projects multi-layered support and resistance zones by synthesizing standard pivot points, Camarilla range boundaries, and nested midpoints derived from daily historical volatility.

Pivot Lines_RDs
Indicator

Pivot Lines_RDs

This indicator projects dynamic support and resistance levels by calculating standard pivot points, Camarilla breakout values, and granular midpoint zones based on previous daily price action.

Pivot Lines_RDs_v1
Indicator

Pivot Lines_RDs_v1

This indicator dynamically projects daily price boundaries by calculating standard pivot points, Camarilla range levels, and nested midpoints derived from previous sessions.

Indicator

Pivot Lines_v1

Pivot Lines_v2
Indicator

Pivot Lines_v2

This indicator dynamically projects daily price action boundaries by calculating standard pivots, Camarilla range levels, and sequential midpoints to identify structural support and resistance zones.

Pivot Manual
Indicator

Pivot Manual

This indicator projects a comprehensive array of mathematical levels including standard pivots, Fibonacci retracements, and customized harmonic mean points based on previous session price extremes.

Pivot Point Median
Indicator

Pivot Point Median

This indicator projects a series of arithmetic mean levels derived from standard pivot point calculations to identify intermediate price equilibrium zones.

Pivot Points - Daily (Shifted)
Indicator

Pivot Points - Daily (Shifted)

Calculates and plots historical daily support and resistance levels by adjusting the base calculation day using a user-defined hourly offset.

Pivot Points - Daily (Shifted)_v1
Indicator

Pivot Points - Daily (Shifted)_v1

This indicator projects daily support and resistance levels by applying a customizable chronological offset to synchronize market pivots with specific regional trading sessions.

Pivot Points Multitimeframe
Indicator

Pivot Points Multitimeframe

This indicator dynamically projects and visualizes standard and midpoint pivot levels across 4-hour, daily, weekly, and monthly timeframes simultaneously.

Pivot Points Multitimeframe_002
Indicator

Pivot Points Multitimeframe_002

This indicator automatically projects and visualizes comprehensive pivot point networks, including support, resistance, and granular midpoints across 4-hour, daily, weekly, and monthly intervals.

Pivot Points-mod
Indicator

Pivot Points-mod

This indicator dynamically calculates and projects historical support and resistance levels based on daily, weekly, monthly, or previous candle price extremes.