Indicator

Pivots GMTShift

Pivots History with Alert 1.1
Indicator

Pivots History with Alert 1.1

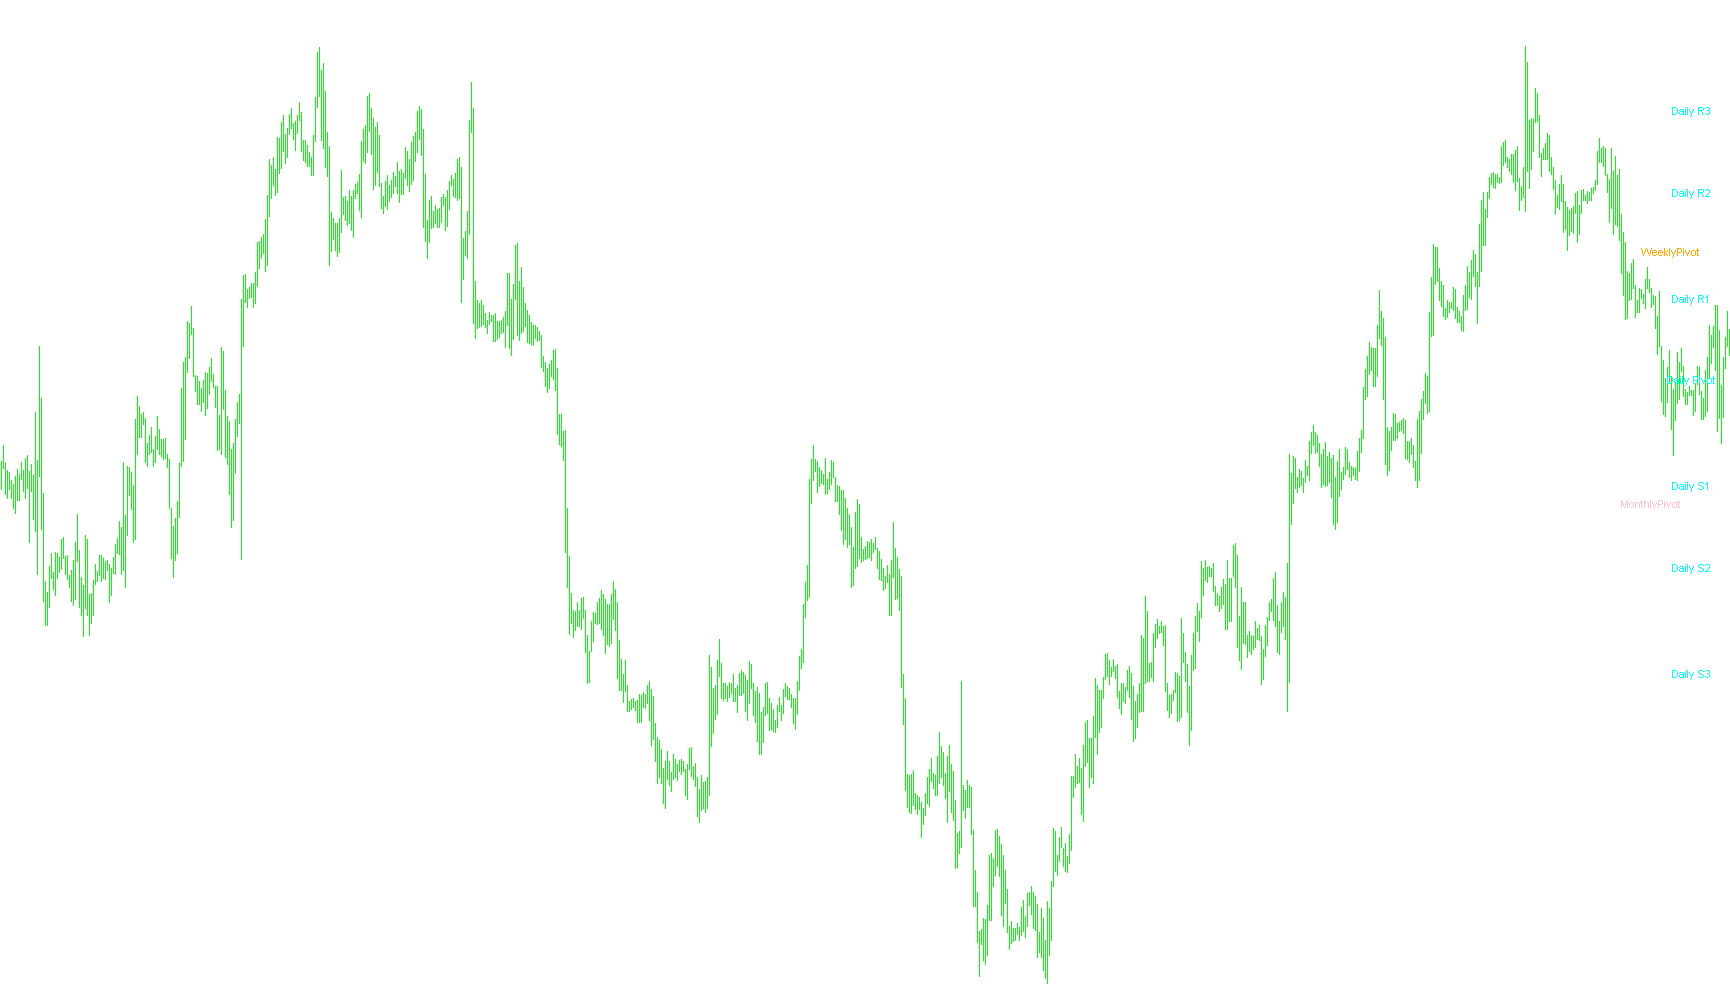
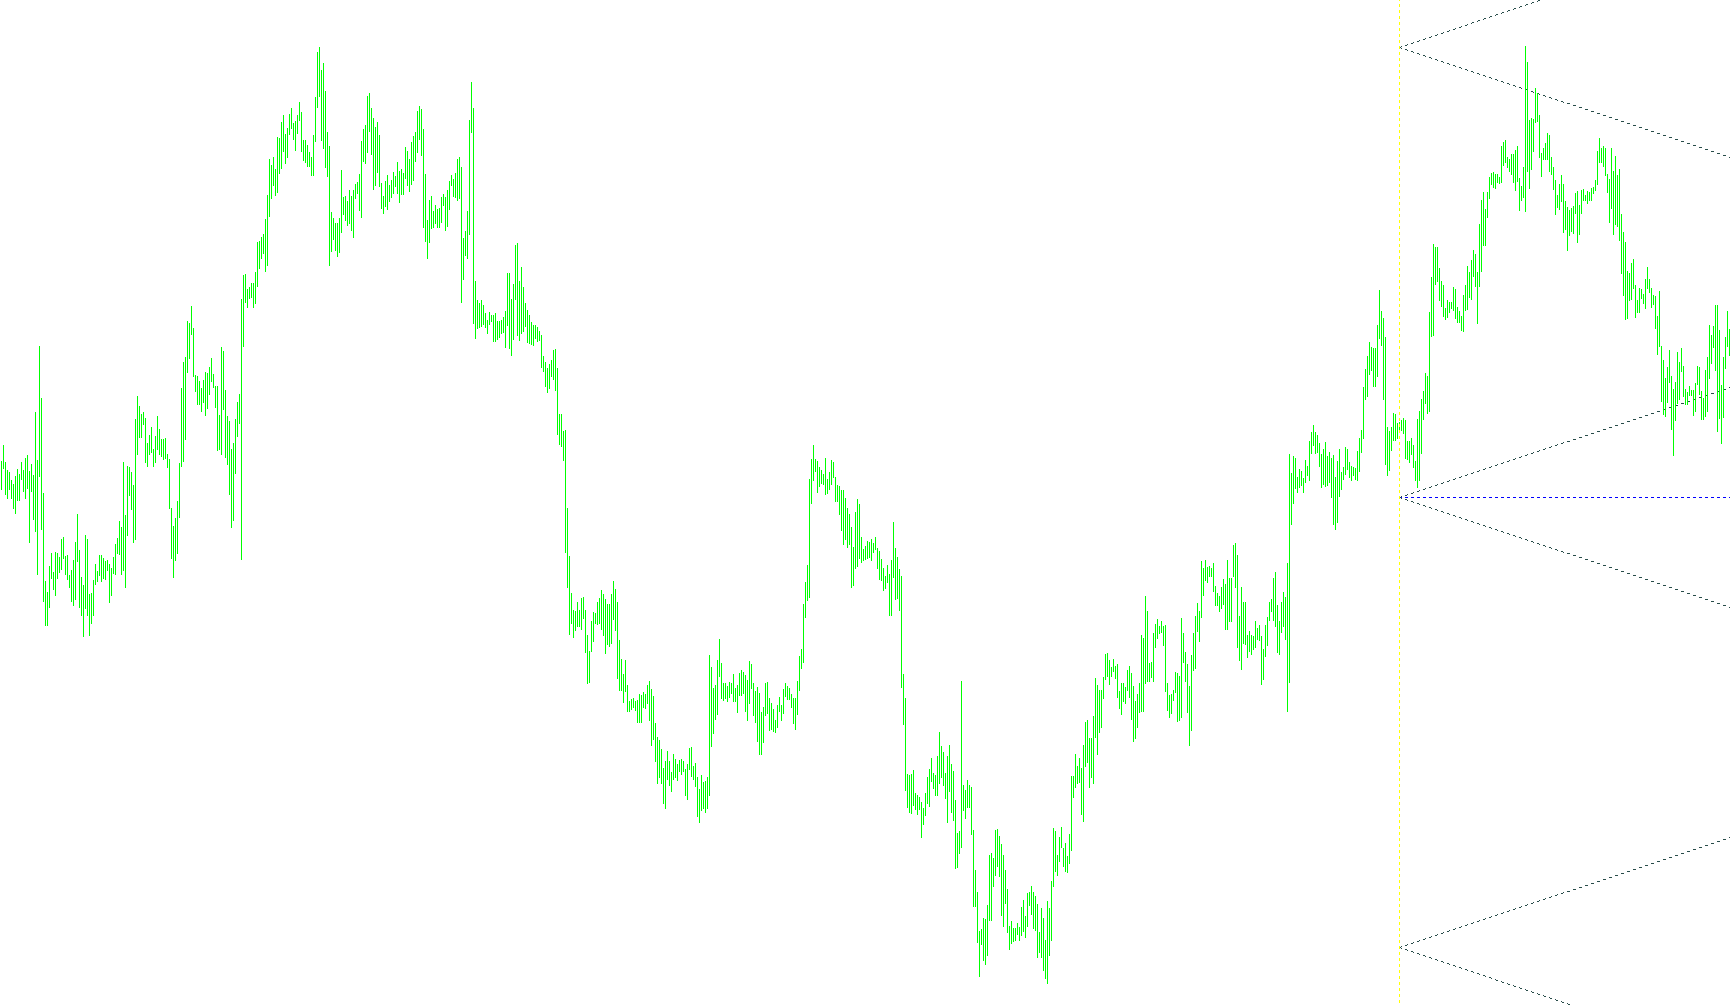
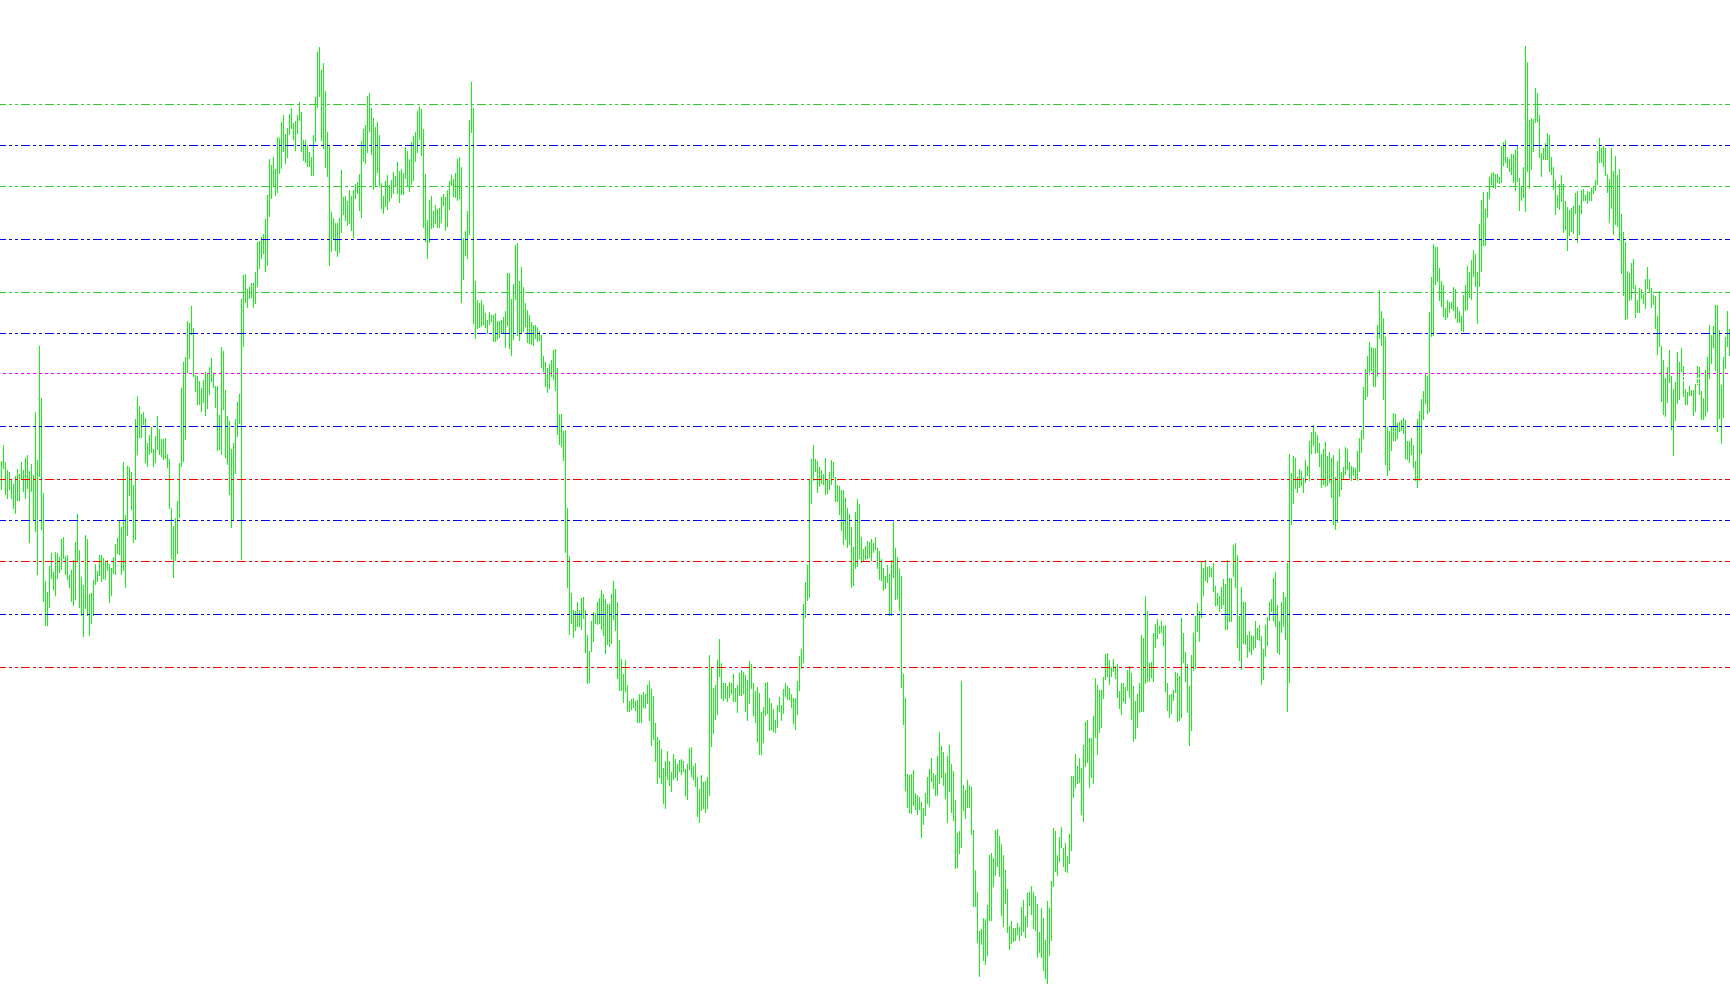
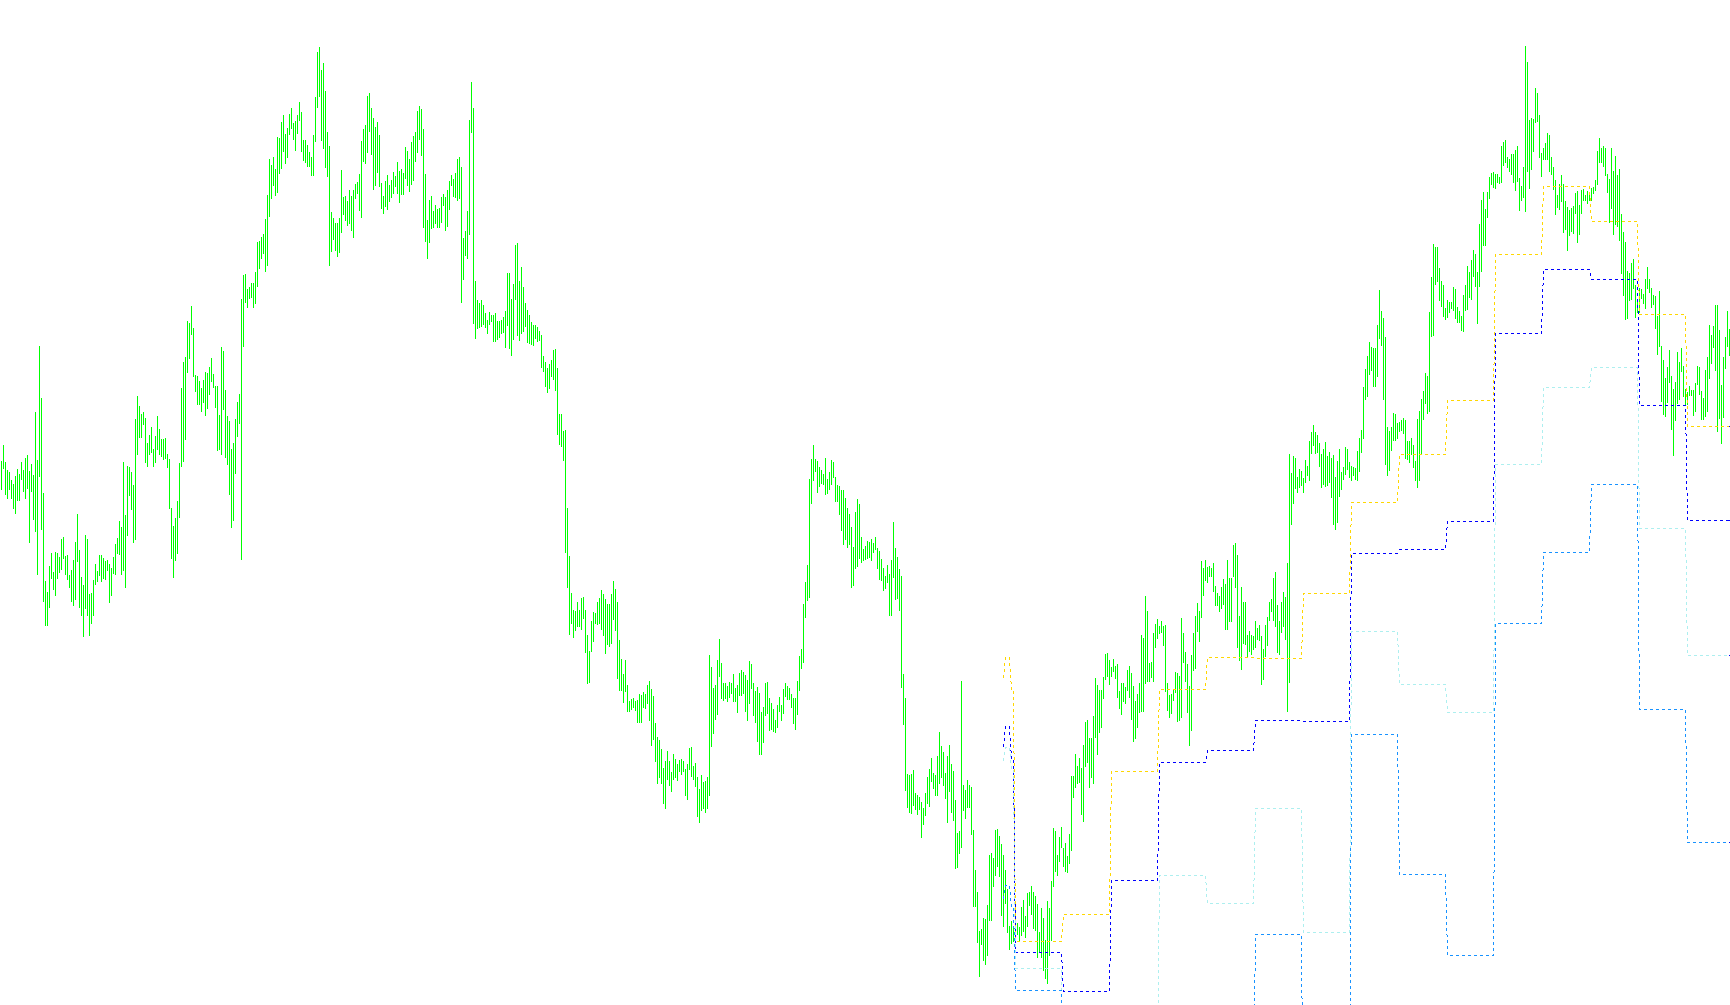
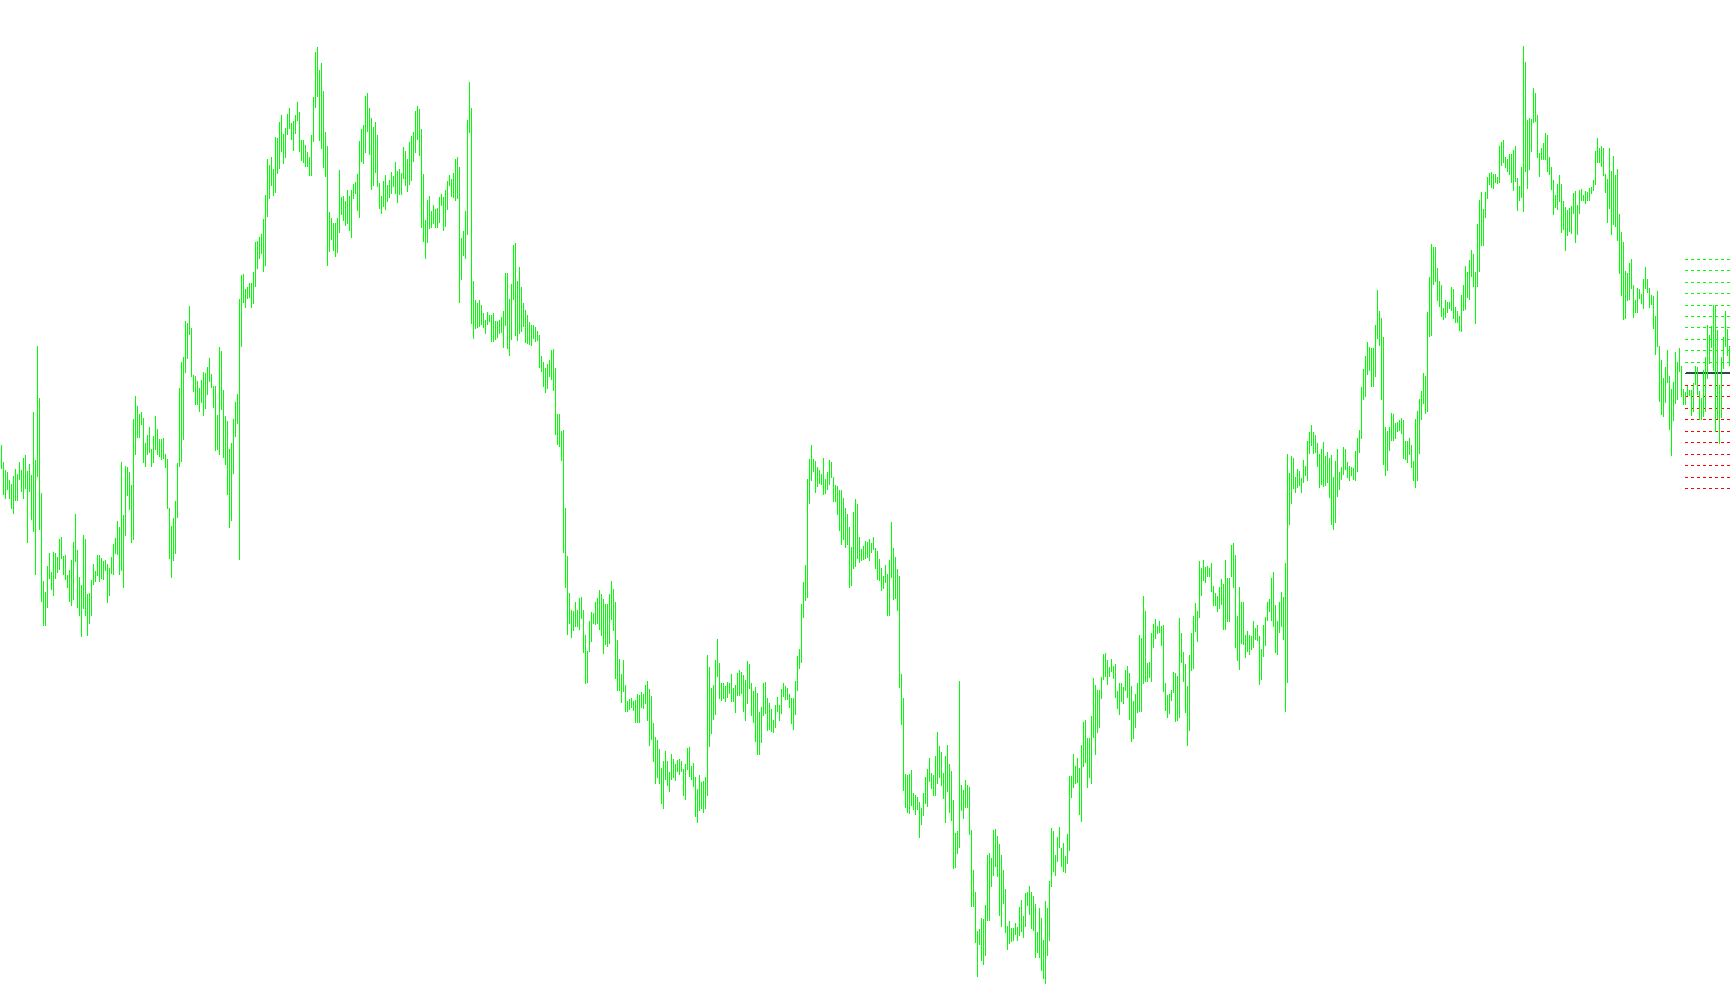
This indicator calculates and plots primary pivot points along with three distinct levels of support and resistance based on previous day's price extremes.

Pivots TimeShift History v1
Indicator

Pivots TimeShift History v1

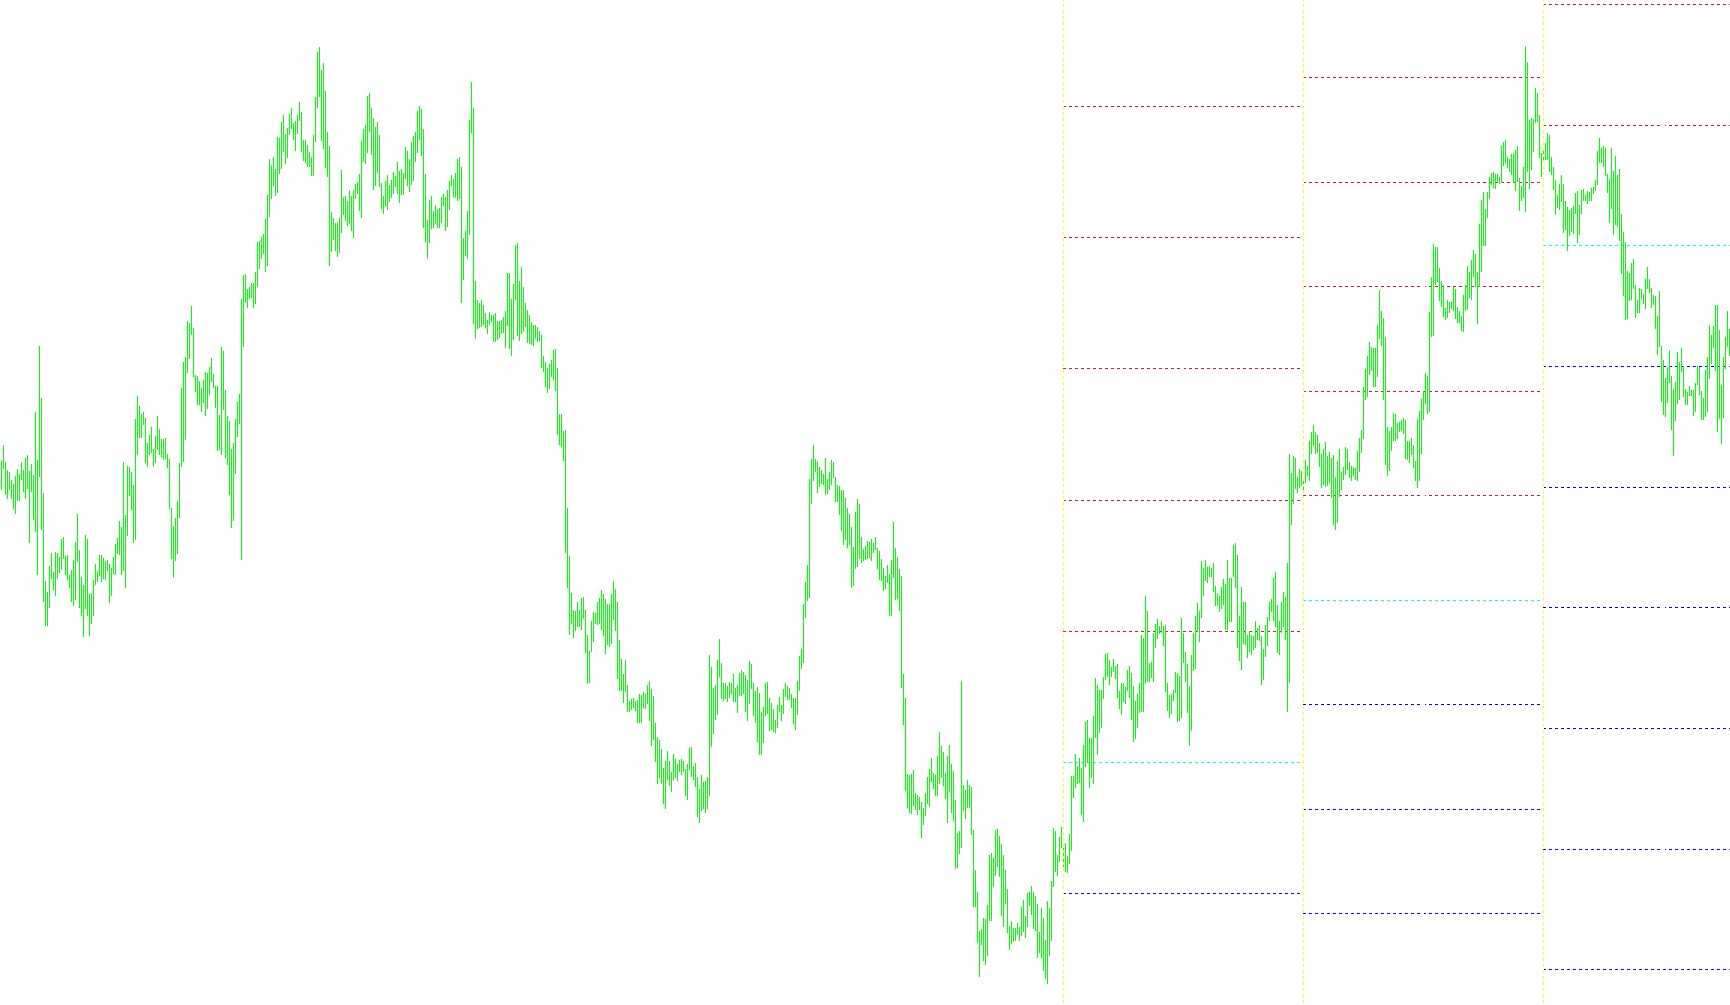
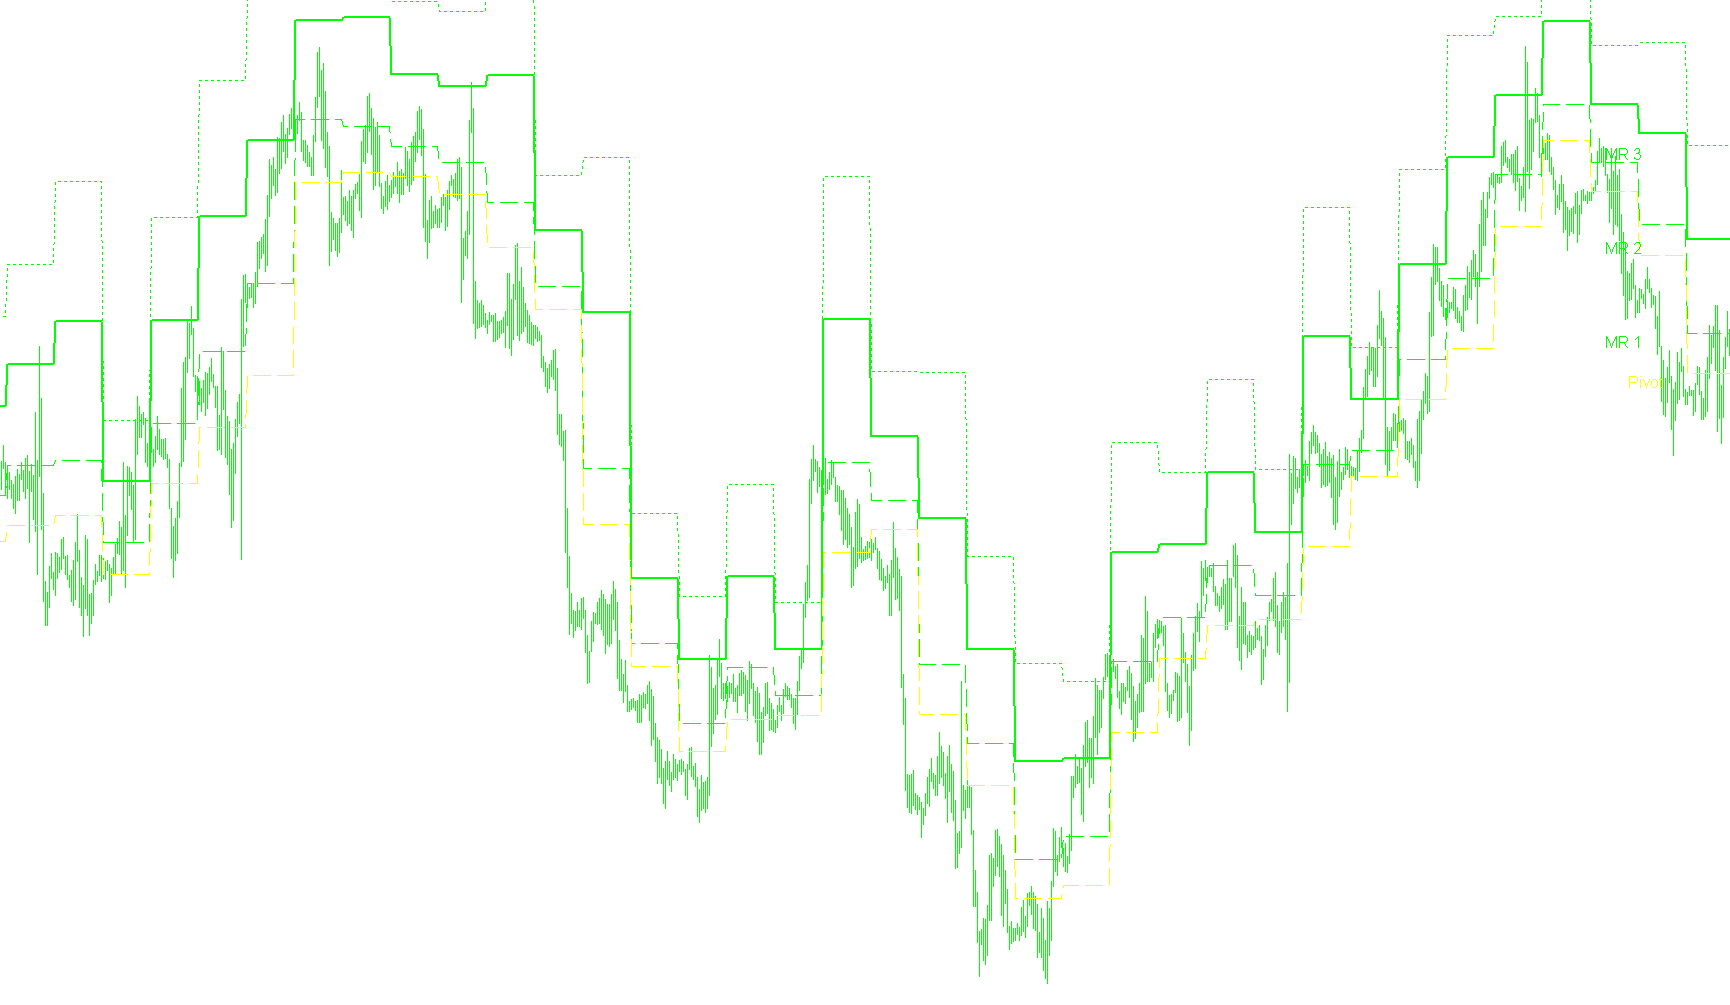
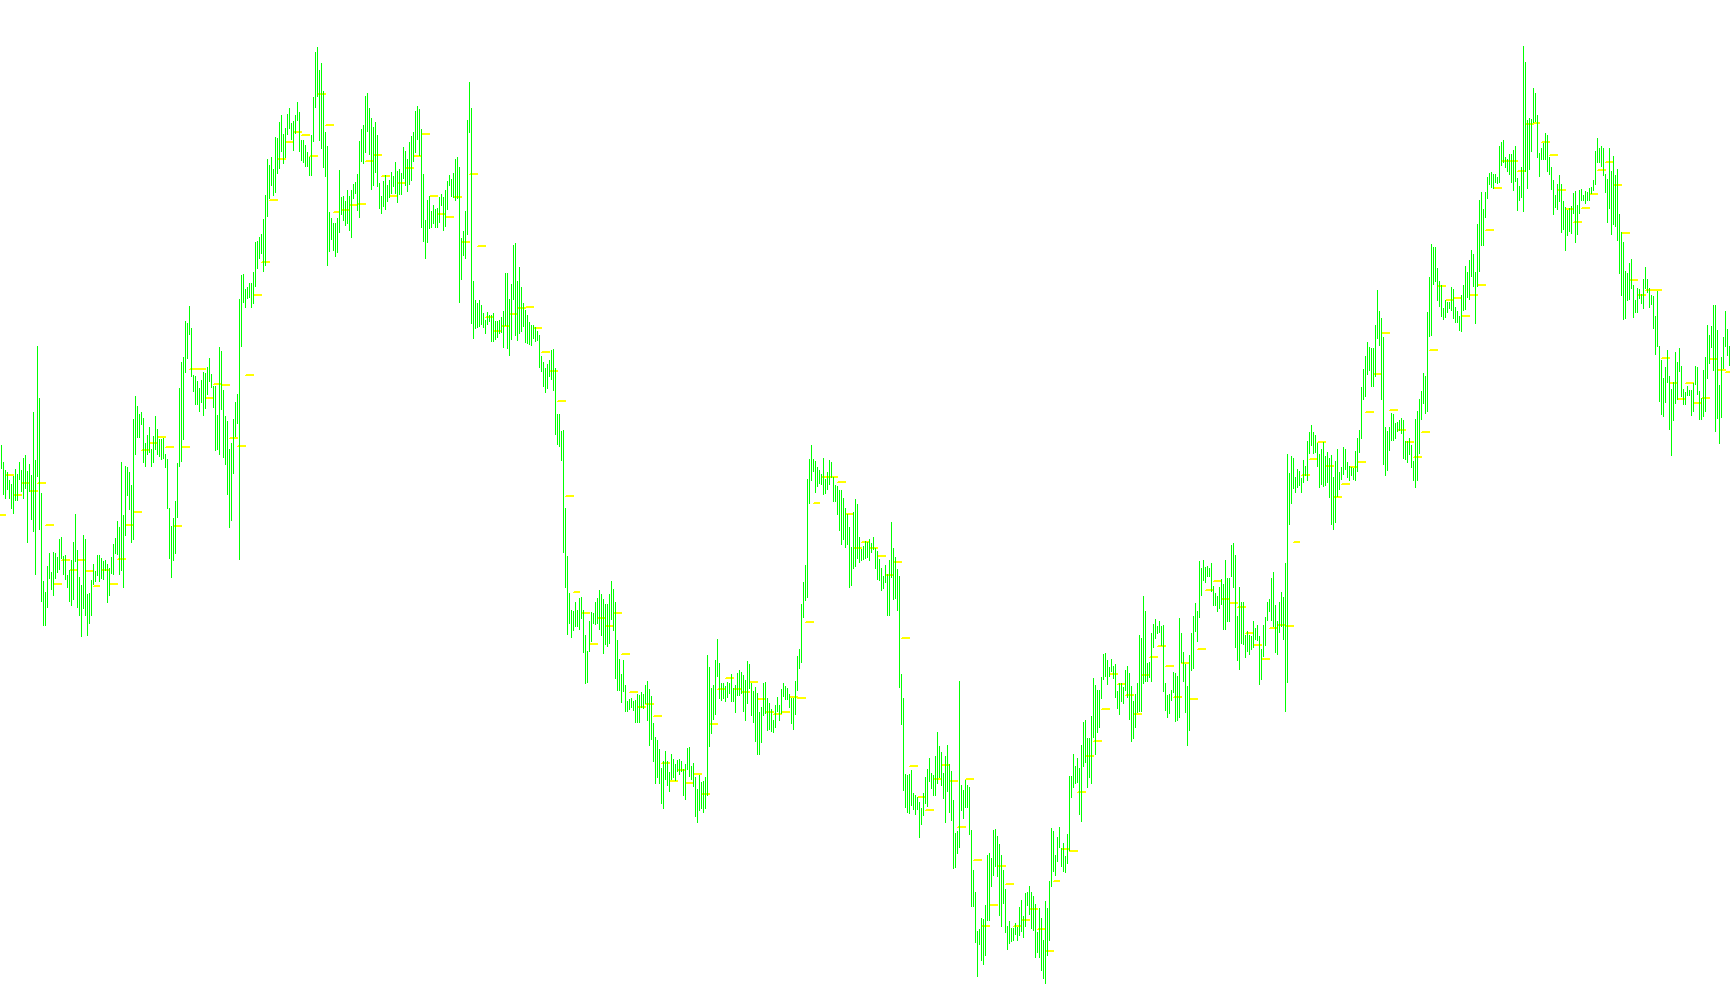
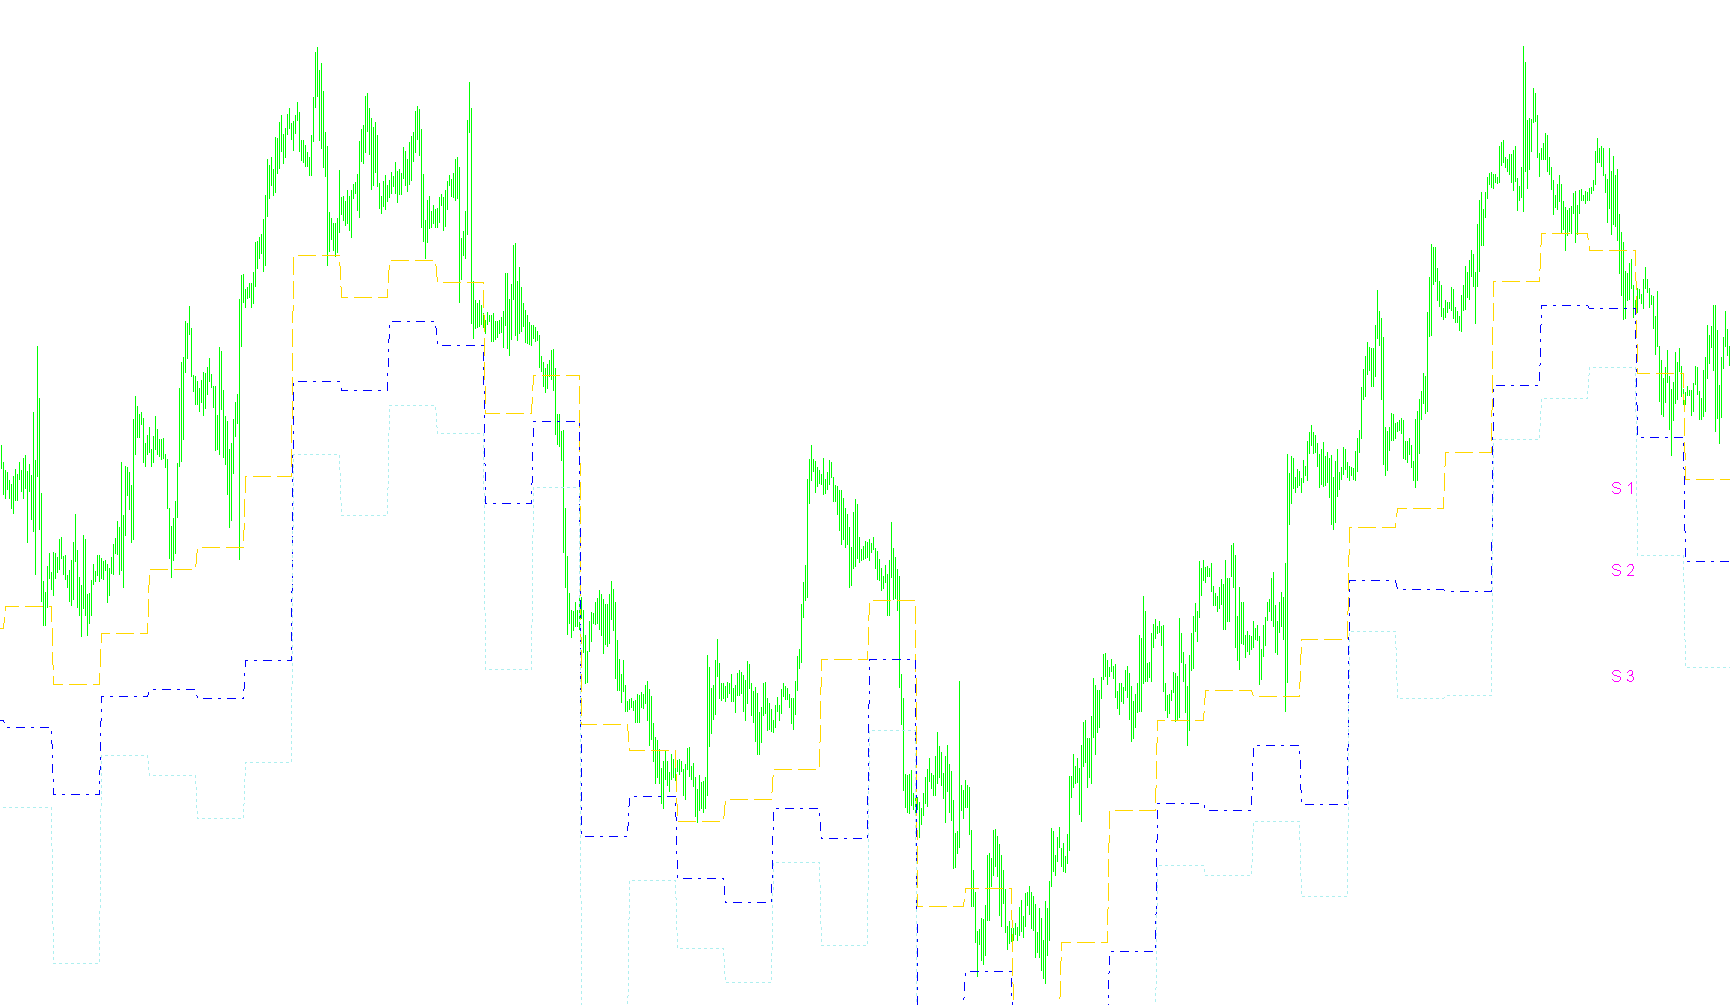
This indicator calculates and renders multi-day historical pivot points and associated support/resistance levels based on daily high, low, and closing price volatility.

PIVOTS
Indicator

PIVOTS

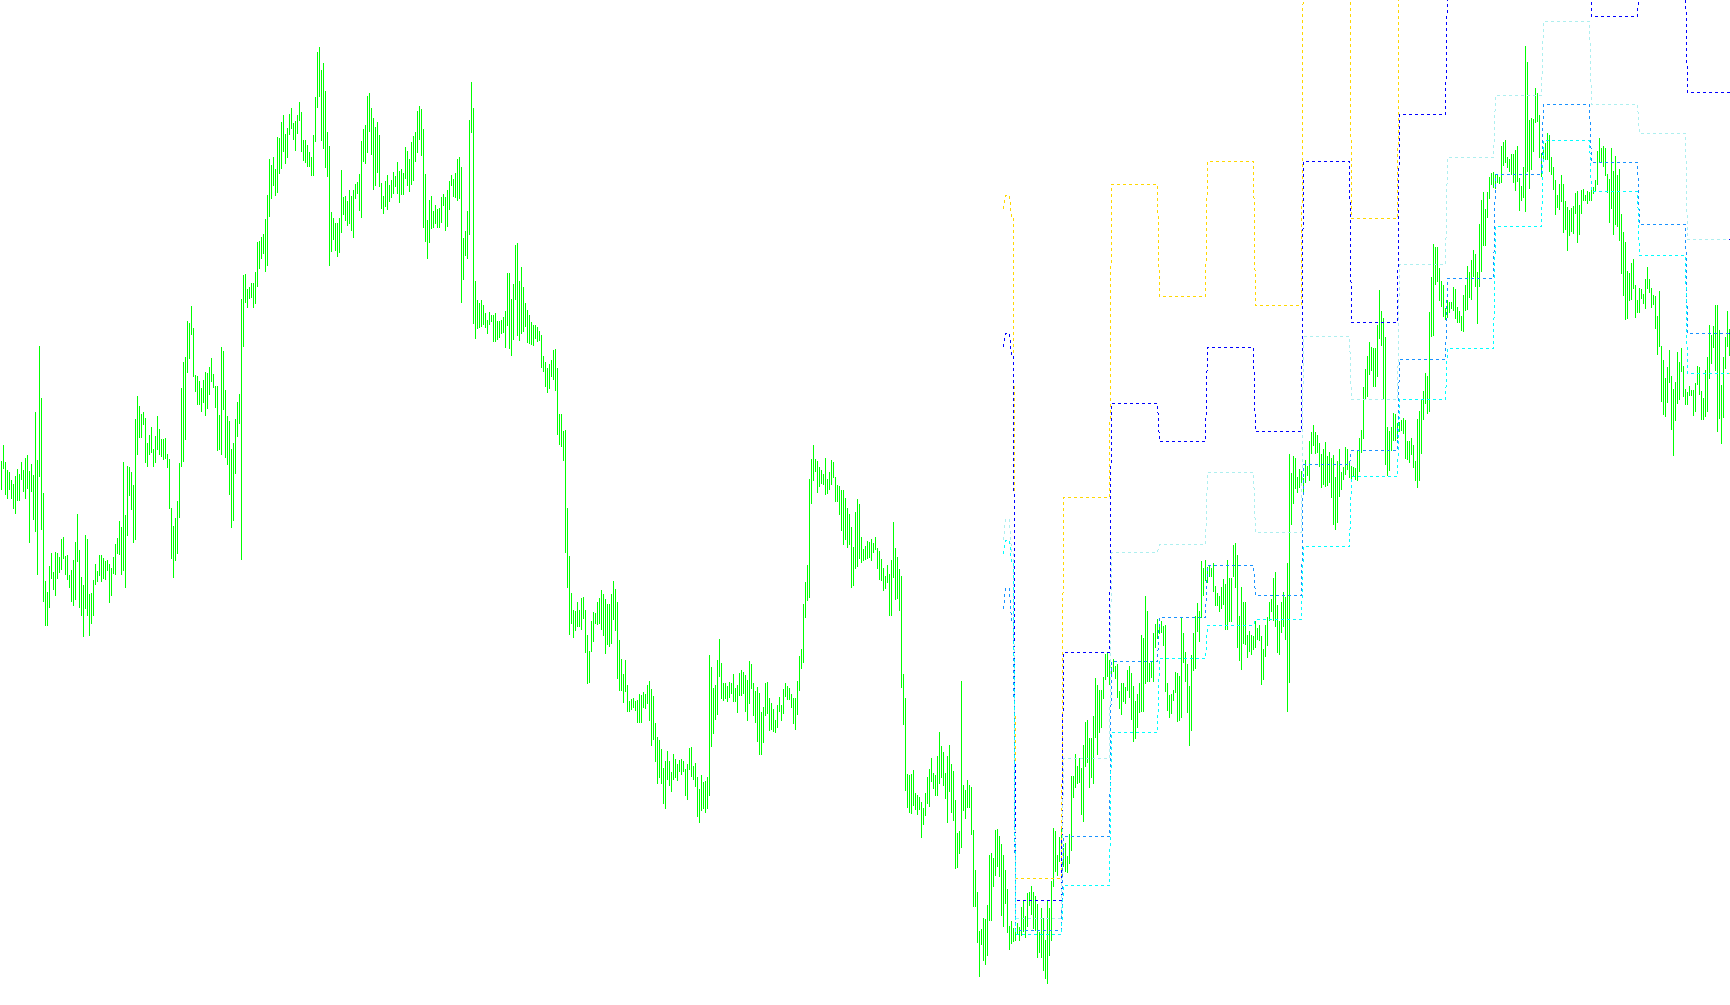
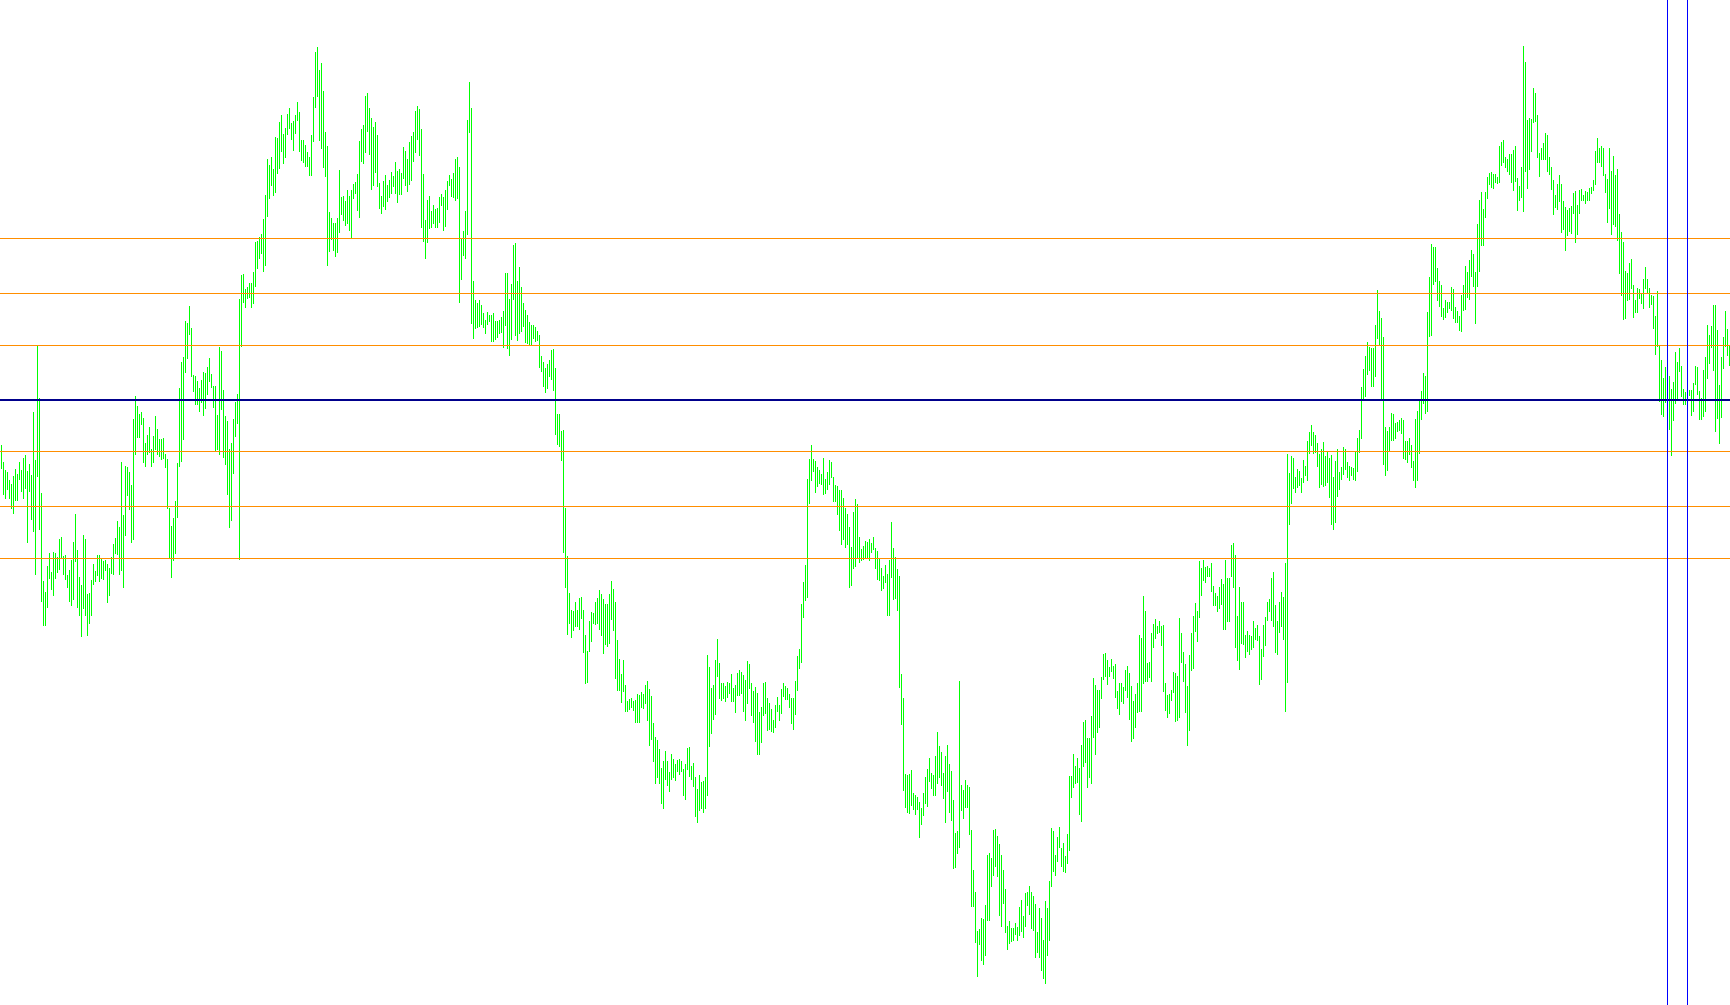
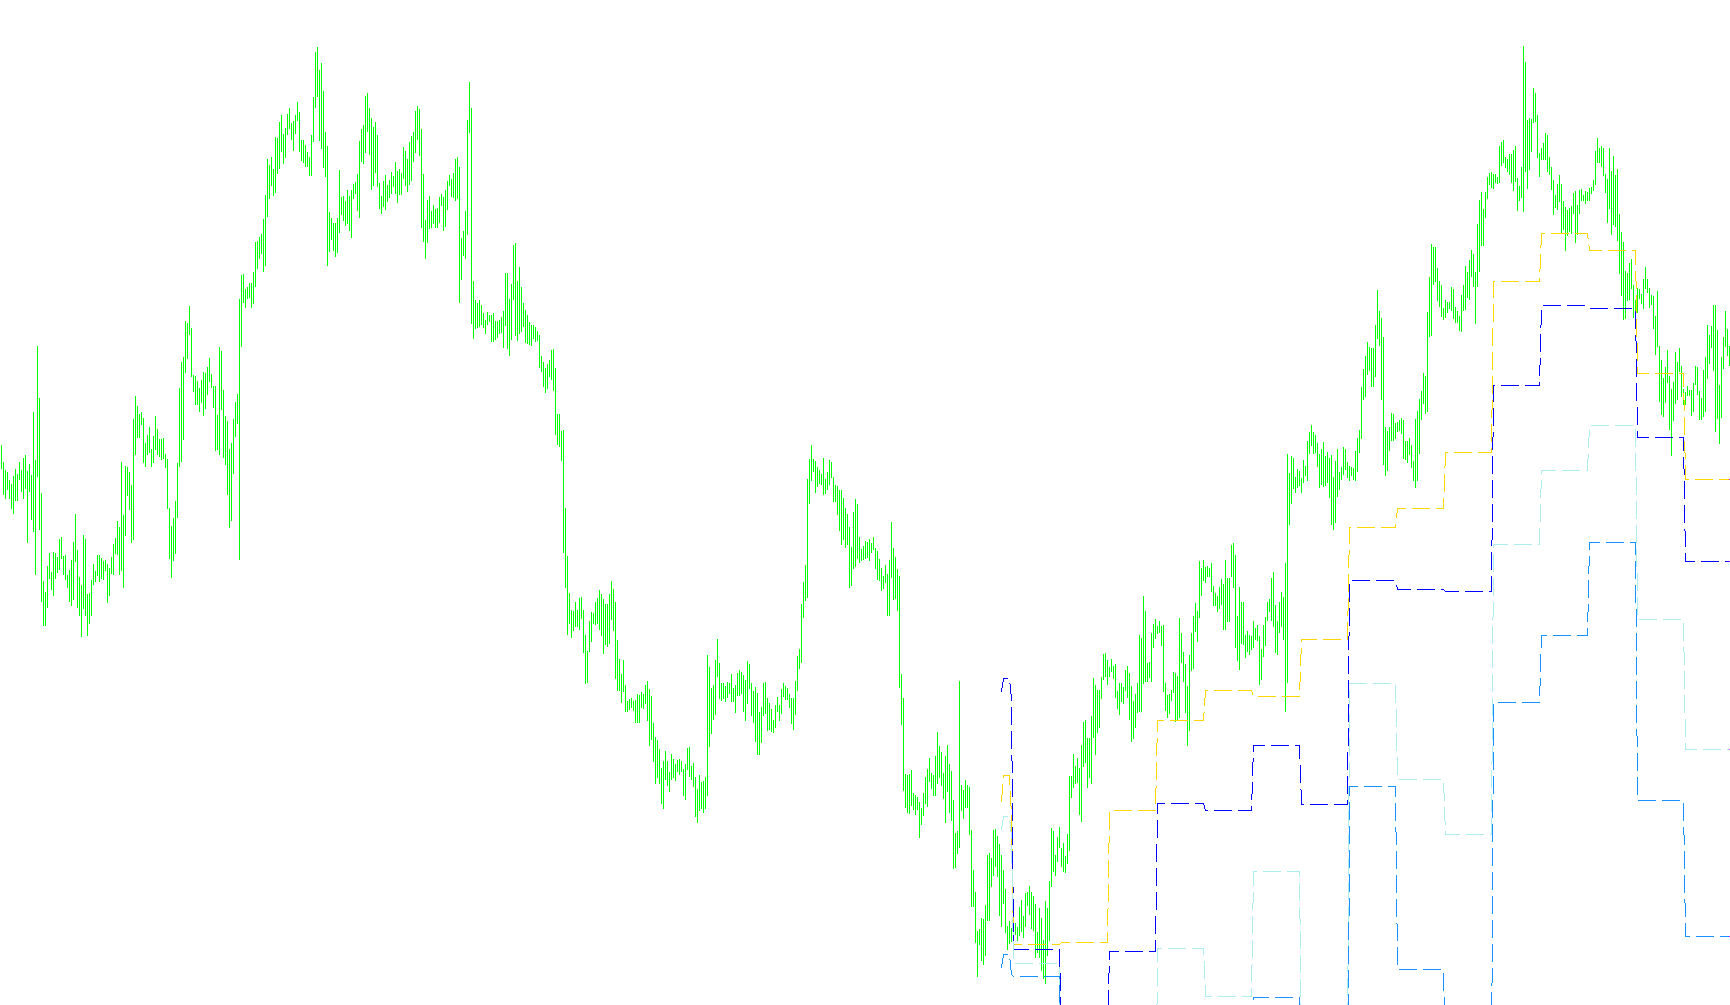
This indicator projects horizontal support and resistance levels based on daily high, low, and close prices, incorporating standard pivot points alongside a granular mid-range midpoint progression.

PivotsDaily1
Indicator

PivotsDaily1

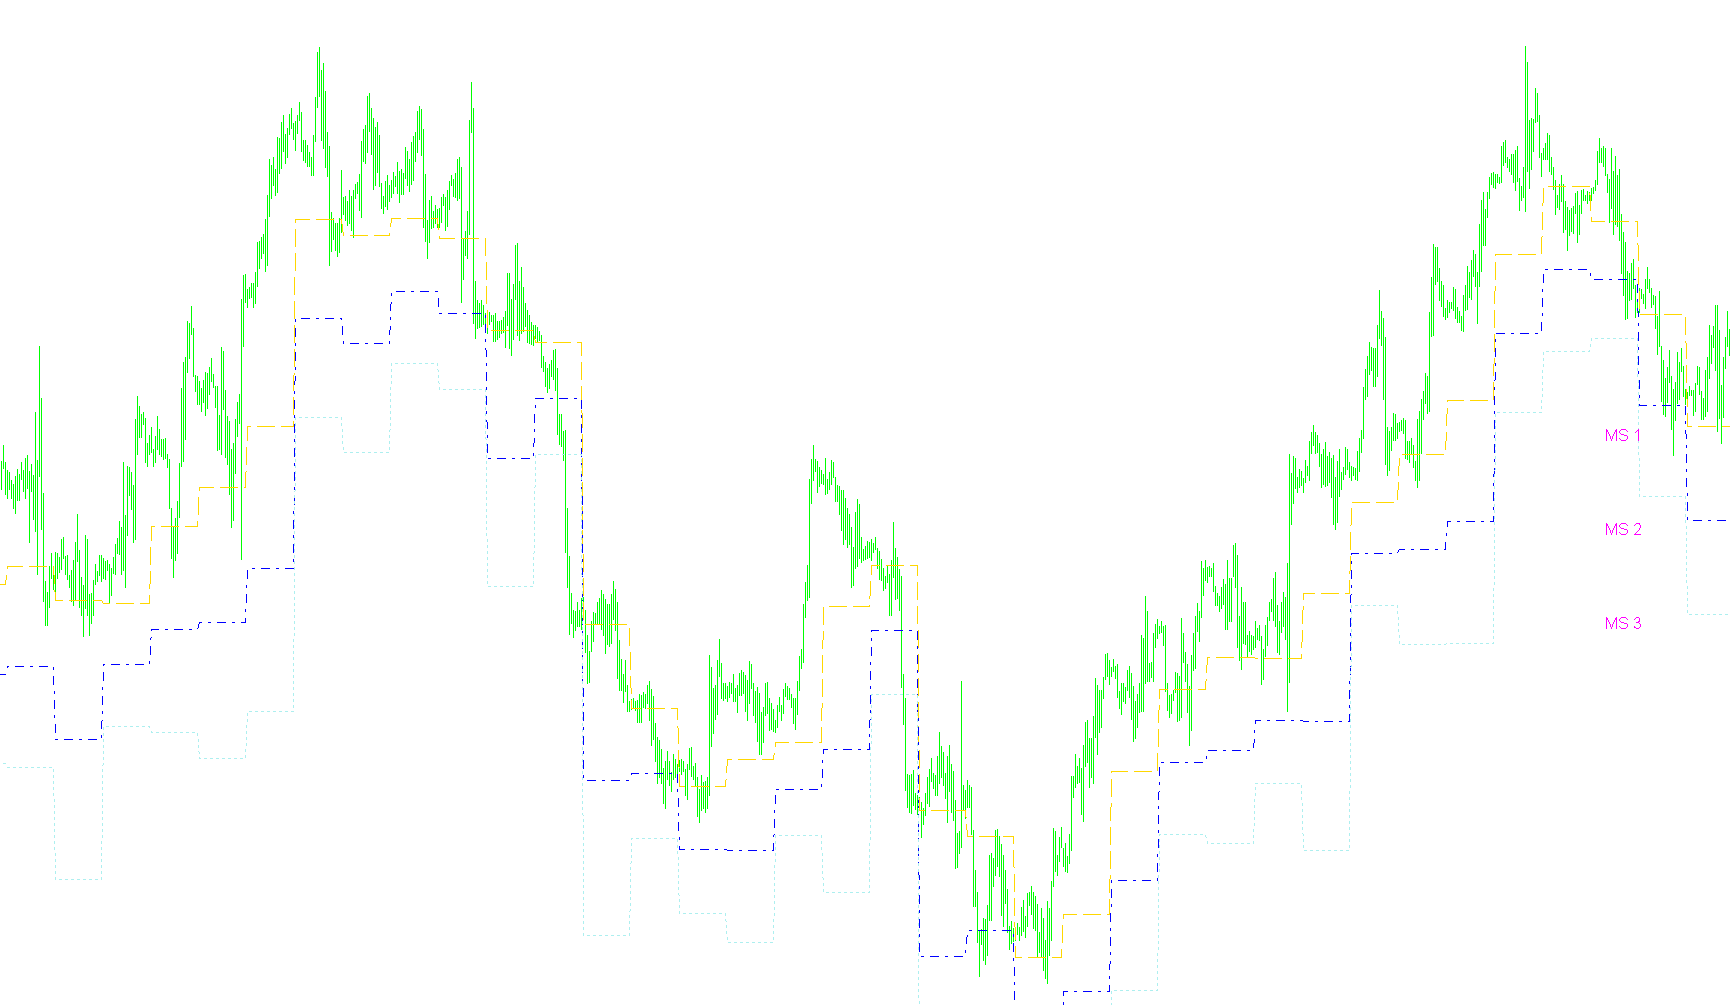
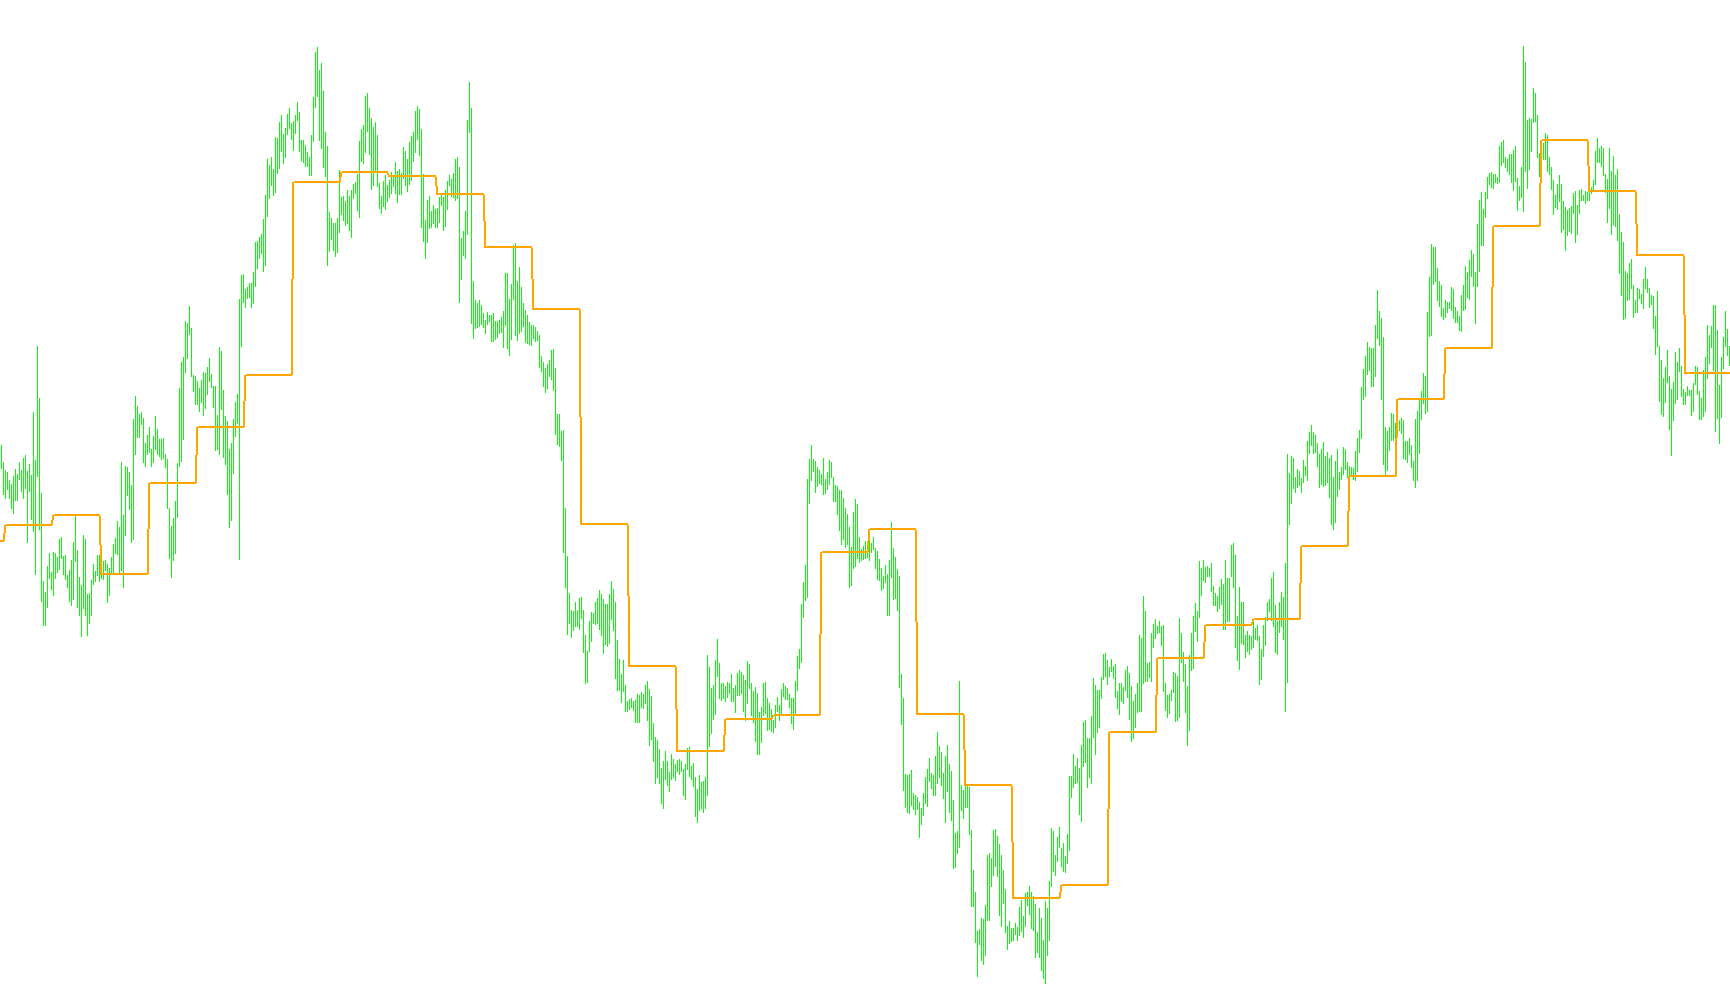
This indicator projects daily support and resistance levels by calculating central tendency points based on the previous day's high, low, and closing prices.

PivotsV2
Indicator

PivotsV2

This indicator synthesizes Camarilla breakout levels, Fibonacci retracements, and standard pivot points into a unified visual framework to identify high-probability institutional supply and demand zones.

Pivots_Daily
Indicator

Pivots_Daily

Automatically projects multi-layered support and resistance levels by calculating historical price extremes from previous sessions with GMT-aware time synchronization.

Pivots_Daily_M_SR_AIMEfx
Indicator

Pivots_Daily_M_SR_AIMEfx

This indicator calculates and plots multiple support and resistance levels based on previous daily high, low, and close prices while applying a GMT correction for precise time alignment.

Pivots_Daily_SR_AIMEfx
Indicator

Pivots_Daily_SR_AIMEfx

This indicator automatically identifies and plots daily pivot points, support levels, and resistance zones by calculating price boundaries from the previous day's high, low, and closing values with integrated GMT time synchronization.

Pivots_Monthly
Indicator

Pivots_Monthly

This indicator projects multi-tier monthly pivot points and median support/resistance levels by calculating price extremes and closing values from preceding lunar cycles.

Pivots_v1
Indicator

Pivots_v1

This indicator synthesizes historical price action to project dynamic support and resistance zones by overlaying Camarilla breakouts, Fibonacci retracements, and standard pivot calculations.

Pivots_v2
Indicator

Pivots_v2

Calculates structural price equilibrium levels by identifying key rotation points within high-volatility market cycles.

Pivots_v3
Indicator

Pivots_v3

This indicator dynamically projects daily liquidity zones by synthesizing Camarilla rotation levels, Fibonacci retracements, and standard pivot structures to identify high-probability institutional supply and demand areas.

Pivots_v4
Indicator

Pivots_v4

This technical indicator maps high-precision trading levels by integrating Camarilla breakout zones, standard daily pivots, Fibonacci retracements, and midpoint equilibrium lines into a single visual dashboard.

Pivots_v5
Indicator

Pivots_v5

This indicator calculates and displays Camarilla, Fibonacci, and standard pivot points, along with mid-pivots, on a chart, providing potential support and resistance levels for trading.

Pivots_Weekly
Indicator

Pivots_Weekly

Dynamically calculates weekly price floors and ceilings using historical high, low, and closing data to identify key structural support and resistance levels.

pivot_###Auto Pivot_M
Indicator

pivot_###Auto Pivot_M

This indicator dynamically projects daily, weekly, and monthly pivot points along with their respective support and resistance levels while automatically correcting for weekend market gaps.

Pivot_AllLevels
Indicator

Pivot_AllLevels

This indicator dynamically projects daily pivot points, support levels (S1-S3), and resistance zones (R1-R3) by calculating the arithmetic mean of the previous period's high, low, and closing prices.

Pivot_AllLevels_1_
Indicator

Pivot_AllLevels_1_

This indicator dynamically calculates and projects daily pivot points, resistance, and support levels based on high, low, and closing prices of the previous trading session.

Pivot_Auto
Indicator

Pivot_Auto

This indicator dynamically projects daily, weekly, and monthly pivot points along with their corresponding support and resistance levels while correcting for Sunday market gaps.

Pivot_AXEL_MF_0-3255
Indicator

Pivot_AXEL_MF_0-3255

This indicator dynamically calculates and plots three distinct daily pivot levels based on specific high, low, and close price actions across Asian, European, and American trading sessions while accounting for seasonal daylight savings shifts.

Indicator

Pivot_Backtest

Indicator

Pivot_Backtest_v1

Pivot_ColorMod
Indicator

Pivot_ColorMod

This indicator calculates daily support and resistance levels by identifying the central price gravity point based on previous period high, low, and closing values.

Pivot_Crazy
Indicator

Pivot_Crazy

This indicator calculates dynamic support and resistance levels by extracting high and low extremes from specific higher timeframes to project geometric pivot zones onto the current chart.

Pivot_DOTS
Indicator

Pivot_DOTS

This indicator calculates and visualizes daily pivot points, standard support/resistance levels, and intermediate midpoint zones based on the previous day's price action range.
Pivot_ESAZ_Day
Indicator

Pivot_ESAZ_Day

This indicator projects historical daily pivot points, support/resistance levels, and interlocking price zones across a multi-day timeframe to identify structural supply and demand areas.

Pivot_ESAZ_Monthly
Indicator

Pivot_ESAZ_Monthly

This indicator projects multi-layered monthly pivot levels, including primary resistance/support zones and mid-point sub-levels, to visualize high-probability price equilibrium boundaries.

Pivot_ESAZ_Week
Indicator

Pivot_ESAZ_Week

This indicator projects weekly pivot points, multi-tier support/resistance levels, and inter-zone grid boundaries based on historical weekly price action.

Pivot_Lines
Indicator

Pivot_Lines

This indicator synthesizes multi-layered support and resistance levels by integrating standard daily pivots, Camarilla break-out points, and fractional midpoint subdivisions.

Pivot_Lines1
Indicator

Pivot_Lines1

This indicator projects standard pivots, Camarilla breakout levels, and intermediate midpoint thresholds using historical high, low, and closing data.

Pivot_Lines_daily_ex_Sundays
Indicator

Pivot_Lines_daily_ex_Sundays

This indicator dynamically projects daily, Camarilla, and midpoint pivot levels by synthesizing historical high, low, and closing price data into a comprehensive support and resistance framework.

Pivot_Mid_Resistance_Historical
Indicator

Pivot_Mid_Resistance_Historical

This indicator calculates and plots historical Camarilla pivot levels and their respective midpoint resistance markers based on the previous day's price action.

Pivot_Mid_Resistance_Historical2
Indicator

Pivot_Mid_Resistance_Historical2

This indicator calculates and projects historical Camarilla pivot levels by identifying the arithmetic midpoints between primary resistance boundaries based on previous day's price extremes.

Pivot_Mid_Support_Historical
Indicator

Pivot_Mid_Support_Historical

This indicator projects multi-layered midpoint support levels derived from previous daily high, low, and close price extremes.

Pivot_Mid_Support_Historical2
Indicator

Pivot_Mid_Support_Historical2

This indicator calculates and plots the intermediate price midpoints derived from Camarilla pivot levels based on historical daily high, low, and close data.

Pivot_Monday Fixed
Indicator

Pivot_Monday Fixed

This indicator calculates and projects seven distinct price levels—including primary pivot points, three support zones, and three resistance boundaries—based on the previous session's high, low, and closing price.

Pivot_MonthlyColorMod
Indicator

Pivot_MonthlyColorMod

This indicator projects horizontal support and resistance levels by calculating a weighted arithmetic mean of the previous month's price extremes and closing values.

Pivot_only_H1
Indicator

Pivot_only_H1

This indicator calculates and projects chronological horizontal price levels based on the arithmetic mean of the previous hour's high, low, and close prices.

Pivot_only_H4
Indicator

Pivot_only_H4

This indicator calculates and plots historical price equilibrium levels based on the arithmetic mean of the preceding H4 candle's high, low, and close prices.

Pivot_only_M15
Indicator

Pivot_only_M15

This indicator calculates and plots historical price equilibrium levels by averaging the previous candle's high, low, and closing prices on a 15-minute timeframe.

Pivot_only_M30
Indicator

Pivot_only_M30

This indicator projects horizontal levels based on the average of the previous candle's high, low, and close prices specifically for the 30-minute timeframe.

Pivot_Resistance_Historical
Indicator

Pivot_Resistance_Historical

This indicator dynamically calculates and plots daily Camarilla pivot levels and triple resistance thresholds based on the previous session's high, low, and closing price data.

Pivot_Resistance_Historical2
Indicator

Pivot_Resistance_Historical2

This indicator dynamically projects daily Camarilla pivot levels and historical resistance boundaries based on previous session price extremes.

Pivot_RS_session
Indicator

Pivot_RS_session

This indicator calculates and visualizes high-low price pivots and dynamic support/resistance levels based on specific time-defined market sessions.

Pivot_Scalper
Indicator

Pivot_Scalper

This indicator calculates a central daily pivot point and projects nine symmetrical upper and lower support/resistance levels based on specific point increments.

Pivot_Support_Historical
Indicator

Pivot_Support_Historical

This indicator projects historical daily support levels (S1, S2, and S3) by calculating the arithmetic mean of the previous day's high, low, and close prices.

Pivot_Support_Historical2
Indicator

Pivot_Support_Historical2

This indicator calculates and plots multi-layered daily support levels based on the arithmetic mean of previous period high, low, and close prices.

Pivot_v1
Indicator

Pivot_v1

Calculates the central pivot point by averaging the previous day's high, low, and closing prices to identify key intraday price equilibrium.

Pivot_v2
Indicator

Pivot_v2

Calculates daily price floor and ceiling thresholds by synthesizing previous session extremes with current opening volatility.