Parabolic_Alert_Mod_001
Indicator

Parabolic_Alert_Mod_001

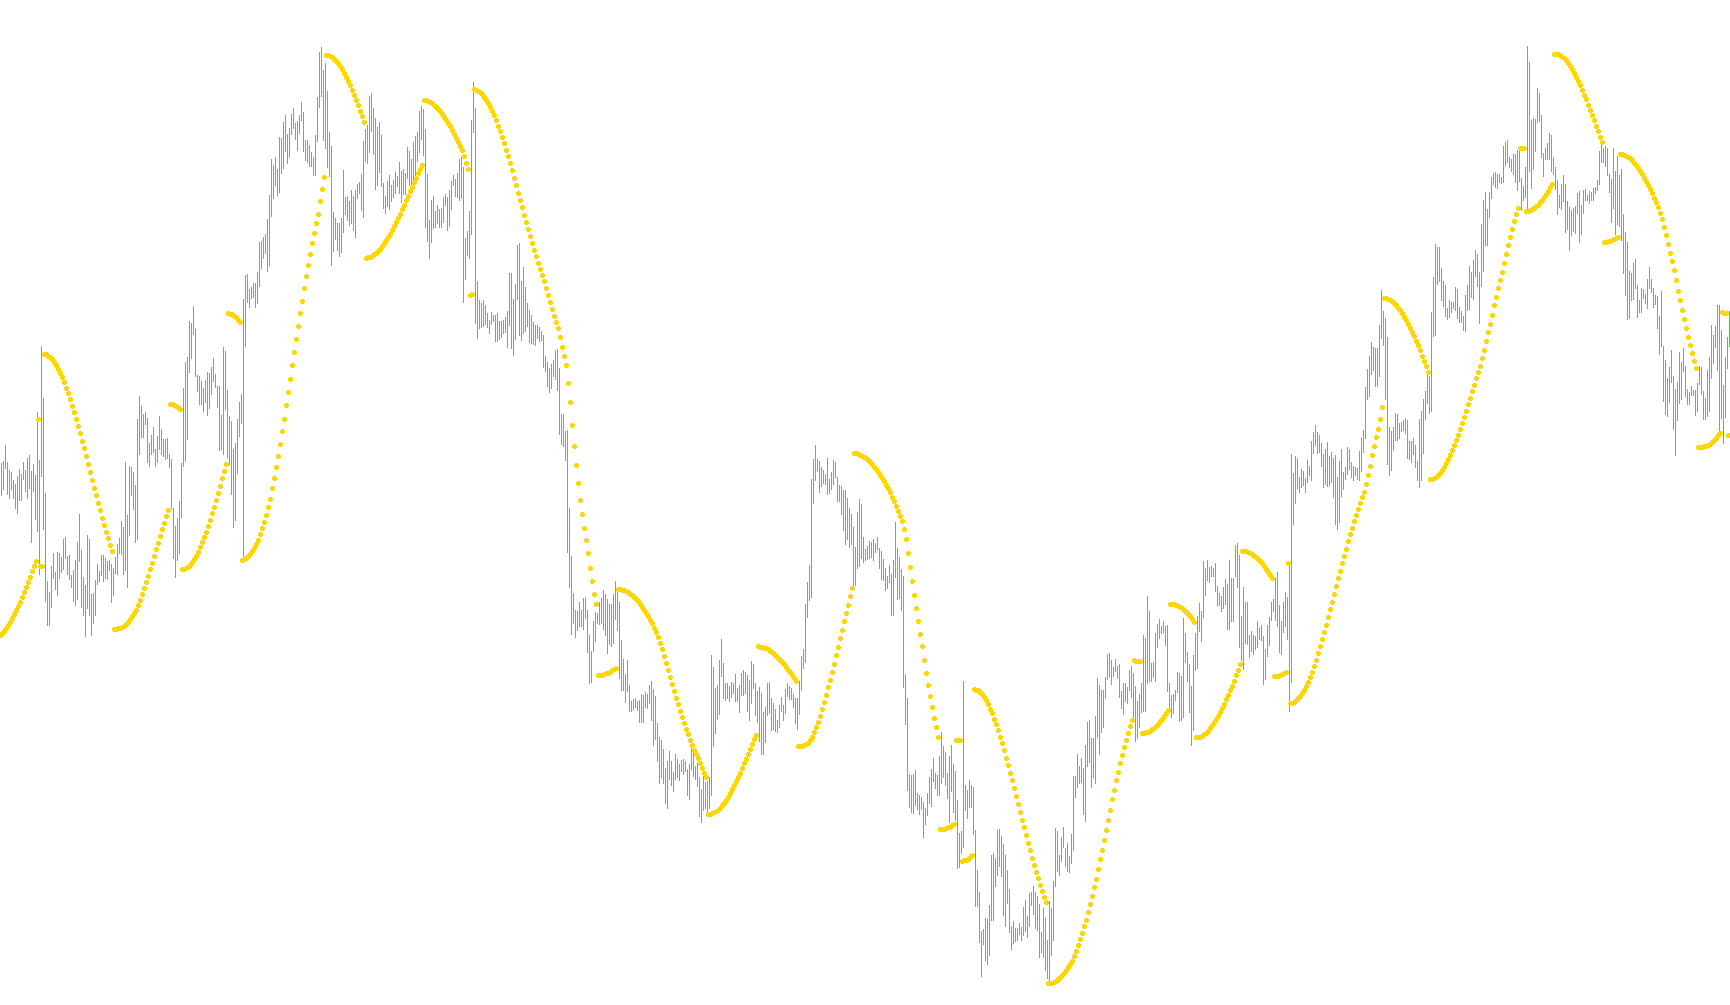
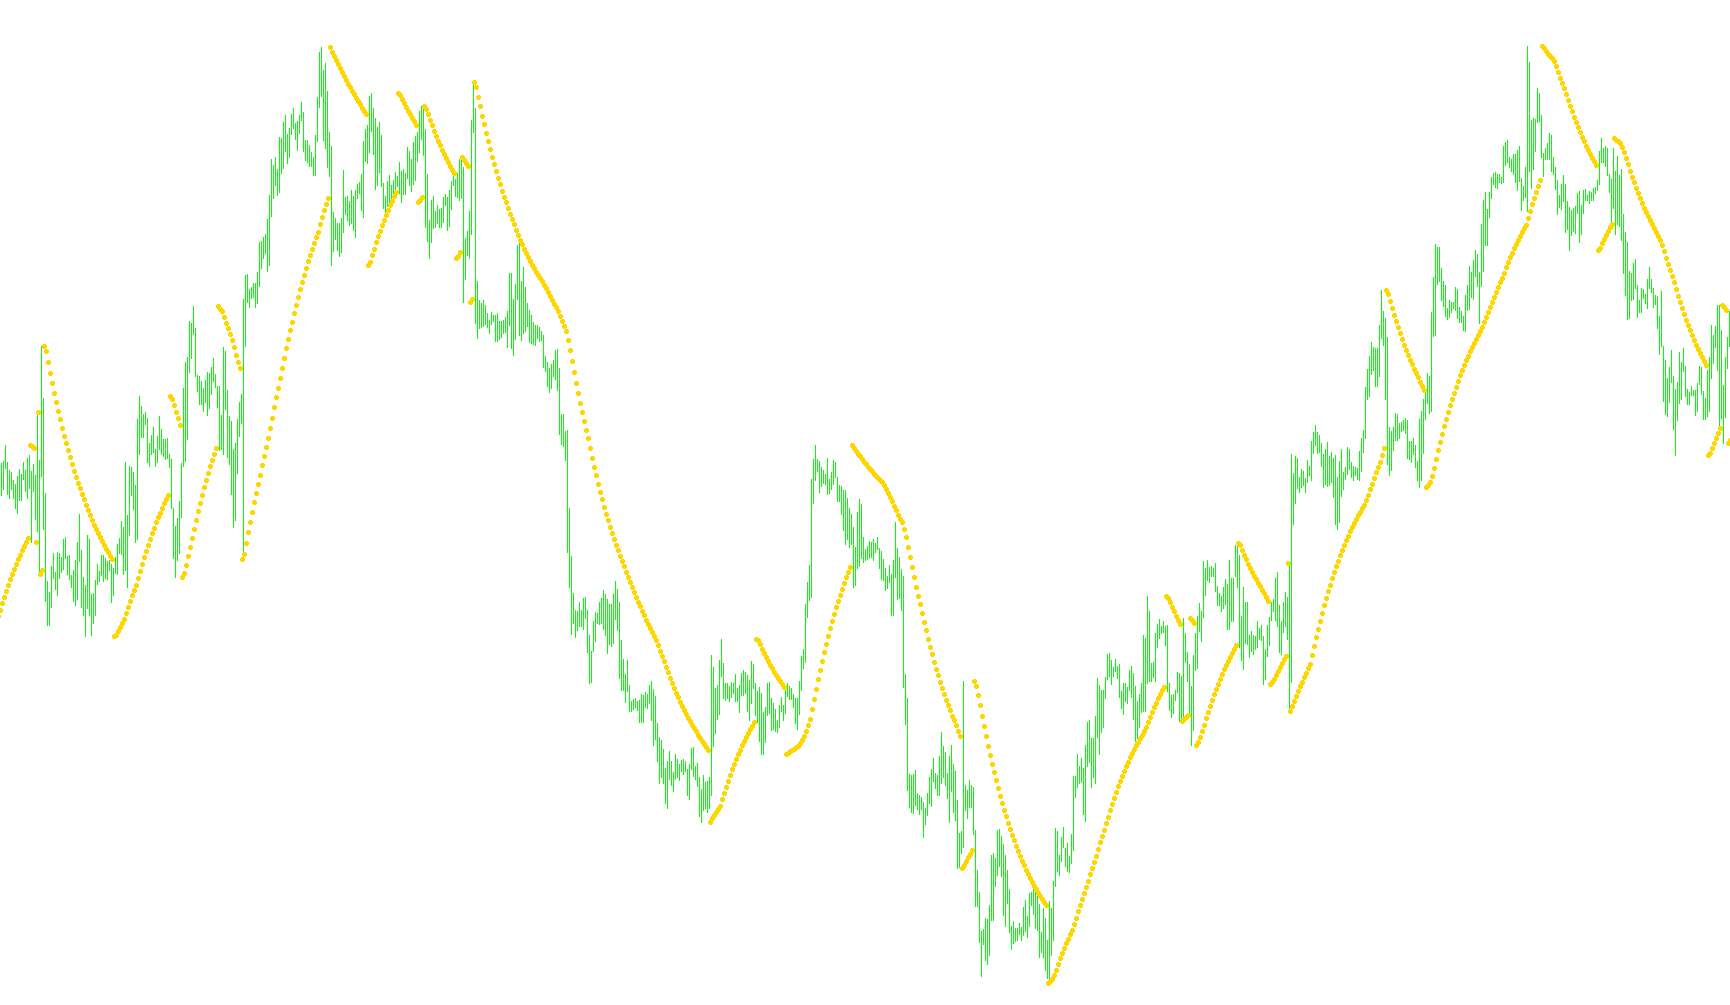
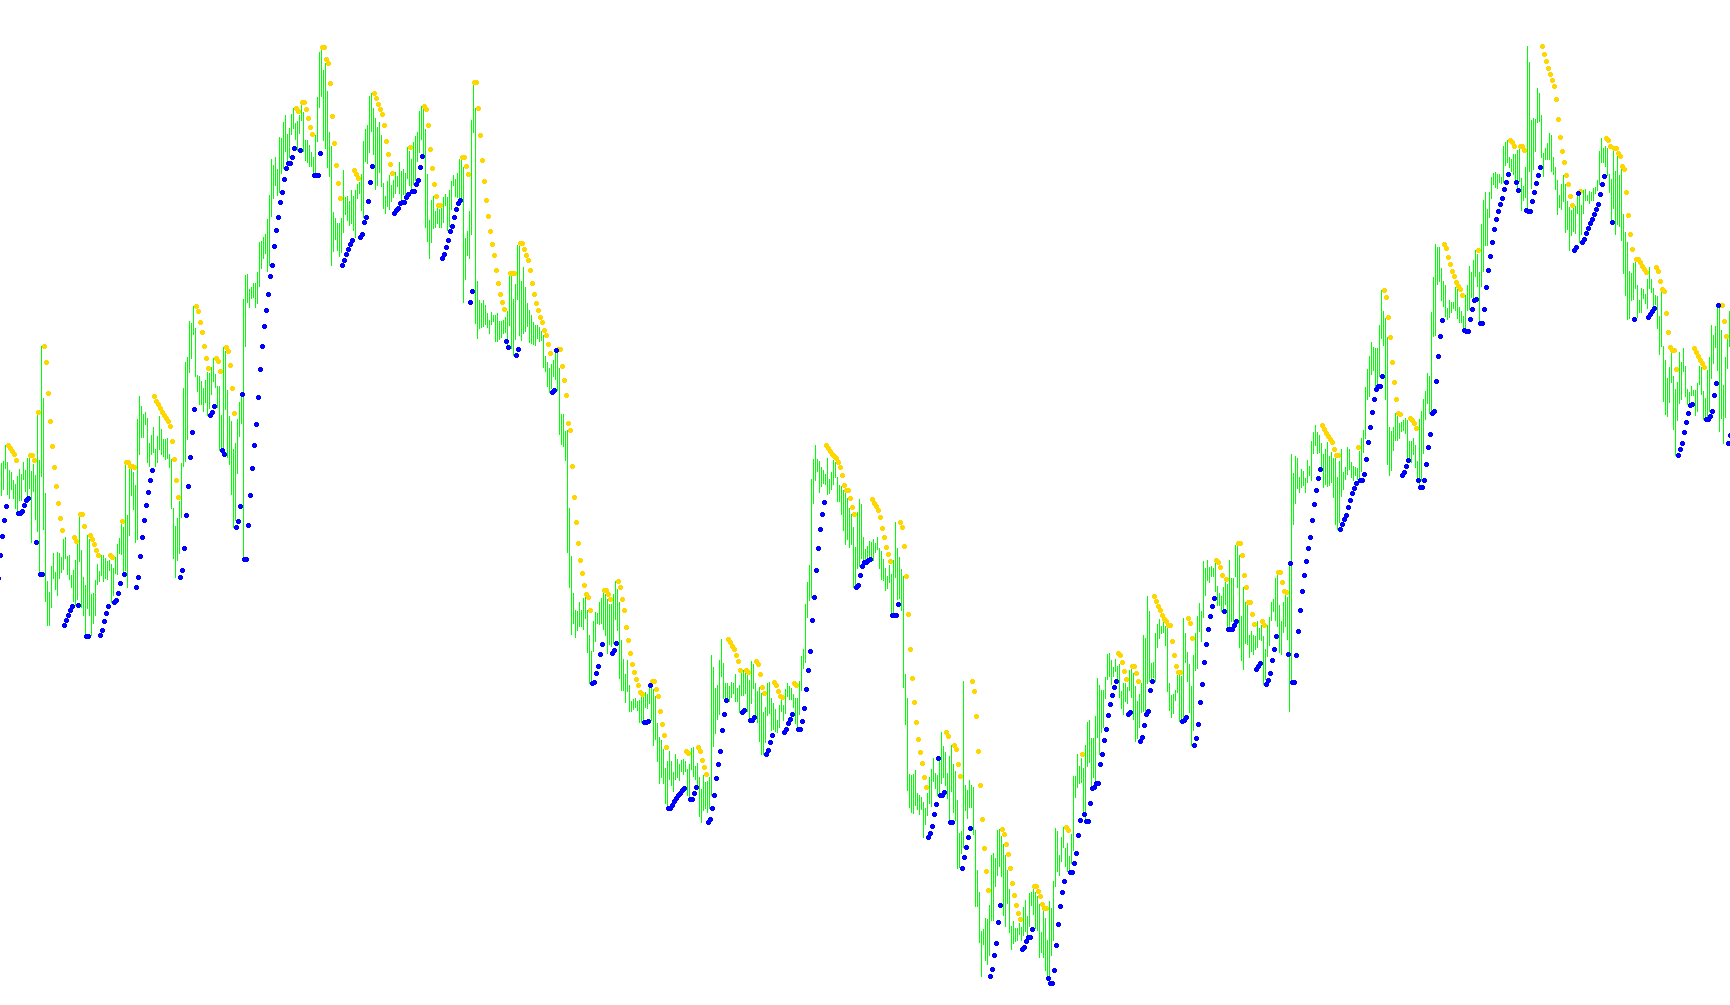
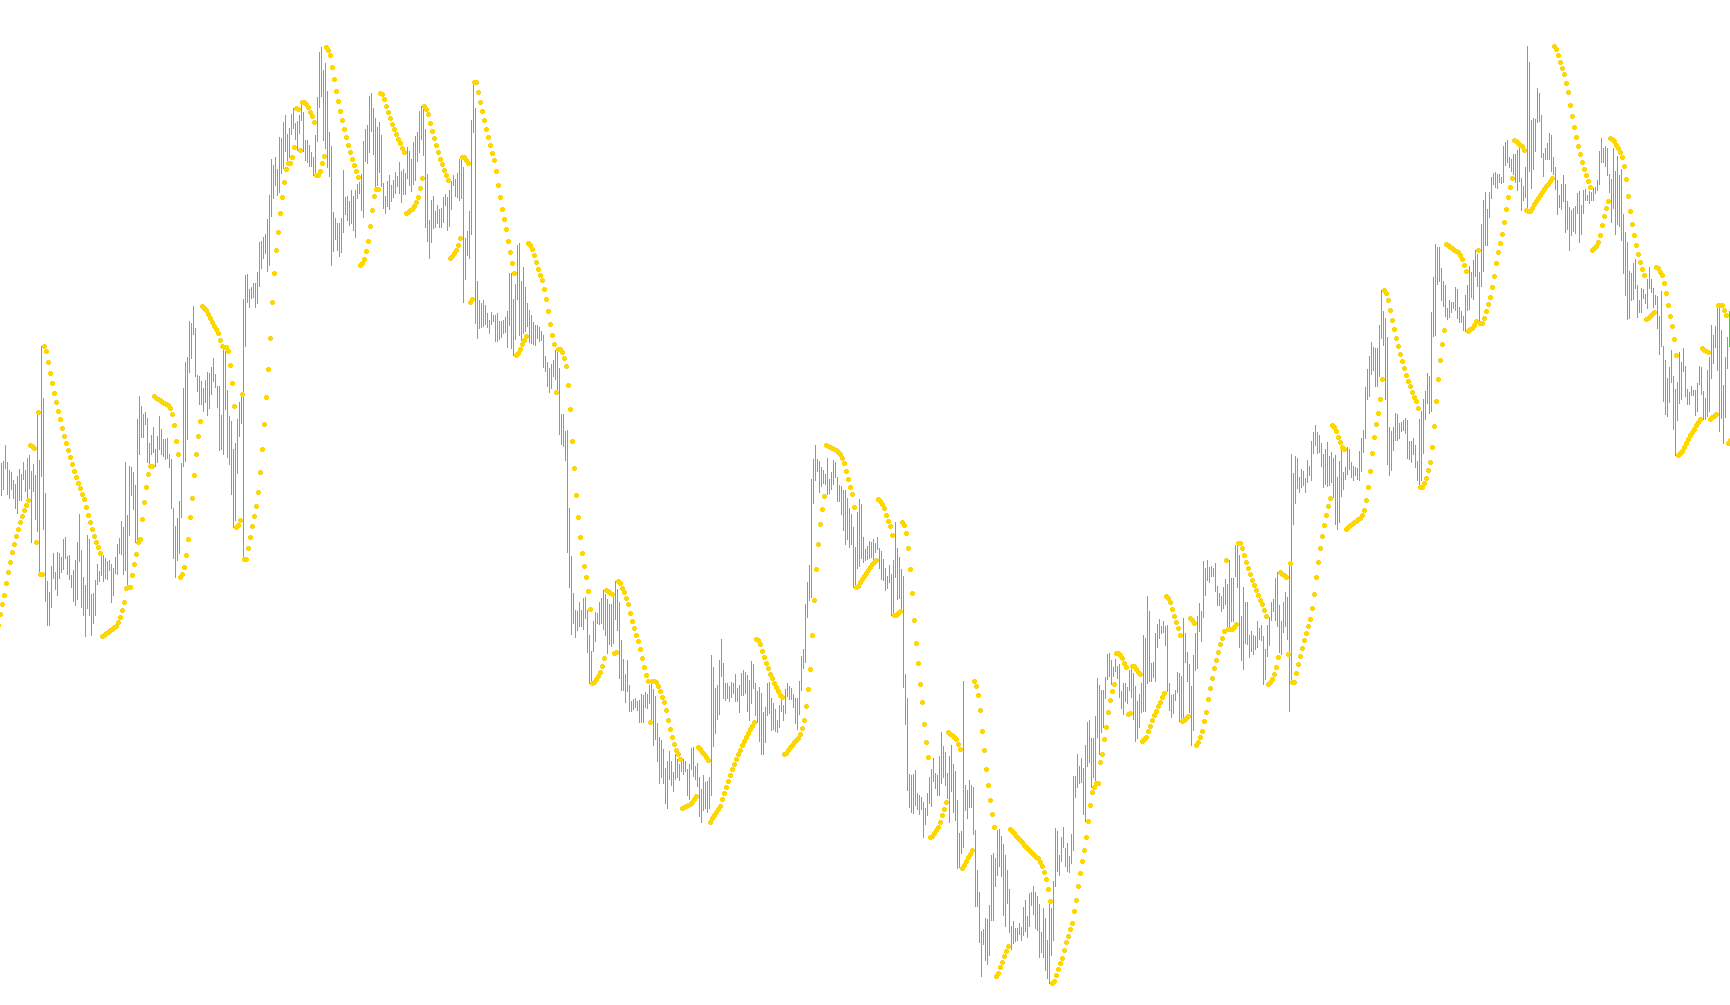
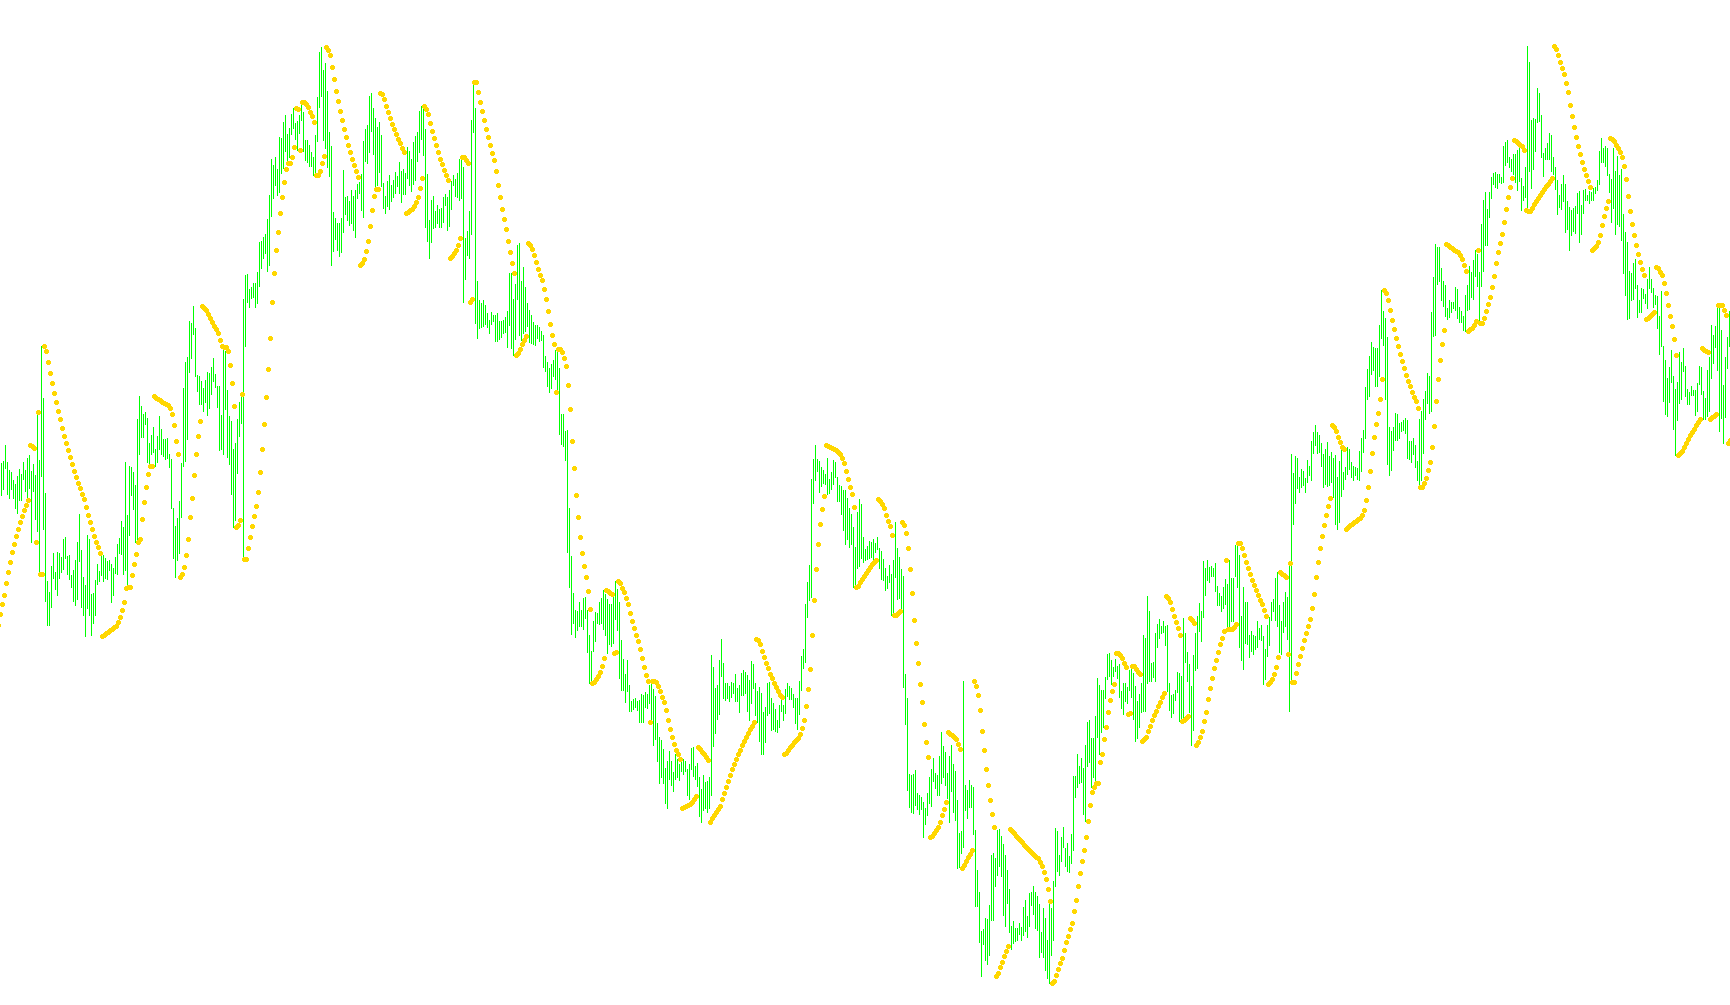
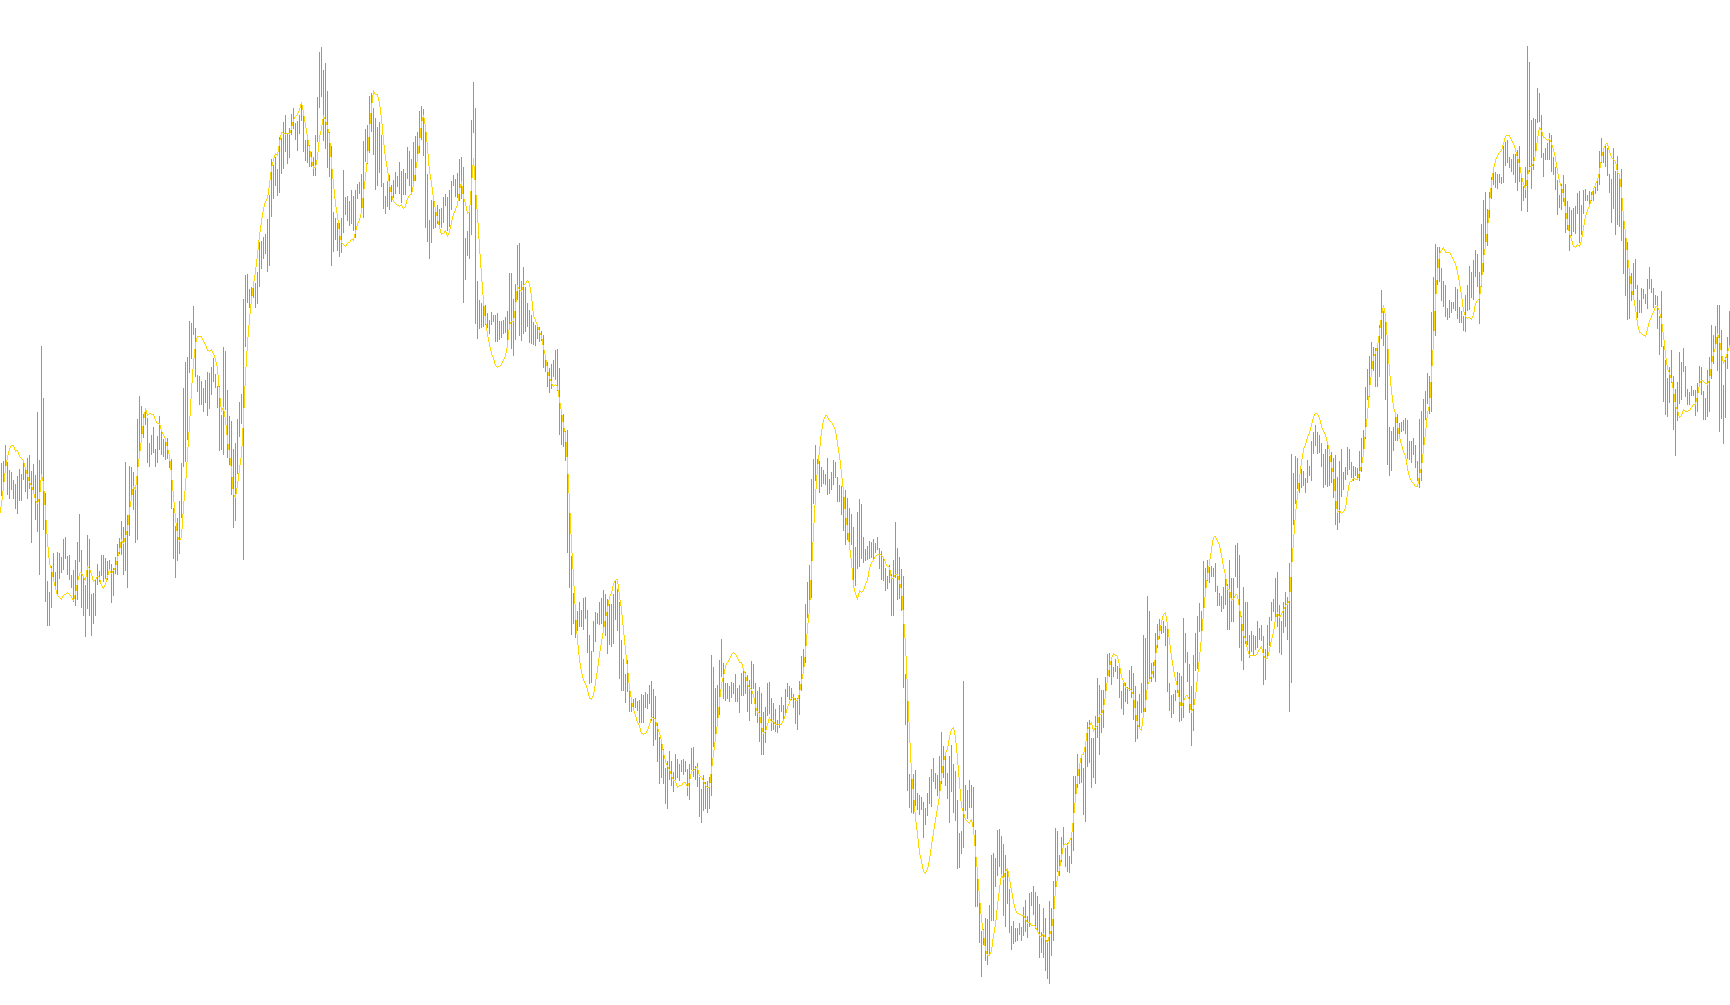
This indicator dynamically calculates a trailing stop-loss boundary that adjusts based on price extremes to trigger audible and email notifications upon trend exhaustion.

Parabolic_Alert_v1
Indicator

Parabolic_Alert_v1

This indicator calculates a trailing parabolic stop-loss and triggers audible alerts when price action breaches the dynamic threshold, signaling a trend reversal.

Parabolic_Alert_v3
Indicator

Parabolic_Alert_v3

This indicator tracks price momentum using a parabolic acceleration algorithm to identify trend exhaustion points and trigger audible alerts upon structural reversals.

Parabolic_best
Indicator

Parabolic_best

This indicator identifies trend exhaustion and potential price reversals by dynamically tracking parabolic price movements and signaling entry points when the current price breaches calculated volatility boundaries.

Indicator

Parabolic_best_TRO_MODIFIED_VERSION

Parabolic_mailalert
Indicator

Parabolic_mailalert

iSAR

This indicator identifies trend reversals by tracking the Parabolic SAR across higher timeframes and visually segregating upward and downward momentum channels.

Parabolic_standart2
Indicator

Parabolic_standart2

This indicator calculates a recursive price trajectory that adjusts its acceleration based on recent extremes to identify trend exhaustion and pivot points.

Parabolic_trendchaser_alert
Indicator

Parabolic_trendchaser_alert

iSAR

This indicator projects Parabolic SAR values from a secondary timeframe onto the current chart to identify overarching trend shifts and directional momentum.

Parabolic_v1
Indicator

Parabolic_v1

This script calculates a trailing stop-loss logic that dynamically adjusts based on price extremes to identify trend exhaustion and structural reversals.

Parabolic_v2
Indicator

Parabolic_v2

This indicator utilizes a dynamic parabolic SAR algorithm to identify trend shifts by calculating accelerating price distances and plotting reversal signals based on extreme high and low extremes.

Parabolic_ZZ
Indicator

Parabolic_ZZ

iSAR

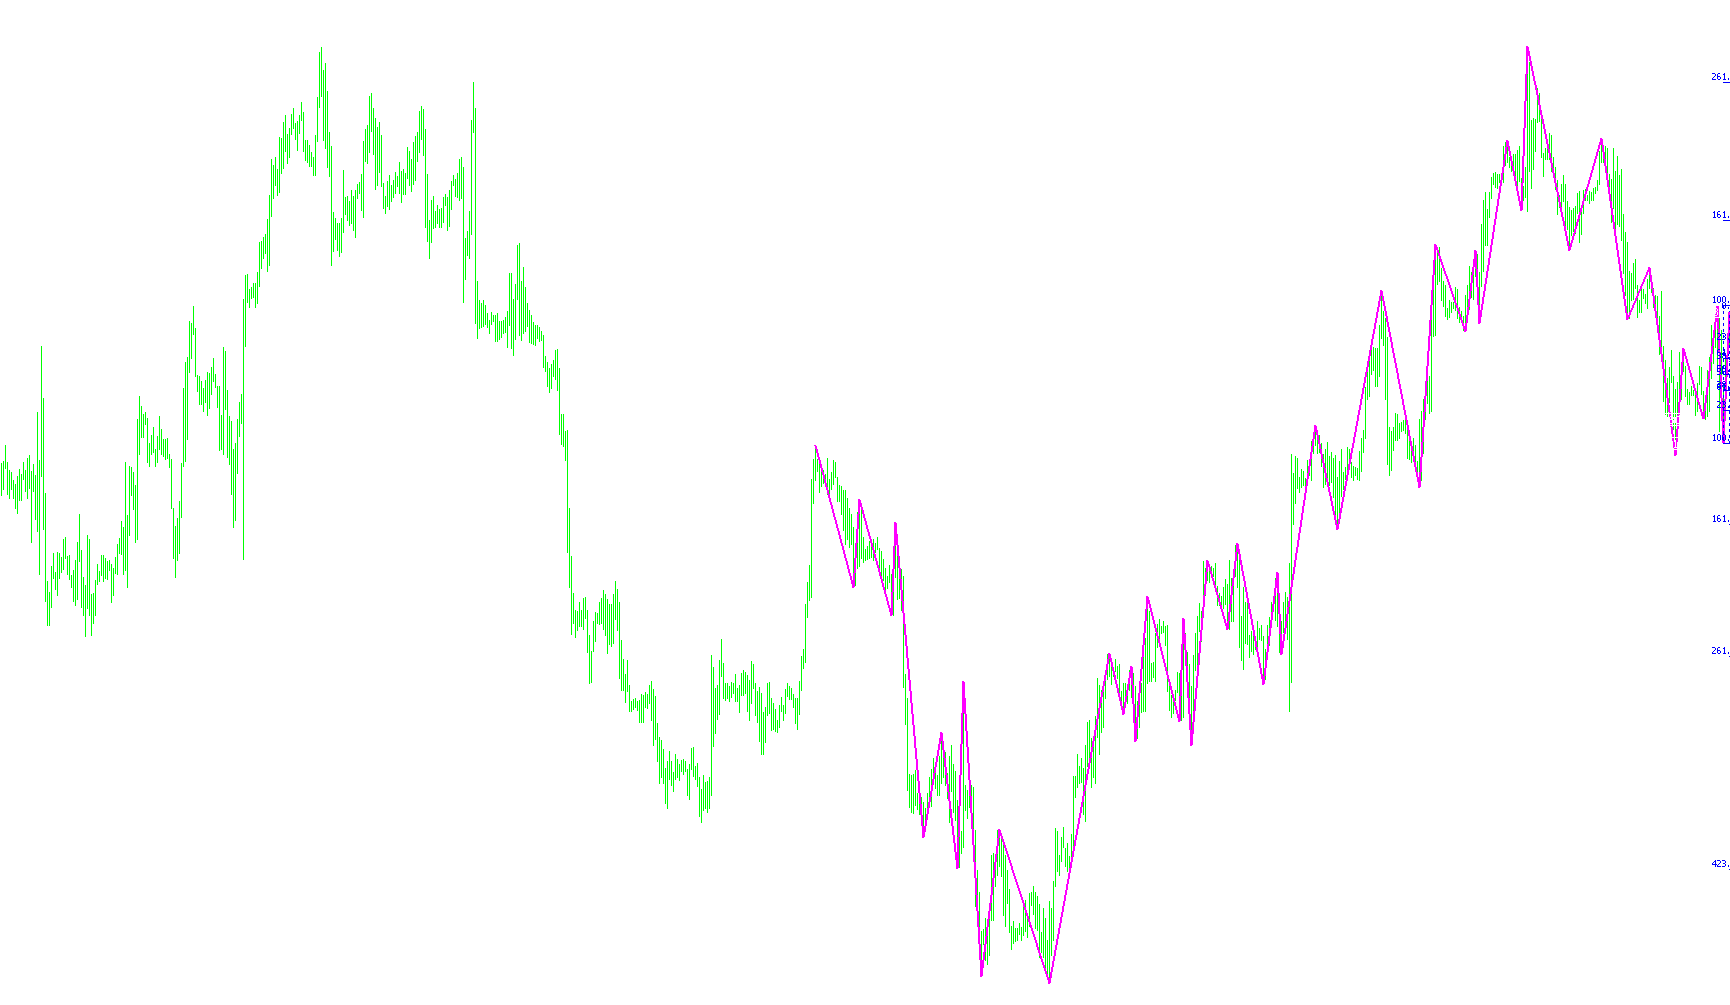
This indicator identifies trend reversals by detecting price extremes where the Parabolic SAR flips relative to the closing price, subsequently mapping Fibonacci retracement levels on historical waves.

paral
Indicator

paral

This script dynamically renders a sequence of historical trend lines based on price action coordinates from a specific lookback period to visualize structural momentum.

Paramon_Scalp
Indicator

Paramon_Scalp

This indicator identifies specific price boundaries by calculating the highest and lowest extremes within user-defined time windows to project active trading zones.

Paramon_Scalp_v1
Indicator

Paramon_Scalp_v1

This indicator identifies and plots historical high and low price boundaries during specific user-defined temporal windows to establish volatility corridors.

ParMA_BB
Indicator

ParMA_BB

This indicator utilizes second-order parabolic regression to derive a smoothed moving average and generates optional volatility bands based on the standard deviation of price deviations.

ParMA_BB_001
Indicator

ParMA_BB_001

This indicator calculates a parabolic moving average using second-order polynomial regression and optionally overlays standard deviation bands to visualize volatility boundaries.

paromon
Indicator

paromon

Dynamically identifies and plots the intraday price corridor by calculating the high, low, and median levels from specific daily historical extremes.

paromon2
Indicator

paromon2

Identifies the intraday price range by calculating the highest and lowest extremes between a specific starting hour and the current session.

Indicator

Parse_AlterTrader_v01

Indicator

Parse_AlterTrader_v02

Indicator

past regression deviated

Indicator

past regression deviated_v1

Indicator

past regression deviated_v2

Indicator

past_regression_deviated

Indicator

past_regression_deviated_v1

Pattern Alert
Indicator

Pattern Alert

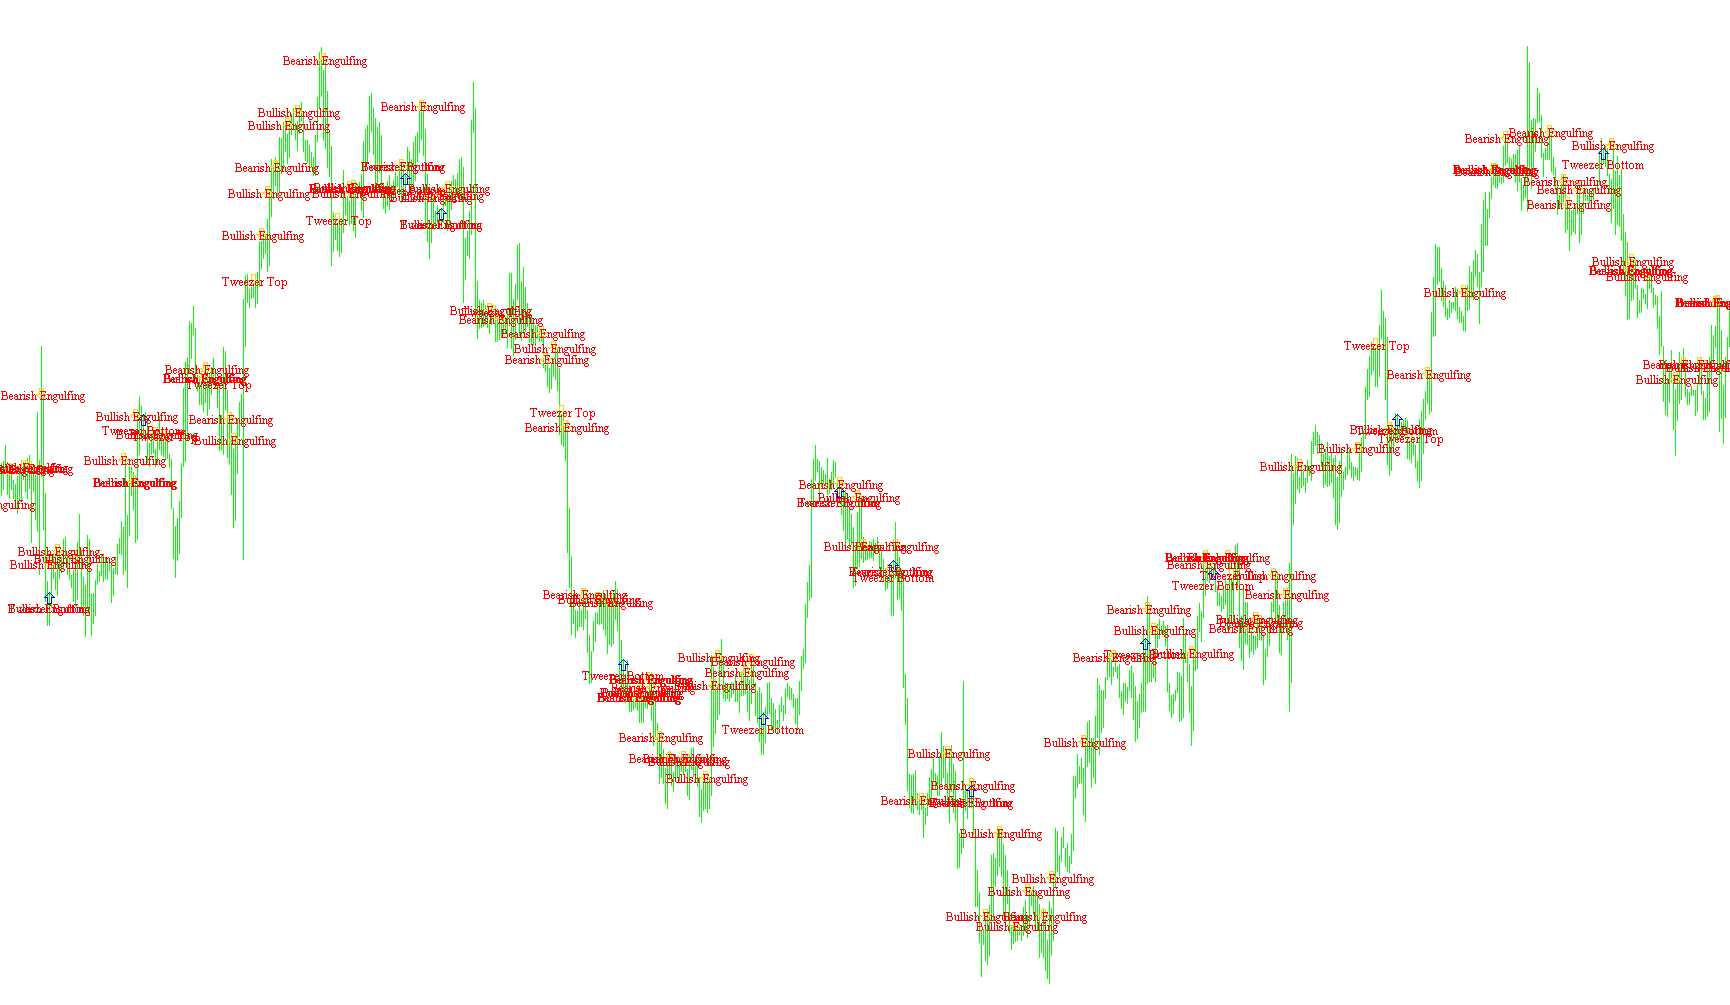
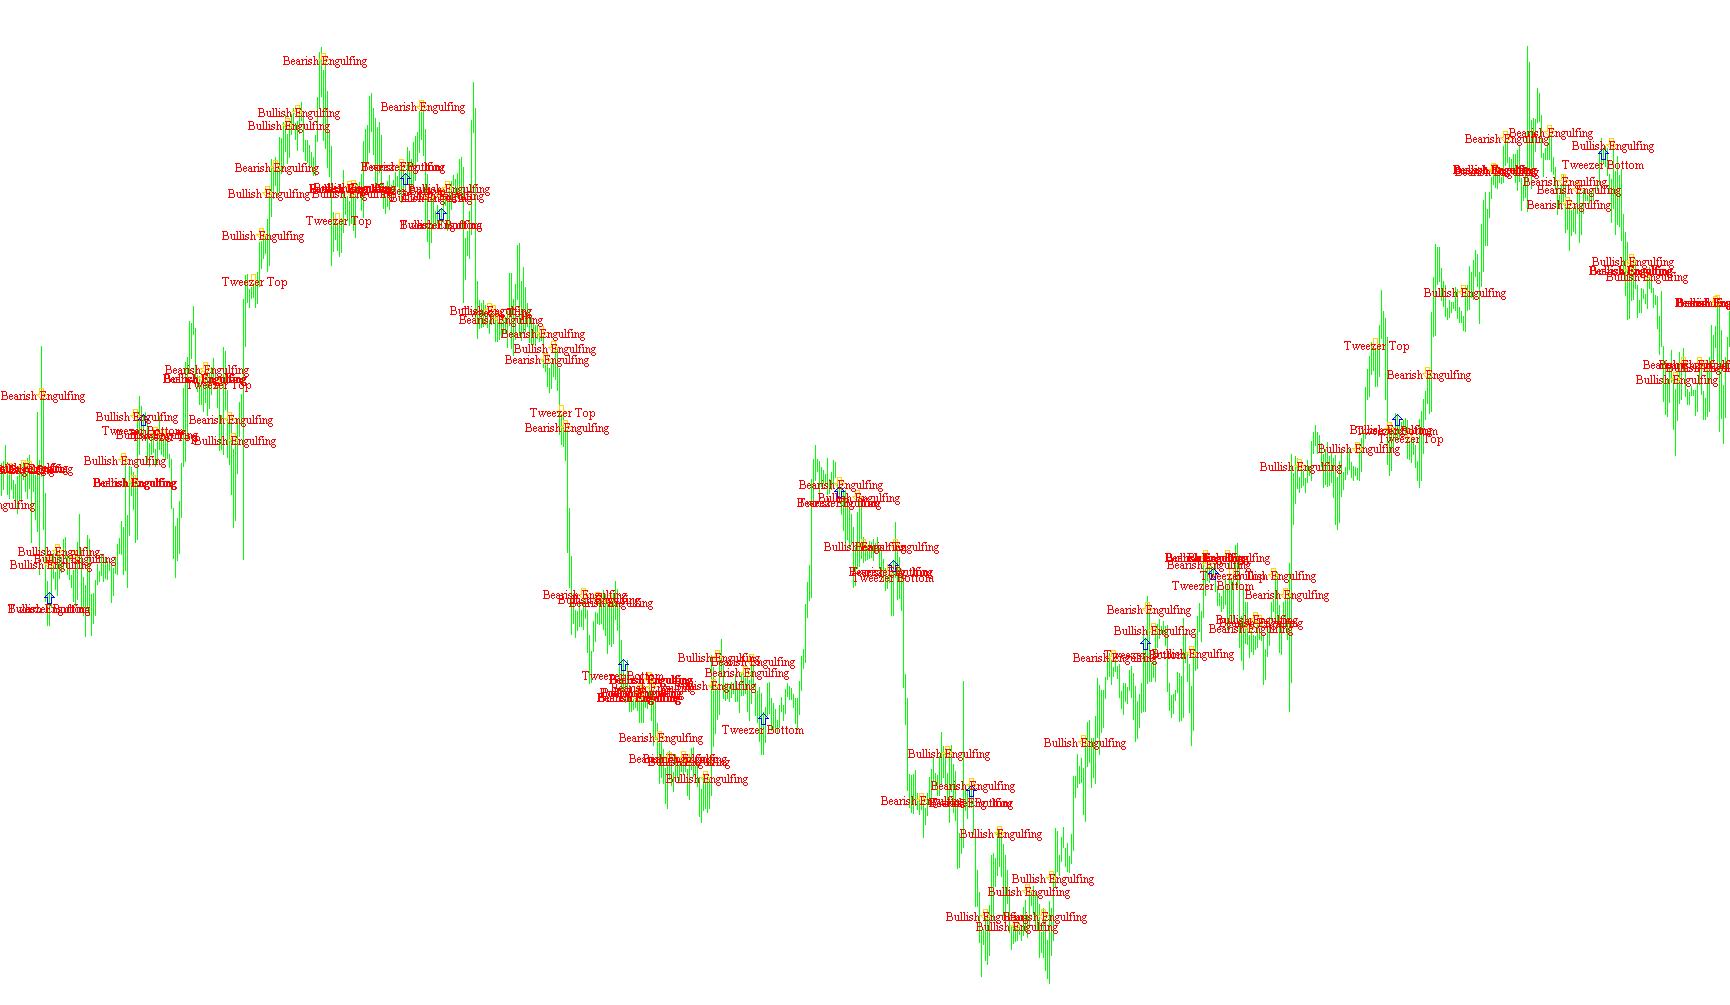
This indicator identifies and alerts on specific price action formations, including engulfing bars, doji stars, and tweezer extremes, to highlight potential trend reversals.

Pattern Alert_v1
Indicator

Pattern Alert_v1

This indicator automatically identifies and labels specific candlestick formations, including engulfing bars, doji stars, and tweezer reversals, providing real-time visual alerts on the chart.

Pattern Alert_v3
Indicator

Pattern Alert_v3

This technical indicator automatically identifies and visualizes specific candlestick formations, including engulfing patterns, doji stars, and tweezer extremes, while providing real-time alerts for trend reversals.
Pattern Recognition
Indicator

Pattern Recognition

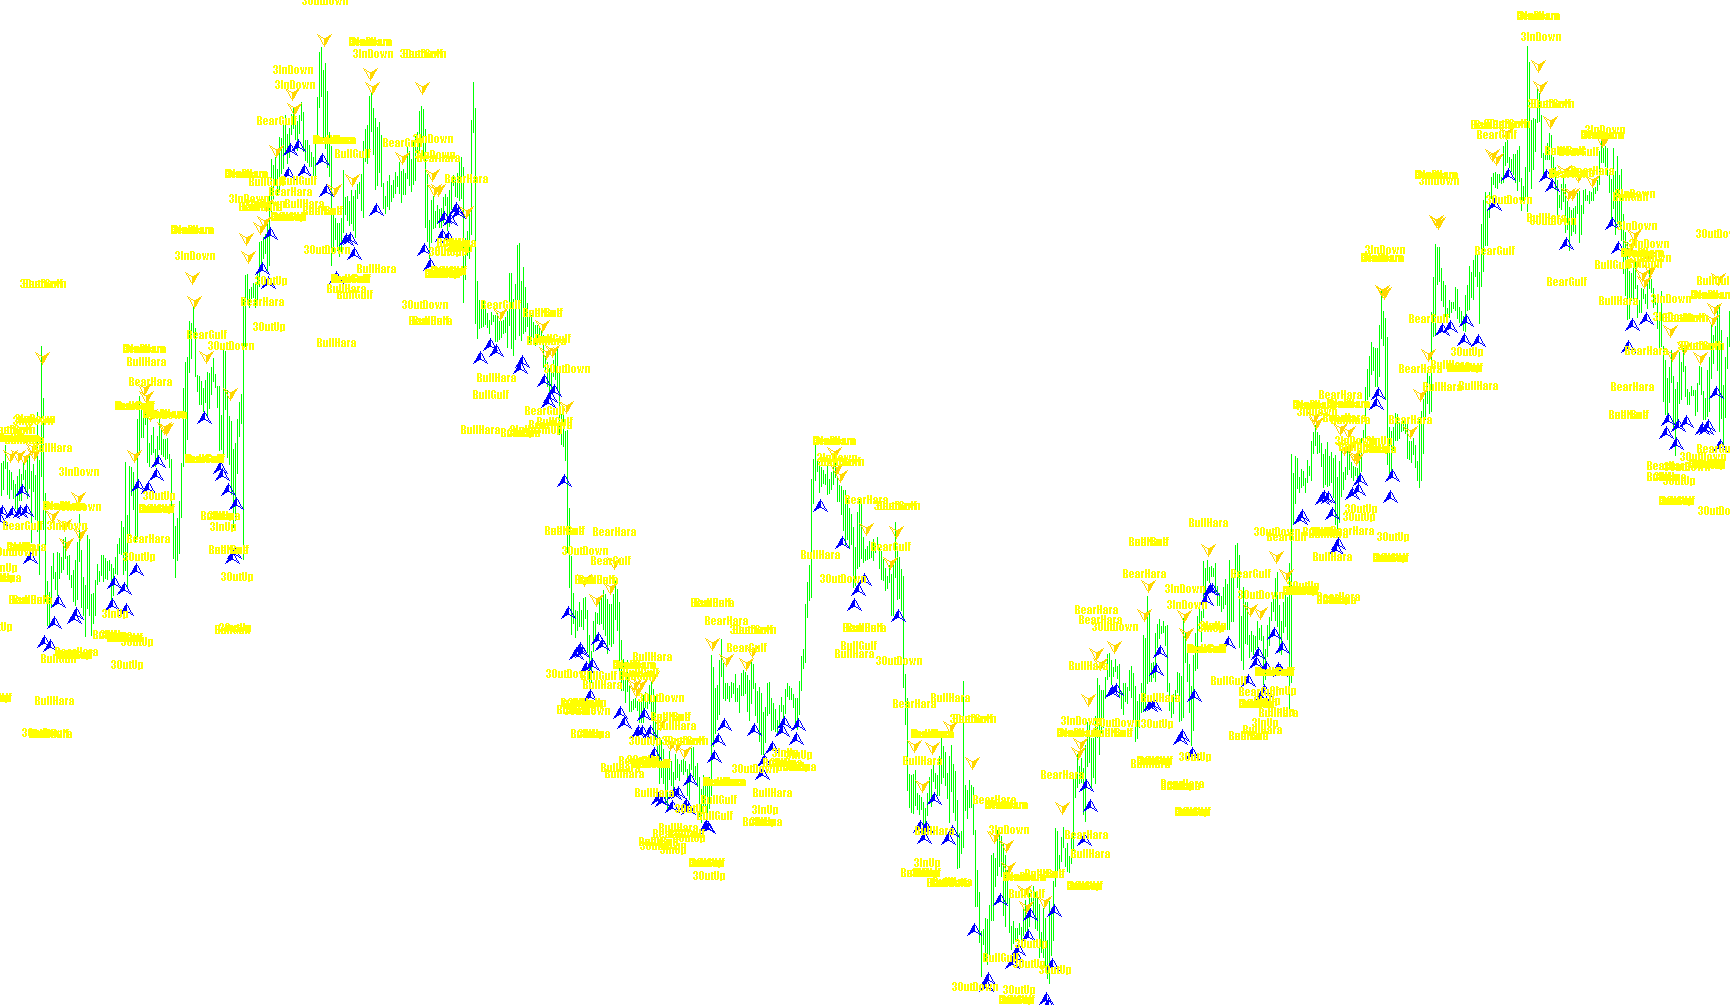
This indicator identifies multi-candle price action structures, including reversal and continuation archetypes, by analyzing historical open, close, high, and low price relationships.

Pattern Recognition_v1
Indicator

Pattern Recognition_v1

Identifies and alerts on multi-candle reversal configurations by analyzing historical price action for specific bearish and bullish formations.

Pattern Recognition_v2
Indicator

Pattern Recognition_v2

This indicator identifies and visualizes multi-bar price action formations by evaluating open, high, low, and close relationships to detect specific bearish and bullish reversal signals.

Pattern
Indicator

Pattern

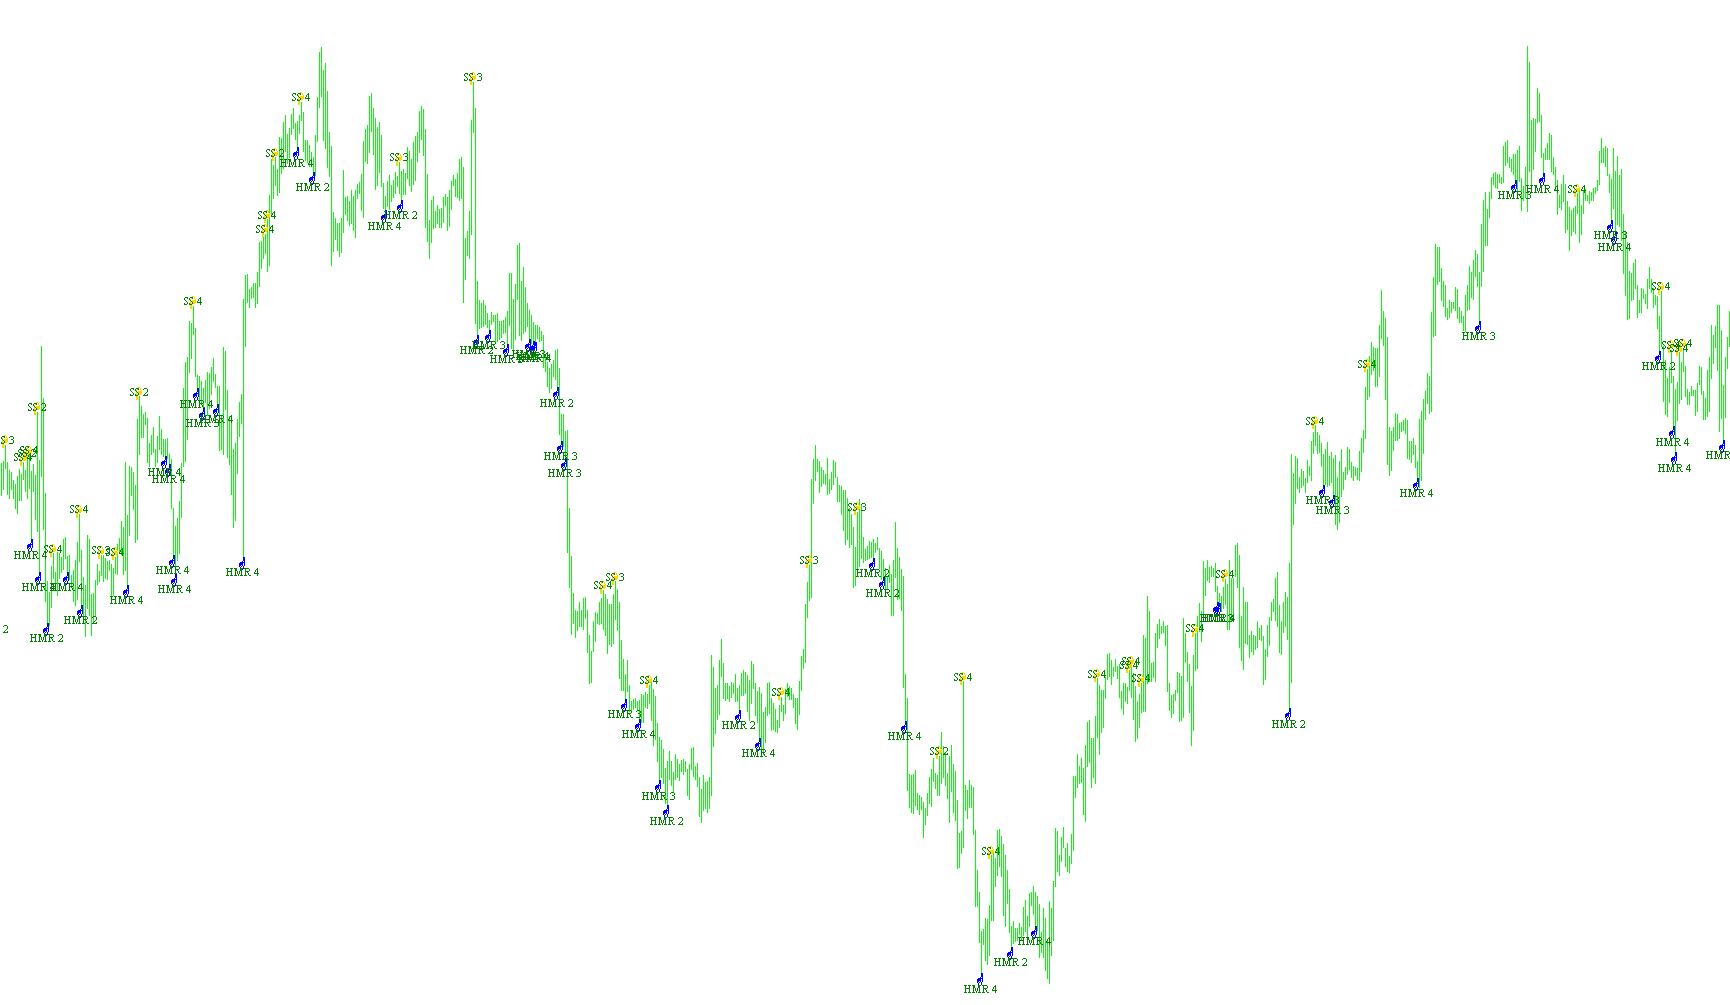
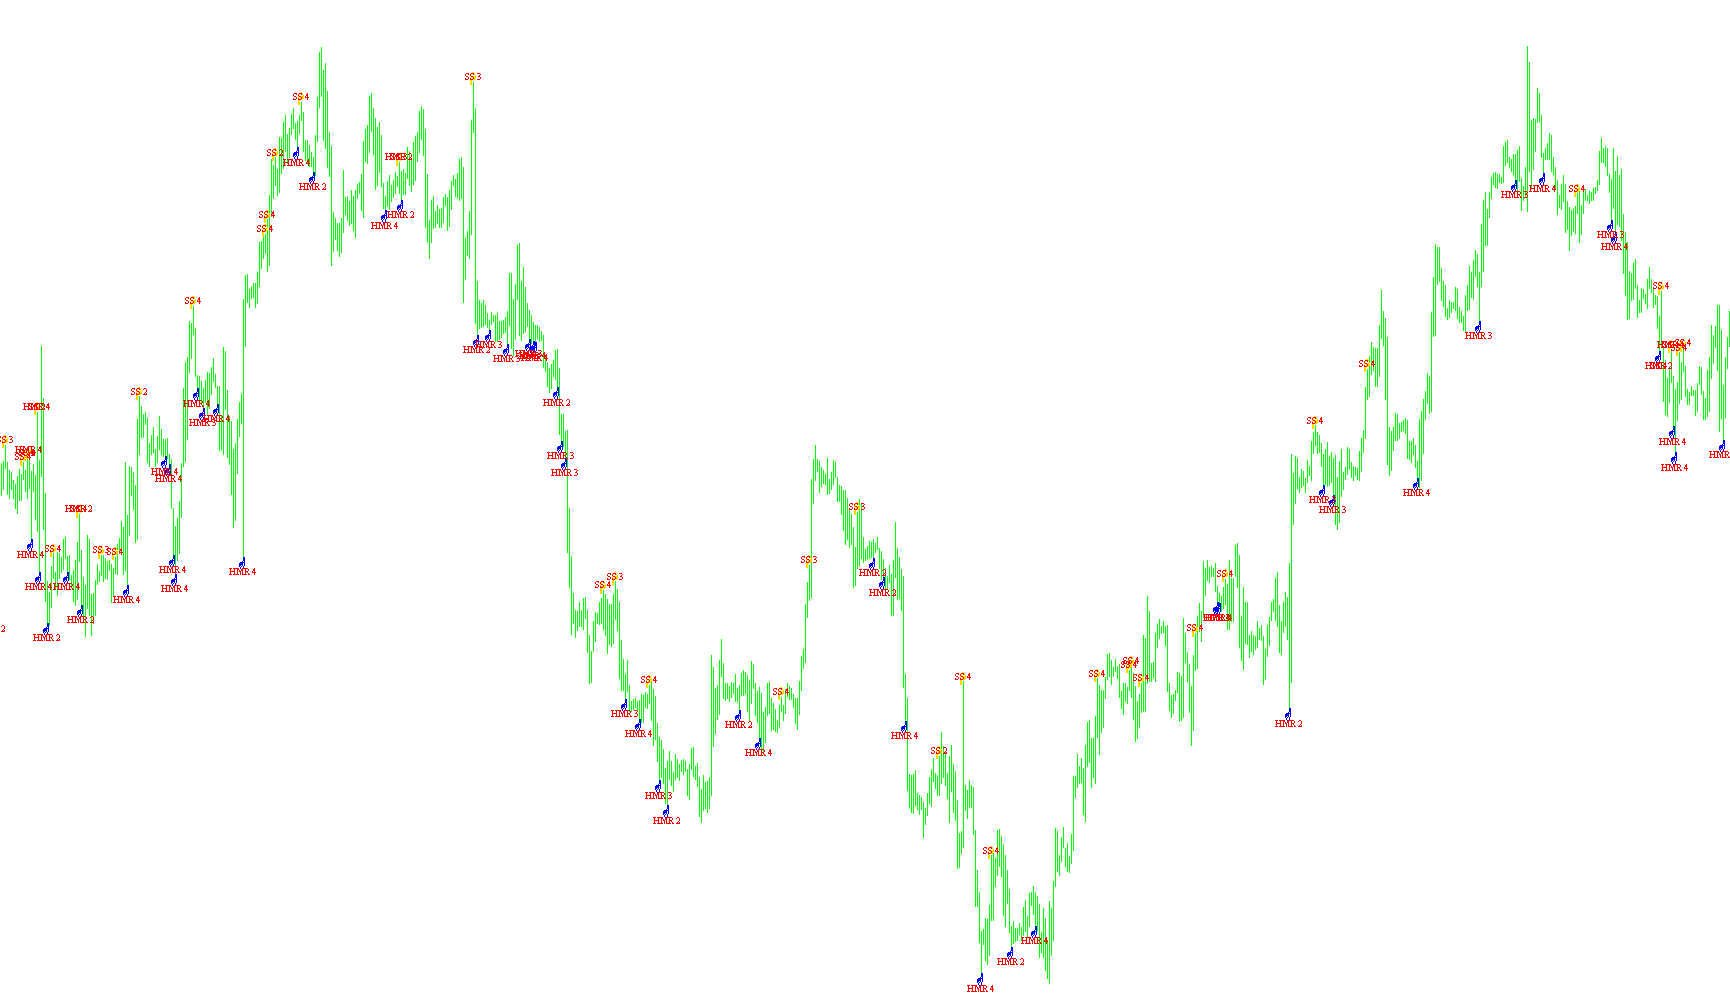
Identifies and labels specific price action formations such as Hammers, Engulfing candles, and Marubozu by calculating geometric relationships between open, high, low, and close prices.

Pattern_Hammer_Shooting Star
Indicator

Pattern_Hammer_Shooting Star

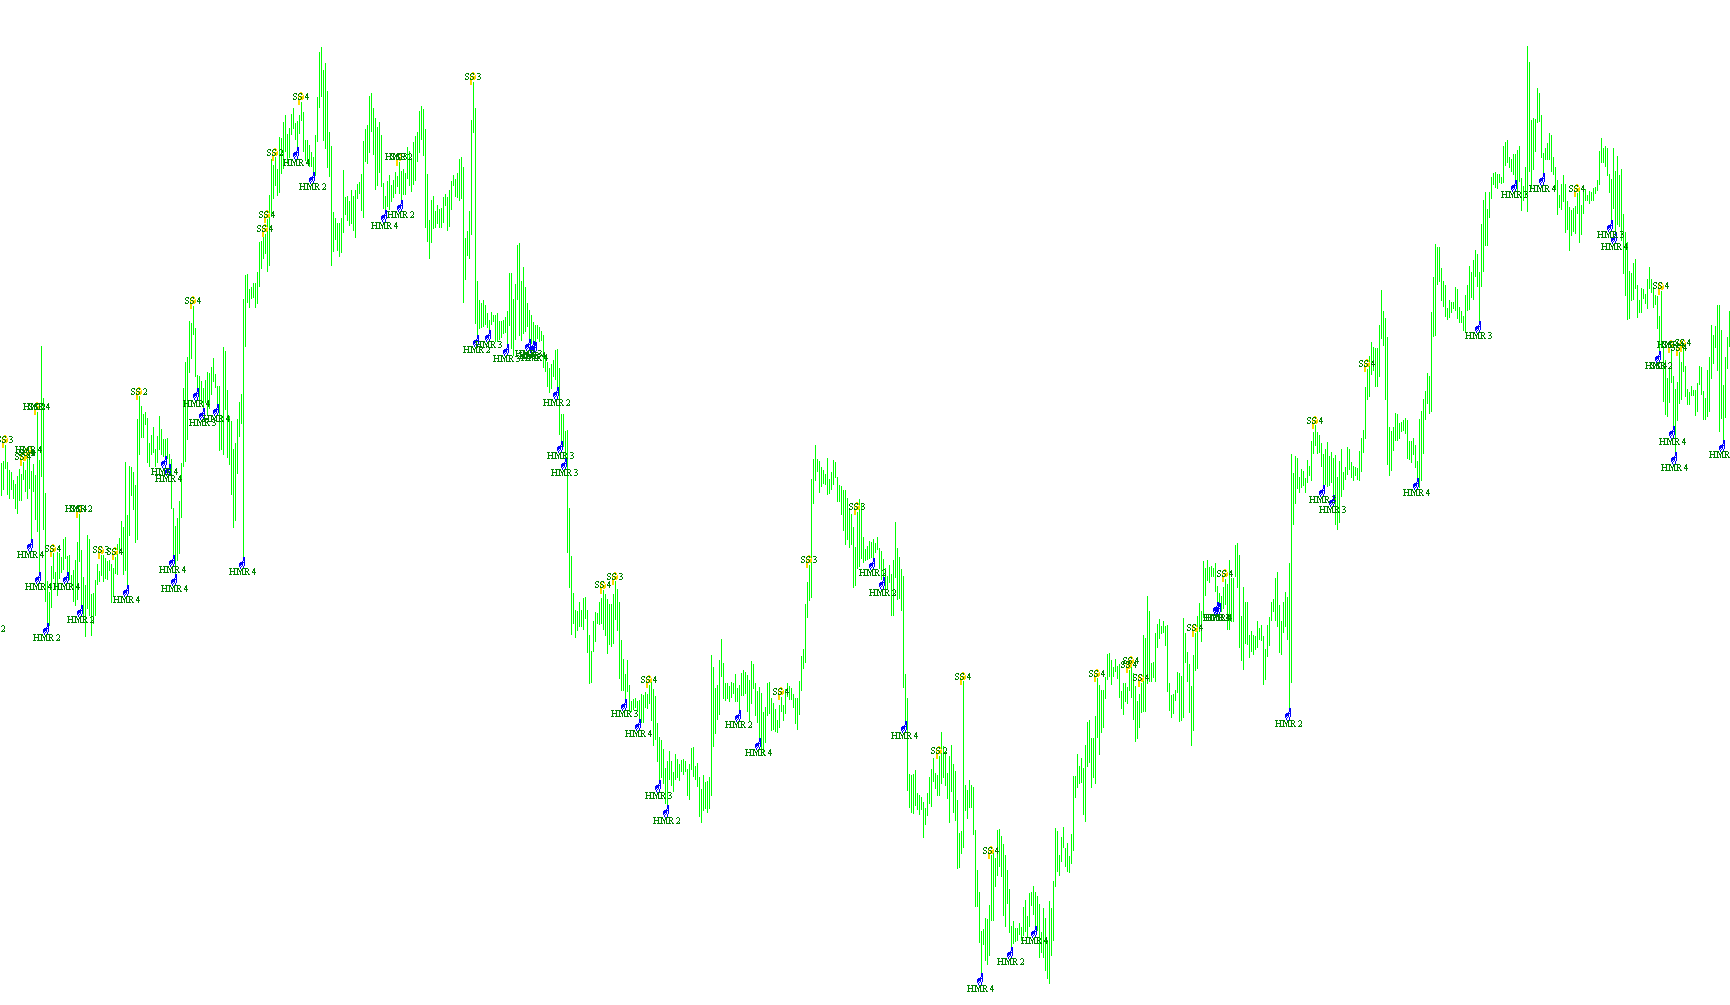
This indicator identifies specific bullish hammer and bearish shooting star price action formations by analyzing wick-to-body ratios and multi-candle high/low extremes.

Pattern_Hammer_Shooting Star1
Indicator

Pattern_Hammer_Shooting Star1

This indicator identifies specific price action reversals by calculating relative wick-to-body proportions and local extreme price peaks to detect Hammer and Shooting Star formations.

Pattern_Hammer_Shooting_Star
Indicator

Pattern_Hammer_Shooting_Star

Identifies specific price action reversals by calculating the geometric ratios between candle wicks, bodies, and historical local extrema.

Pattern_Recognition
Indicator

Pattern_Recognition

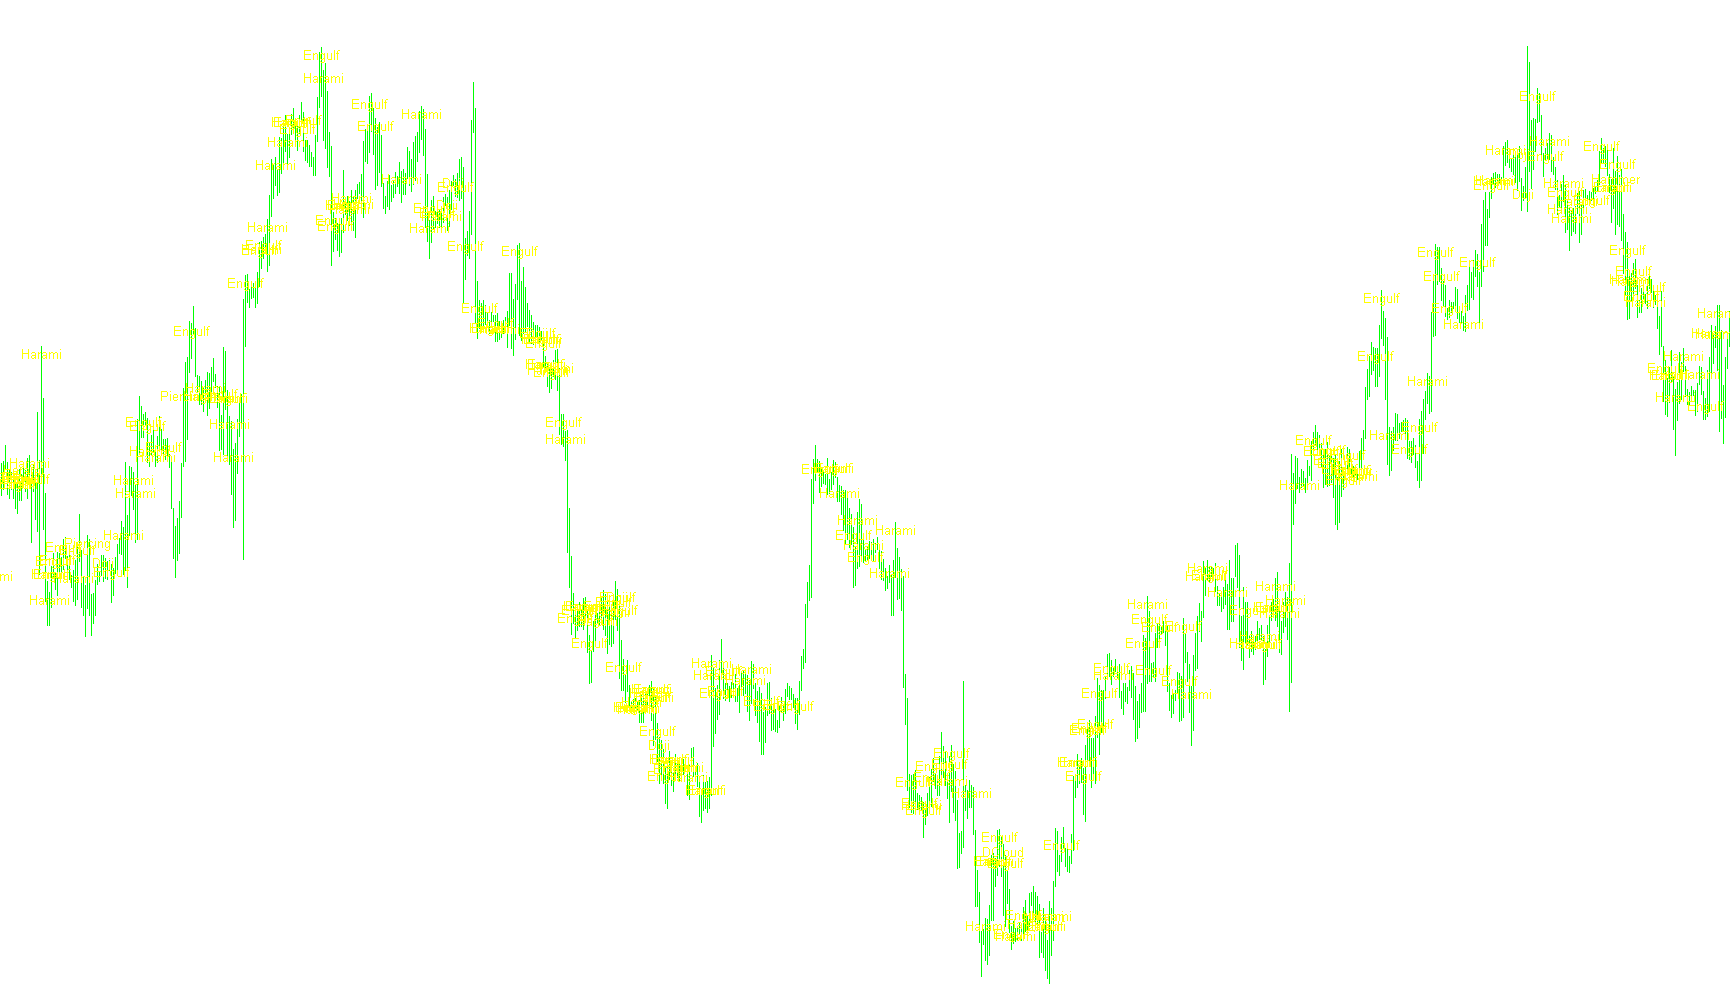
Identifies and alerts on multi-bar price action formations, including engulfing, harami, and three-candle reversal structures based on relative open, high, low, and close relationships.

Pattern_Recognition_f
Indicator

Pattern_Recognition_f

An automated technical scanner that detects and visualizes high-probability bullish and bearish candlestick formations through multi-bar geometric analysis.

Pattern_Recognition_Master
Indicator

Pattern_Recognition_Master

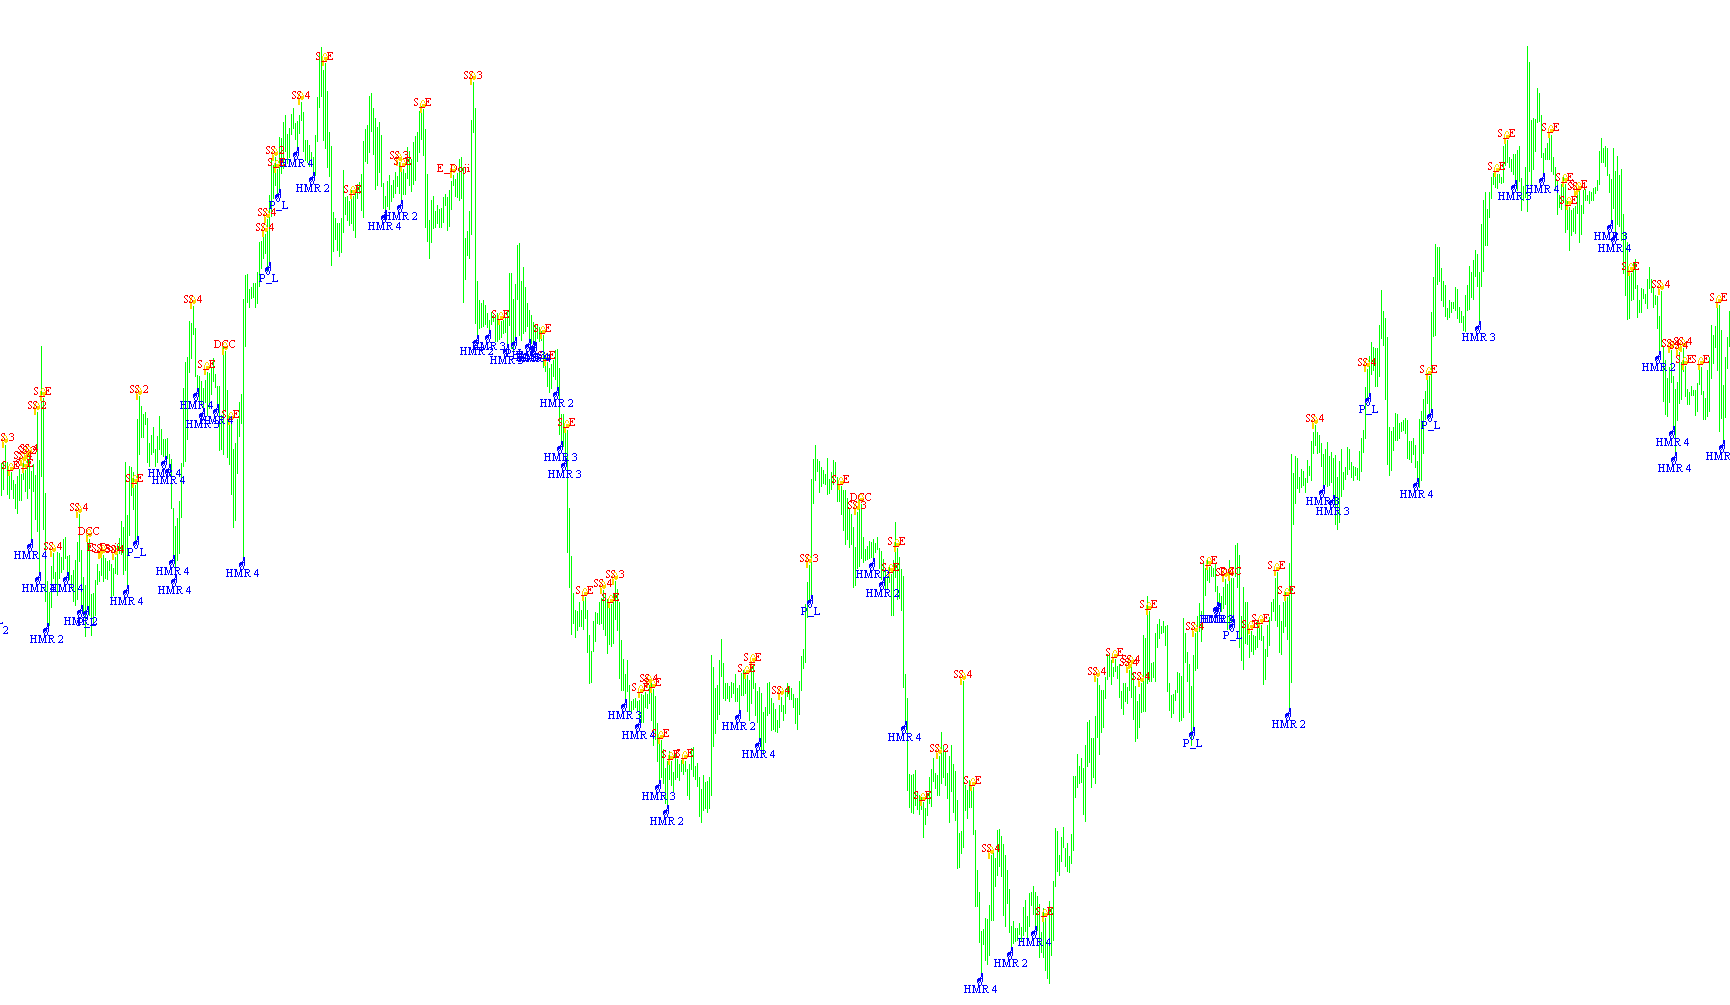
This indicator scans historical price action to identify and visually flag specific candlestick formations, including reversal stars, hammers, and engulfing structures, while providing real-time notifications for potential trend shifts.

Pattern_Recognition_Master1
Indicator

Pattern_Recognition_Master1

A geometric scanning engine that identifies high-probability candlestick formations and price action anomalies by evaluating wick-to-body ratios and multi-bar structural progression.

Pattern_Recognition_Master_v3
Indicator

Pattern_Recognition_Master_v3

This indicator identifies and visualizes complex price action reversals by detecting specific candlestick formations such as Hammers, Shooting Stars, Engulfing bars, and Morning/Evening Stars through multi-candle ratio analysis.

Pattern_Recognition_v1.0
Indicator

Pattern_Recognition_v1.0

This indicator systematically scans price action to detect and label specific multi-candle formations, such as engulfing, harami, and doji structures, while providing real-time alerts on trend reversals.

Pattern_v1
Indicator

Pattern_v1

This indicator scans historical price action to detect and label specific geometric candlestick patterns such as Hammers, Engulfing bars, Marubozu, and Dojis based on relative proportion calculations.

Pattern_v2
Indicator

Pattern_v2

This indicator identifies and labels specific price action patterns including hammers, englobing bars, dojis, and three white soldiers based on relative candle body-to-wick proportions and historical price sequence.

Indicator

PauseBeforeTrade

PAX
Indicator

PAX

iMAOnArray

This indicator calculates a smoothed momentum signal by processing the relative difference between current and prior price averages, supplemented by EMA smoothing and threshold-based trend identification.

PB_autopivots
Indicator

PB_autopivots

This indicator synchronizes daily high-low dynamics to project standard pivots, Camarilla range levels, and intermediate midpoint boundaries with automated Scott Jones trend tracking.

PCCI-as a filter
Indicator

PCCI-as a filter

This indicator extracts market noise by calculating the weighted deviation between current price action and a predefined digital coefficient sum.

PCCI-as a filter_001
Indicator

PCCI-as a filter_001

This indicator applies a high-order weighted sum algorithm to historical price data to isolate underlying trends by neutralizing high-frequency noise.

PCCI-as a filter_v1
Indicator

PCCI-as a filter_v1

This indicator isolates price noise by calculating a weighted sum of historical closing prices against a pre-defined coefficient array to derive a smoothed residual signal.

PCCI
Indicator

PCCI

This indicator calculates the spatial variance between the current candle's midpoint and a multi-period weighted linear regression price forecast.