Pivot-CalculatorM
Download script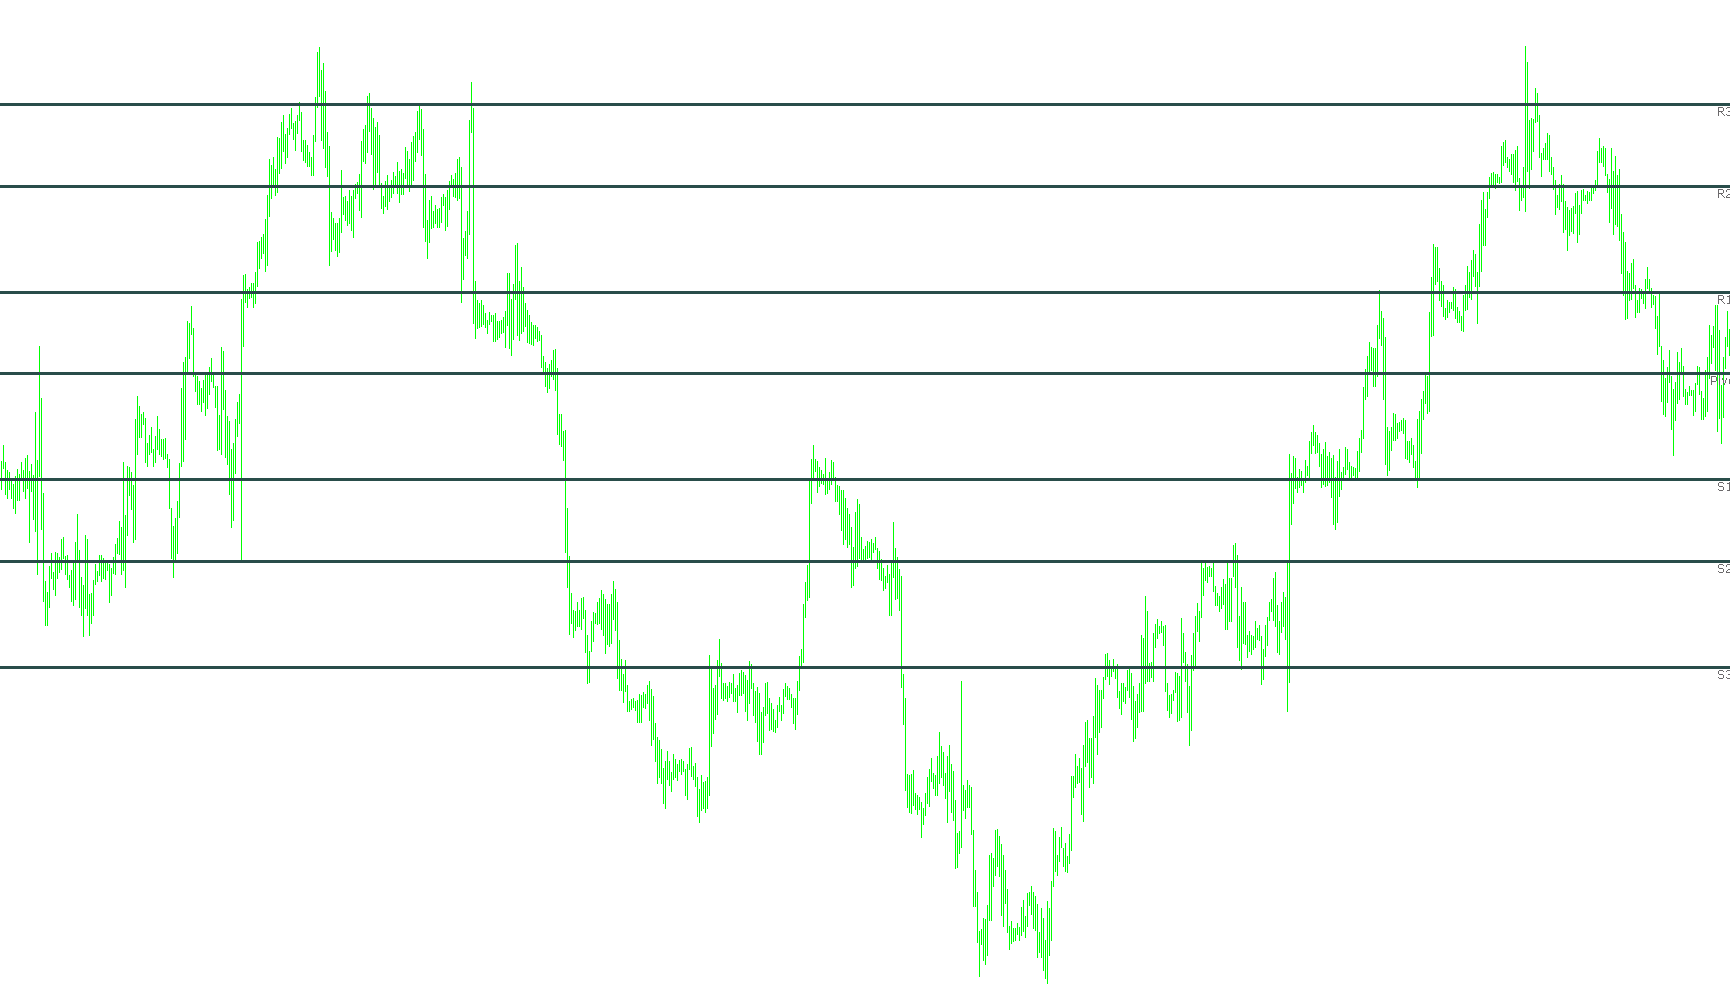
This script is a specialized financial tool designed for the MetaTrader platform to automatically calculate and display key price levels, known as "Pivots," on your trading charts. These levels are widely used by traders to identify potential areas of support (where prices may stop falling) and resistance (where prices may stop rising).
Core Functionality
The primary purpose of this tool is to analyze historical price data—specifically the high, low, and closing prices from previous trading sessions—to project significant price targets for the current day. By automating these calculations, it removes the need for manual math and allows you to visualize structural boundaries instantly on your screen.
How the Logic Works
The script follows a systematic process to determine where the market might face pressure:
- Data Retrieval: The tool scans recent historical data to identify the price action of the previous trading day. It includes intelligent logic to handle weekends; if a Monday session occurs, it knows to look back at the previous Friday's data to ensure the calculations remain consistent with the weekly market cycle.
- Pivot Calculation: Using standard financial formulas, the script calculates the "Main Pivot" point. This serves as the central equilibrium for the current trading day.
- Support and Resistance Projection: From that main pivot point, the script derives six additional levels:
- Resistance Levels (R1, R2, R3): These represent price ceilings. The higher the number, the further the price has moved away from the equilibrium, indicating stronger potential barriers.
- Support Levels (S1, S2, S3): These represent price floors. Similar to resistance, these indicate points where buyers are historically likely to step in and prevent further price drops.
- Visual Mapping: Once the math is complete, the script automatically draws horizontal lines across your chart for every level (Pivot, R1–R3, and S1–S3). It also places clear text labels next to each line so you can easily identify which level is which at a glance.
User Experience
The tool is designed to be "plug-and-play." Once active, it manages the drawing of these lines automatically. It handles the cleanup of old objects and ensures that the current levels stay updated as the price moves. This allows traders to focus on making decisions based on visual market structure rather than performing repetitive calculations.
//+------------------------------------------------------------------+
//|           Included is the PRICE based Pivot calculator           |
//|                (Daily Pivot,R1,R2,R3 & S1,S2,S3)                 |
//|                                                                  |
//|                                 Email: Xard777@connectfree.co.uk |
//+------------------------------------------------------------------+
//mod
#property copyright ""
#property link      ""
#property indicator_chart_window


extern int P = 5; //How many days back /0 = curr day/ 1 = yesterday/ 2= 2days ago

//---- input parameters ----
extern color   PLineColor  =  DarkSlateGray;
extern int     PLineWidth  =  3;
extern color  PLabelColor  =  DimGray;
extern int       fontsize  =  10;

double LastHigh, LastLow, x;

//+------------------------------------------------------------------+
//| Custor indicator deinitialization function                       |
//+------------------------------------------------------------------+
int deinit()
  {
//  ObjectsDeleteAll();
ObjectDelete("p_Line");ObjectDelete("P label");

ObjectDelete("r1_Line");ObjectDelete("r2_Line");ObjectDelete("r3_Line");
ObjectDelete("s1_Line");ObjectDelete("s2_Line");ObjectDelete("s3_Line");

ObjectDelete("R1 label");ObjectDelete("R2 label");ObjectDelete("R3 label");
ObjectDelete("S1 label");ObjectDelete("S2 label");ObjectDelete("S3 label");


//----
   return(0);
  }
//+------------------------------------------------------------------+
//| Custom indicator initialization function                         |
//+------------------------------------------------------------------+
int init()
  {


//---- Name for DataWindow and indicator subwindow label
   IndicatorShortName("XA");
   SetIndexDrawBegin(0,1);
   IndicatorDigits(MarketInfo(Symbol(),MODE_DIGITS));

   return(0);
  }

//+------------------------------------------------------------------+
//| Custom indicator iteration function                              |
//+------------------------------------------------------------------+
int start()
{

  //{
   int counted_bars = IndicatorCounted();
   int limit, i;

//---- Indicator Calculation ----
   if(counted_bars == 0)
     {
       x = Period();
       if(x > 240)
           return(-1);
     }
   if(counted_bars < 0)
       return(-1);
   //---- last counted bar will be recounted
   //   if(counted_bars>0) counted_bars--;
      limit = (Bars - counted_bars) - 1;
//----
   for(i = limit; i >= 0; i--)
     {
       if(High[i+1] > LastHigh)
           LastHigh = High[i+1];
       //----
       if(Low[i+1] < LastLow)
           LastLow=Low[i+1];
       if(TimeDay(Time[i]) != TimeDay(Time[i+1]))
         {

           LastLow = Open[i];
           LastHigh = Open[i];

         }

//---- Pivot Setup ----
double rates[1][6],yesterday_volume,yesterday_close,yesterday_high,yesterday_low,yesterday_open;
ArrayCopyRates(rates, Symbol(), PERIOD_D1);

if(DayOfWeek() == 1)
{
   if(TimeDayOfWeek(iTime(Symbol(),PERIOD_D1,1)) == 5)
   {
       yesterday_volume = rates[1][5];
       yesterday_close = rates[1][4];
       yesterday_high = rates[1][3];
       yesterday_low = rates[1][2];
       yesterday_open = rates[1][1];

   }
   else
   {
      for(int d = 5;d>=0;d--)
      {
         if(TimeDayOfWeek(iTime(Symbol(),PERIOD_D1,d)) == 5)
         {
             yesterday_volume = rates[d][5];
             yesterday_close = rates[d][4];
             yesterday_high = rates[d][3];
             yesterday_low = rates[d][2];
             yesterday_open = rates[d][1];
         }

      }

   }
}
else
{
    yesterday_close = rates[1][4];
    yesterday_high = rates[1][3];
    yesterday_low = rates[1][2];
    yesterday_open = rates[1][1];
}

//---- Calculate Pivots ----
double R = yesterday_high - yesterday_low;//range
double p = (yesterday_high + yesterday_low + yesterday_close)/3;// Standard Pivot
double r3 = (2*p)+(yesterday_high-(2*yesterday_low));// Resistance 3
double r2 = p+(yesterday_high - yesterday_low);// Resistance point 2
double r1 = (2*p)-yesterday_low;// Resistance point 1
double s1 = (2*p)-yesterday_high;// Support point 1
double s2 = p-(yesterday_high - yesterday_low);// Support point 2
double s3 = (2*p)-((2* yesterday_high)-yesterday_low);// Support point 3

//Pivot, Support & Resistance Lines
ObjectDelete("p_Line");
ObjectCreate("p_Line", OBJ_HLINE,0, CurTime(),p);
ObjectSet("p_Line",OBJPROP_COLOR,PLineColor);
ObjectSet("p_Line",OBJPROP_STYLE,STYLE_SOLID);
ObjectSet("p_Line",OBJPROP_WIDTH,PLineWidth);

ObjectDelete("r1_Line");
ObjectCreate("r1_Line", OBJ_HLINE,0, CurTime(),r1);
ObjectSet("r1_Line",OBJPROP_COLOR,PLineColor);
ObjectSet("r1_Line",OBJPROP_STYLE,STYLE_SOLID);
ObjectSet("r1_Line",OBJPROP_WIDTH,PLineWidth);

ObjectDelete("r2_Line");
ObjectCreate("r2_Line", OBJ_HLINE,0, CurTime(),r2);
ObjectSet("r2_Line",OBJPROP_COLOR,PLineColor);
ObjectSet("r2_Line",OBJPROP_STYLE,STYLE_SOLID);
ObjectSet("r2_Line",OBJPROP_WIDTH,PLineWidth);

ObjectDelete("r3_Line");
ObjectCreate("r3_Line", OBJ_HLINE,0, CurTime(),r3);
ObjectSet("r3_Line",OBJPROP_COLOR,PLineColor);
ObjectSet("r3_Line",OBJPROP_STYLE,STYLE_SOLID);
ObjectSet("r3_Line",OBJPROP_WIDTH,PLineWidth);

ObjectDelete("s1_Line");
ObjectCreate("s1_Line", OBJ_HLINE,0, CurTime(),s1);
ObjectSet("s1_Line",OBJPROP_COLOR,PLineColor);
ObjectSet("s1_Line",OBJPROP_STYLE,STYLE_SOLID);
ObjectSet("s1_Line",OBJPROP_WIDTH,PLineWidth);

ObjectDelete("s2_Line");
ObjectCreate("s2_Line", OBJ_HLINE,0, CurTime(),s2);
ObjectSet("s2_Line",OBJPROP_COLOR,PLineColor);
ObjectSet("s2_Line",OBJPROP_STYLE,STYLE_SOLID);
ObjectSet("s2_Line",OBJPROP_WIDTH,PLineWidth);

ObjectDelete("s3_Line");
ObjectCreate("s3_Line", OBJ_HLINE,0, CurTime(),s3);
ObjectSet("s3_Line",OBJPROP_COLOR,PLineColor);
ObjectSet("s3_Line",OBJPROP_STYLE,STYLE_SOLID);
ObjectSet("s3_Line",OBJPROP_WIDTH,PLineWidth);

ObjectsRedraw();

// ---- Typing Labels ----

//R3 Label
if(ObjectFind("R3 label") != 0)
{
ObjectCreate("R3 label", OBJ_TEXT, 0, Time[3], r3);
ObjectSetText("R3 label", " R3 ", 9, "Verdana", PLabelColor);
}
else
{
ObjectMove("R3 label", 0, Time[3], r3);
}

//S3 Label
if(ObjectFind("S3 label") != 0)
{
ObjectCreate("S3 label", OBJ_TEXT, 0, Time[3], s3);
ObjectSetText("S3 label", " S3 ", 9, "Verdana", PLabelColor);
}
else
{
ObjectMove("S3 label", 0, Time[3], s3);
}

//R2 Label
if(ObjectFind("R2 label") != 0)
{
ObjectCreate("R2 label", OBJ_TEXT, 0, Time[3], r2);
ObjectSetText("R2 label", " R2 ", 9, "Verdana", PLabelColor);
}
else
{
ObjectMove("R2 label", 0, Time[3], r2);
}

//S2 Label
if(ObjectFind("S2 label") != 0)
{
ObjectCreate("S2 label", OBJ_TEXT, 0, Time[3], s2);
ObjectSetText("S2 label", " S2 ", 9, "Verdana", PLabelColor);
}
else
{
ObjectMove("S2 label", 0, Time[3], s2);
}

//R1 Label
if(ObjectFind("R1 label") != 0)
{
ObjectCreate("R1 label", OBJ_TEXT, 0, Time[3], r1);
ObjectSetText("R1 label", " R1 ", 9, "Verdana", PLabelColor);
}
else
{
ObjectMove("R1 label", 0, Time[3], r1);
}

//S1 Label
if(ObjectFind("S1 label") != 0)
{
ObjectCreate("S1 label", OBJ_TEXT, 0, Time[3], s1);
ObjectSetText("S1 label", " S1 ", 9, "Verdana", PLabelColor);
}
else
{
ObjectMove("S1 label", 0, Time[3], s1);
}

//Pivot Label
if(ObjectFind("P label") != 0)
{
ObjectCreate("P label", OBJ_TEXT, 0, Time[3], p);
ObjectSetText("P label", " Pivot ", 9, "Verdana", PLabelColor);
}
else
{
ObjectMove("P label", 0, Time[3], p);
}

Comment("Pivot Calculator ");

}

   return(0);

  }
//Job Done
//+------------------------------------------------------------------+
Comments