PCCI_v1
Indicator

PCCI_v1

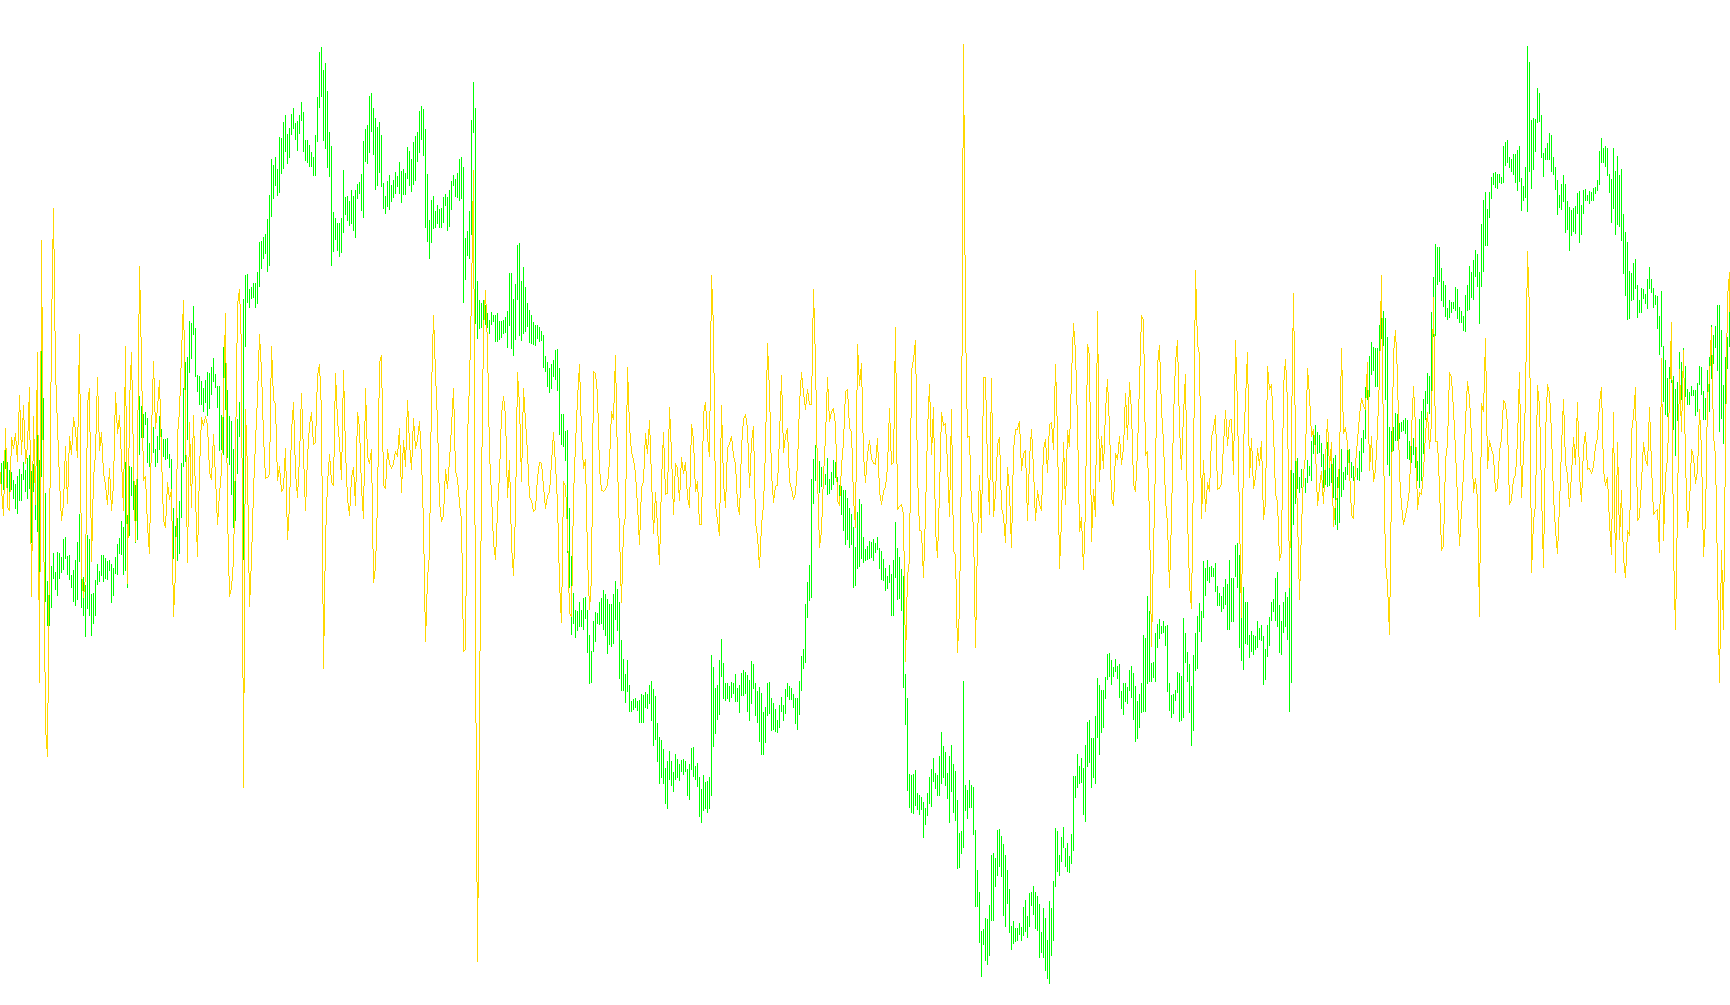
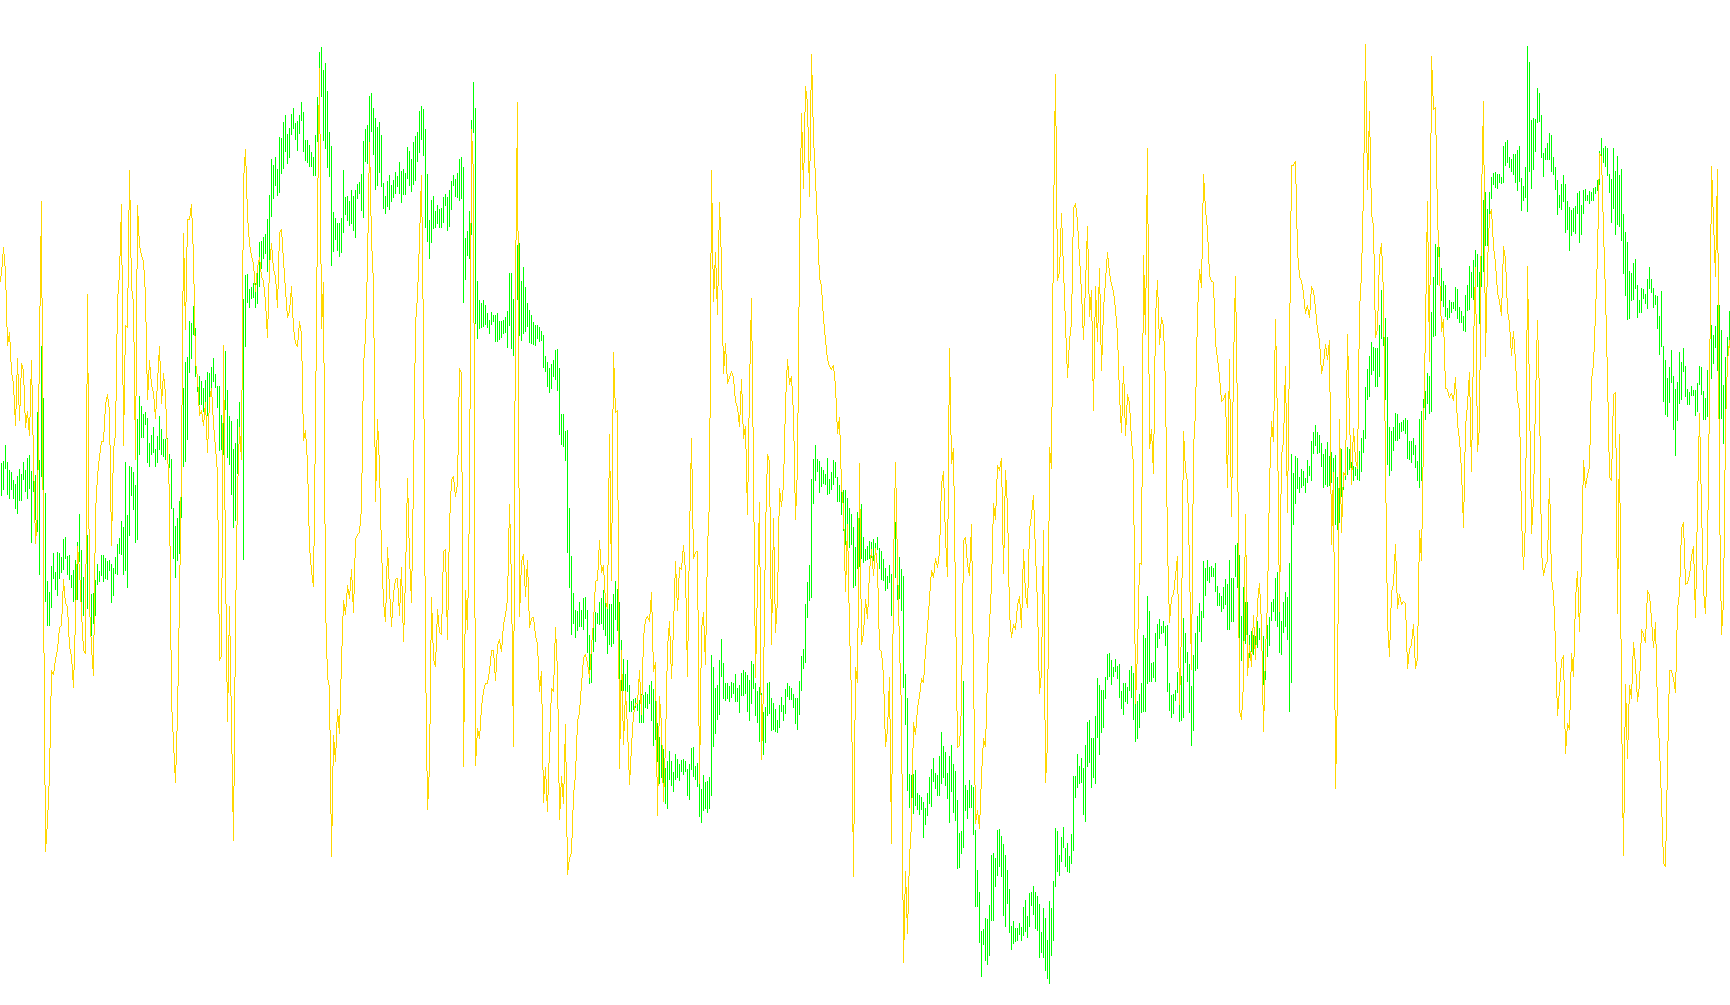
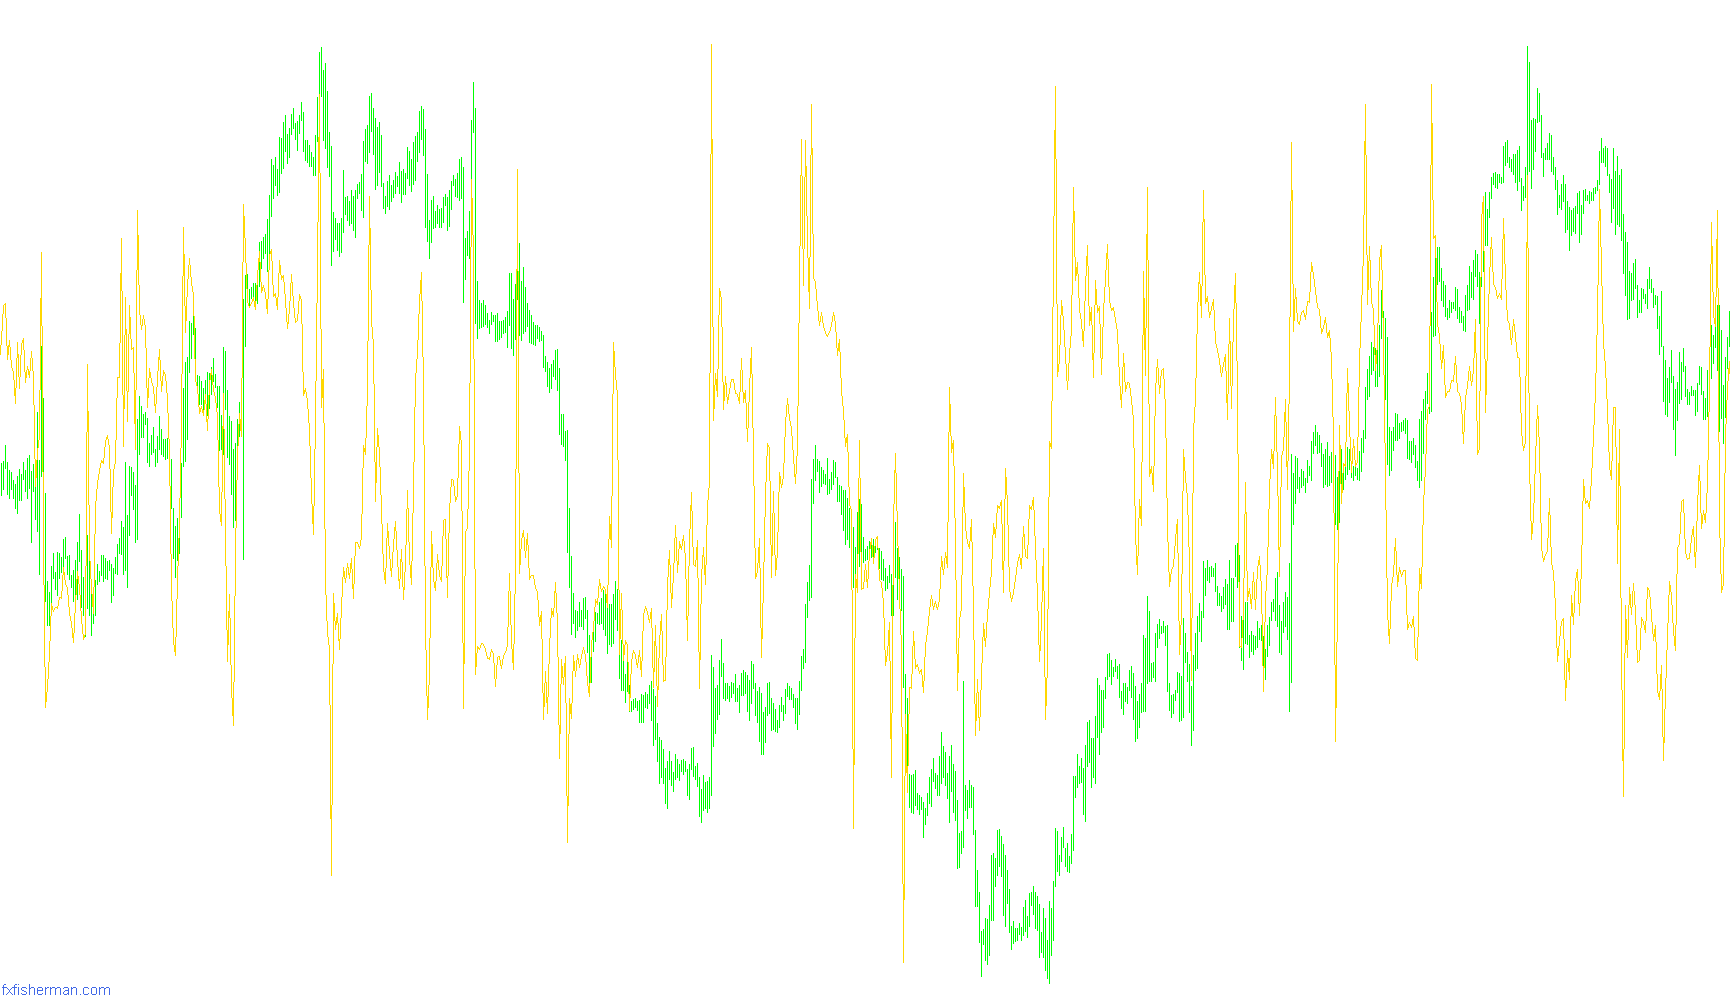
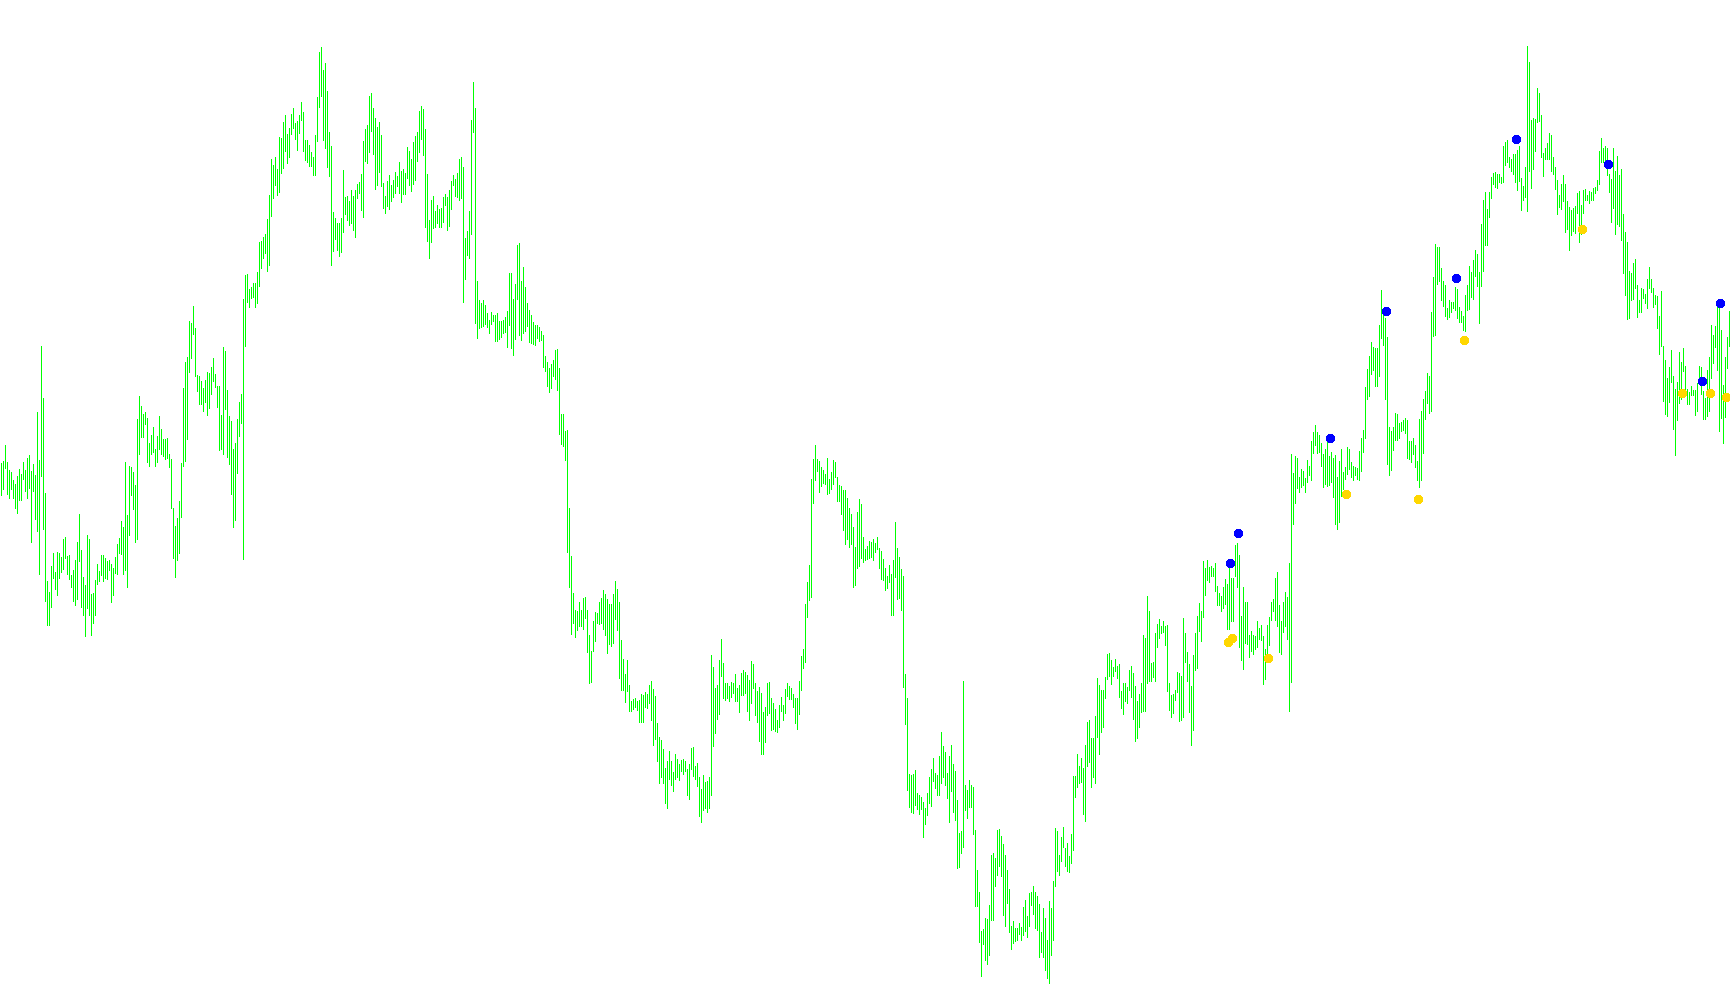
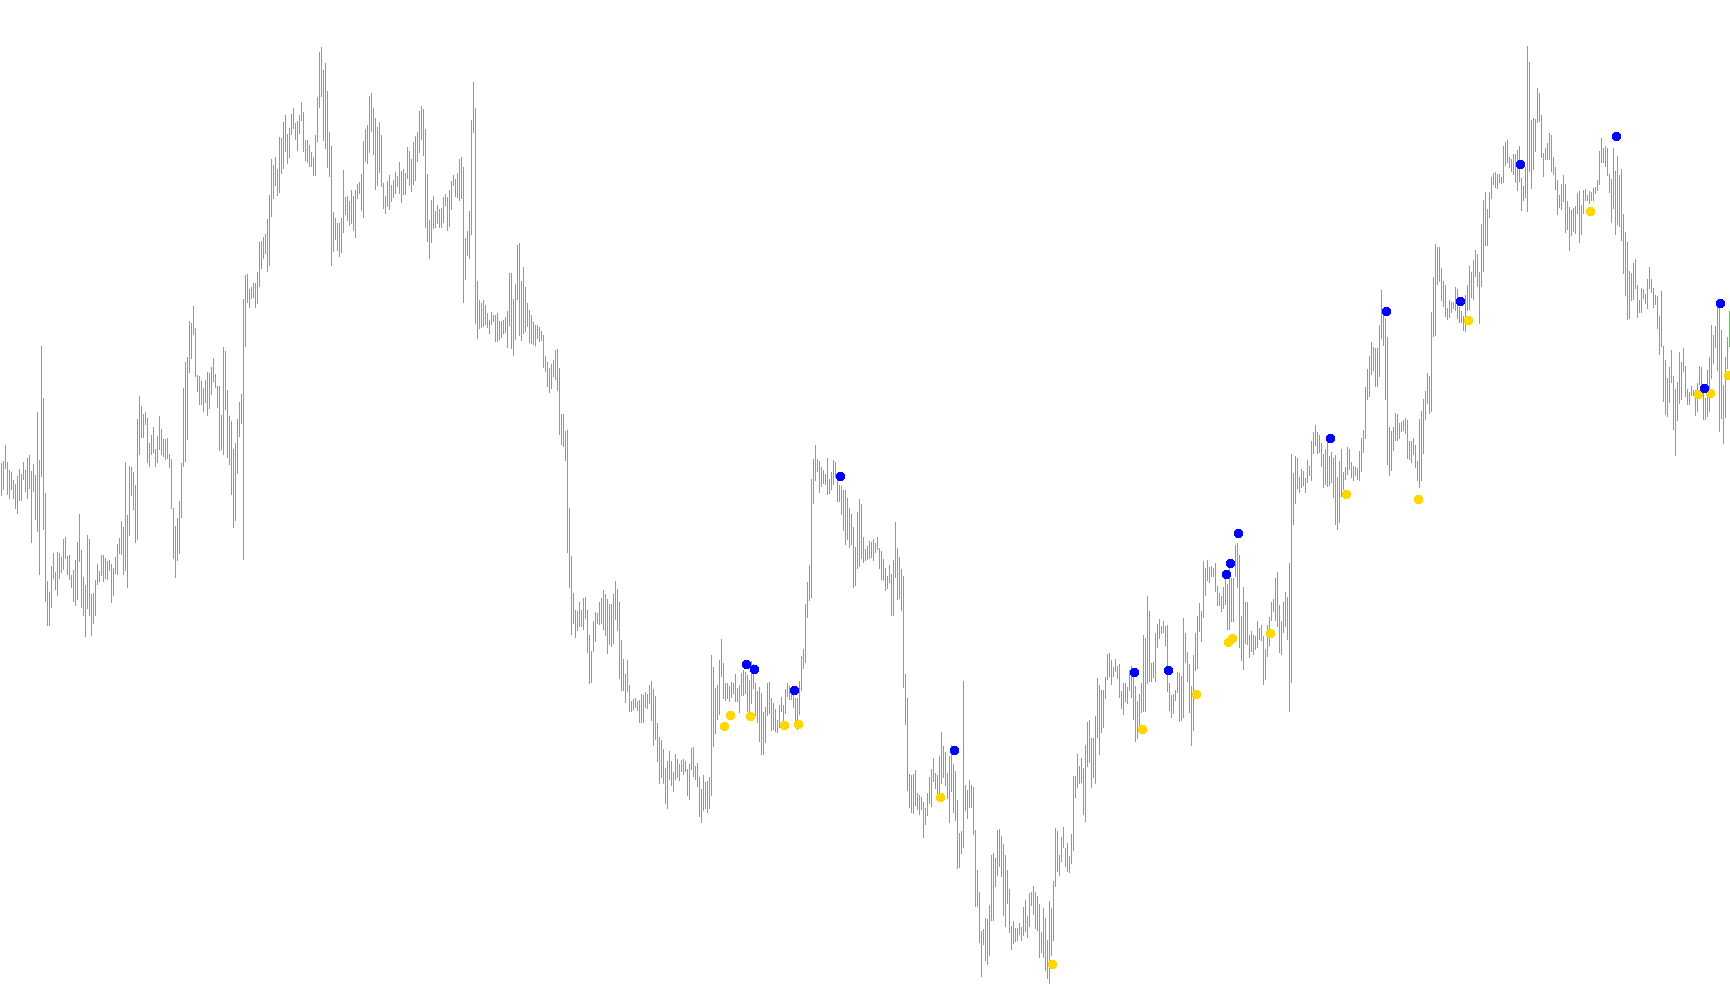
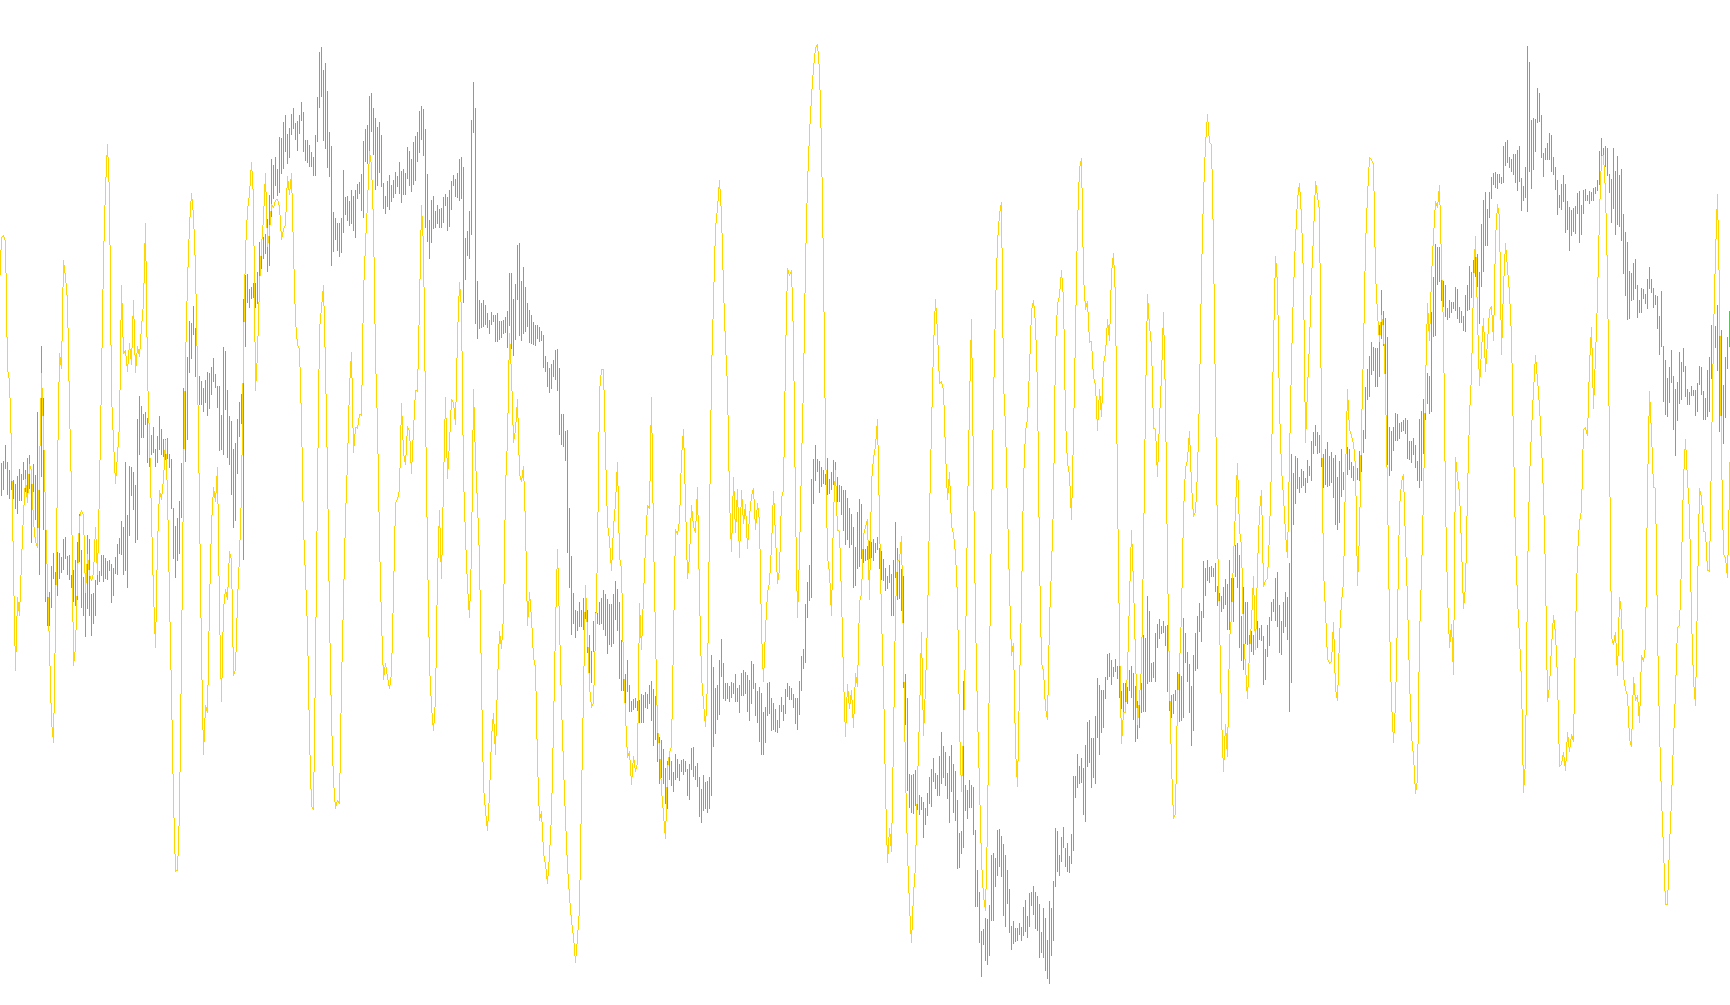
This indicator calculates the deviation between the midpoint of the current candle and a multi-period weighted moving average constructed from forty specific historical price points.

PCCI_v2
Indicator

PCCI_v2

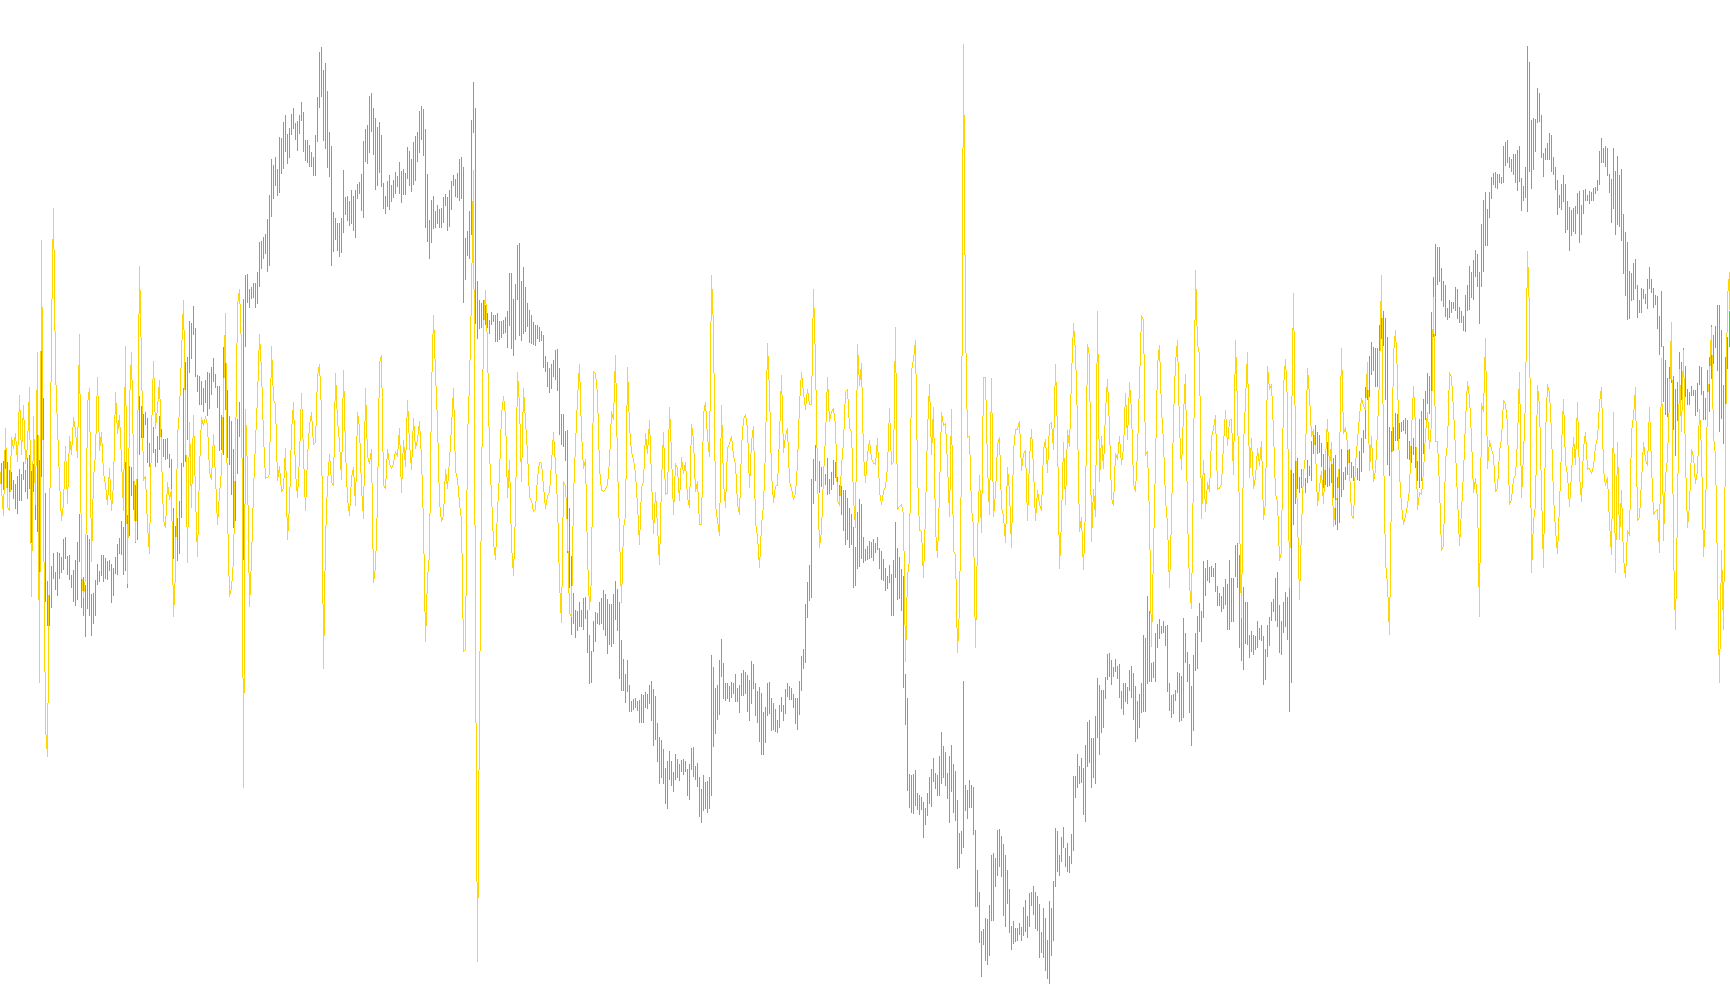
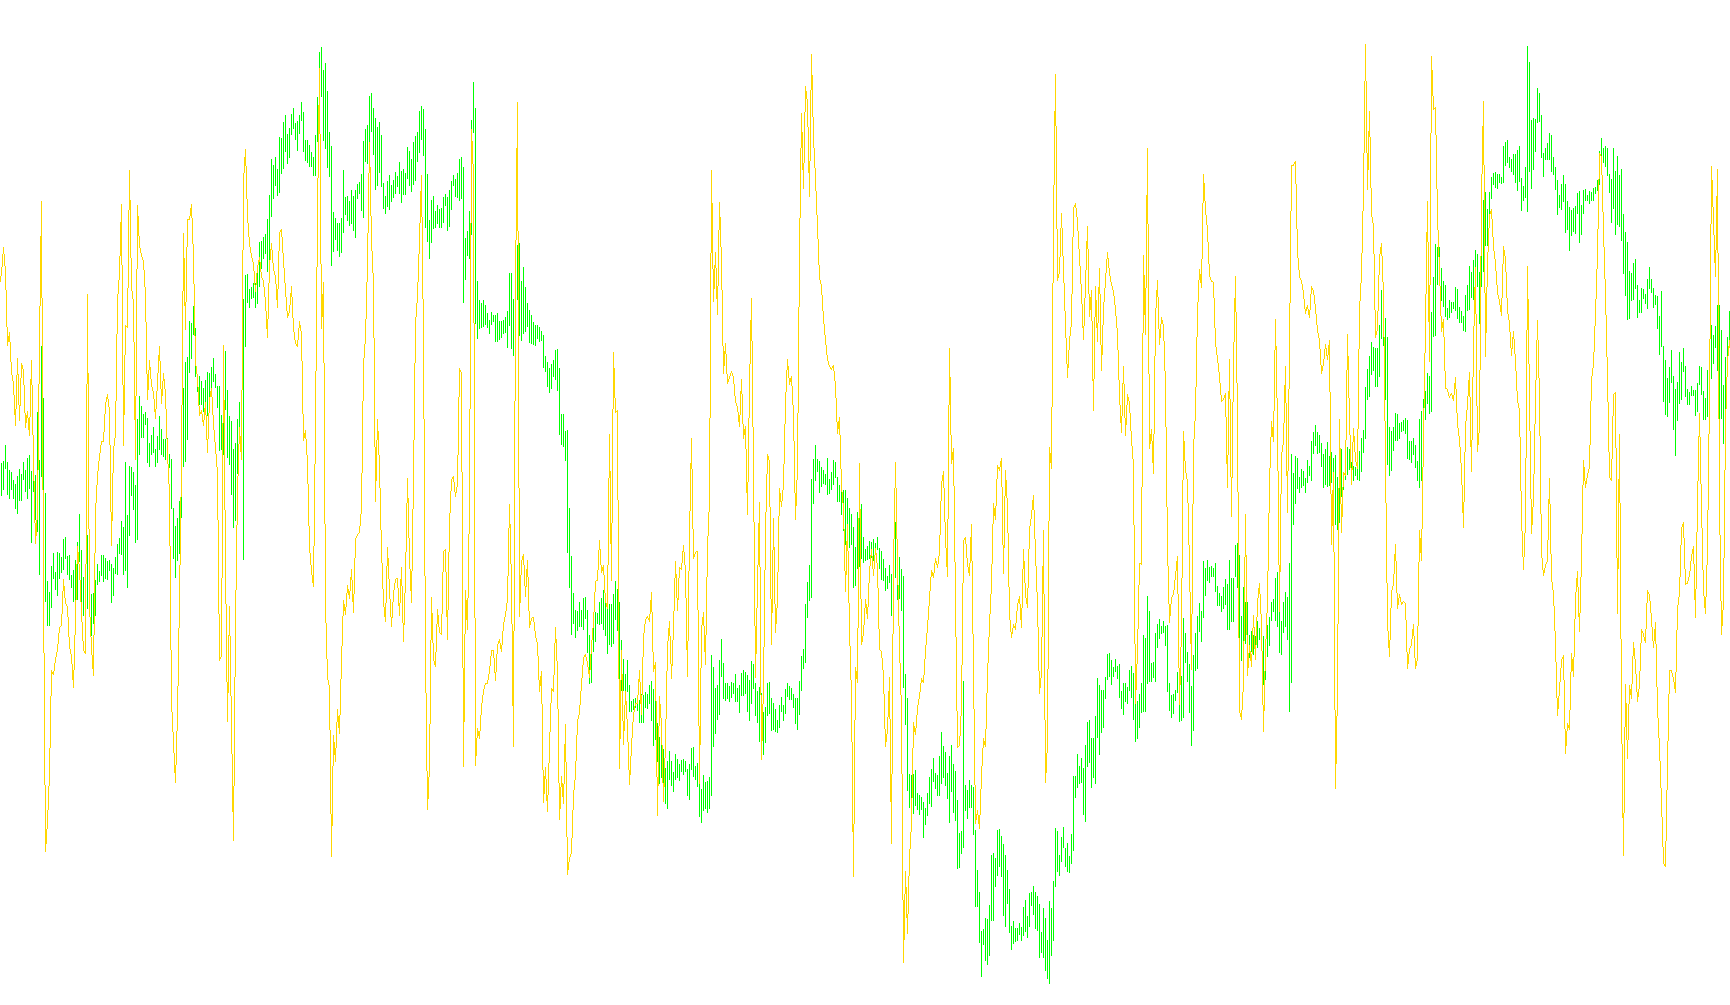
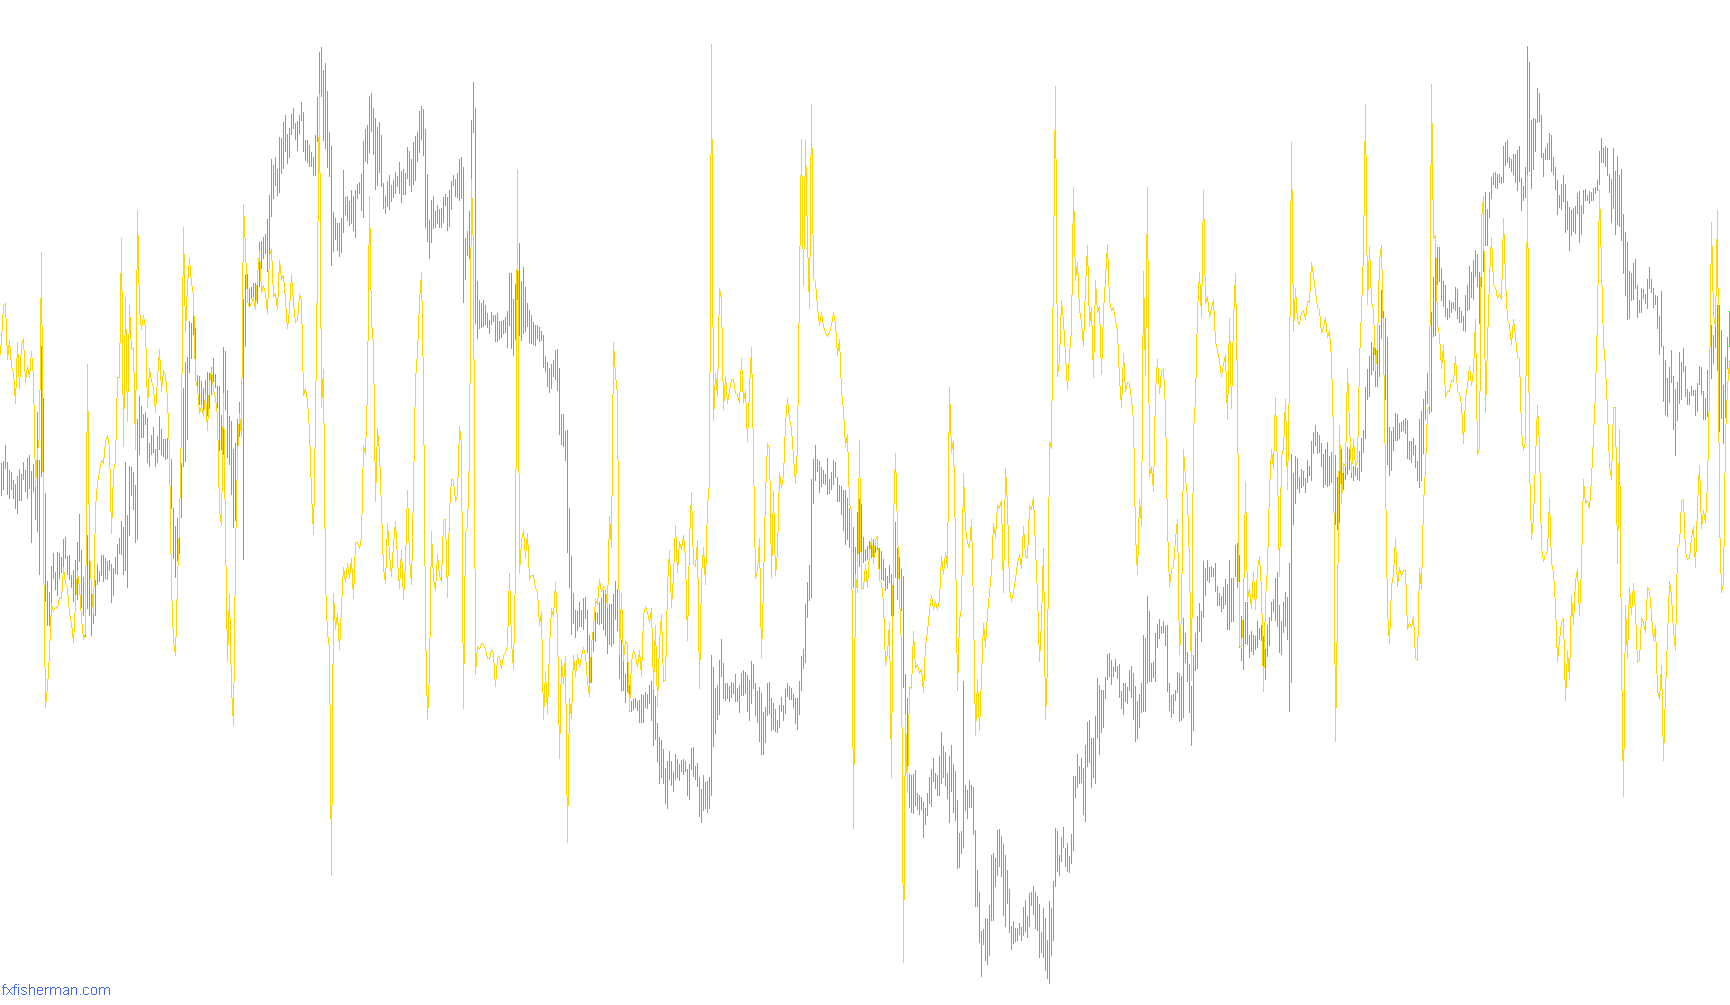
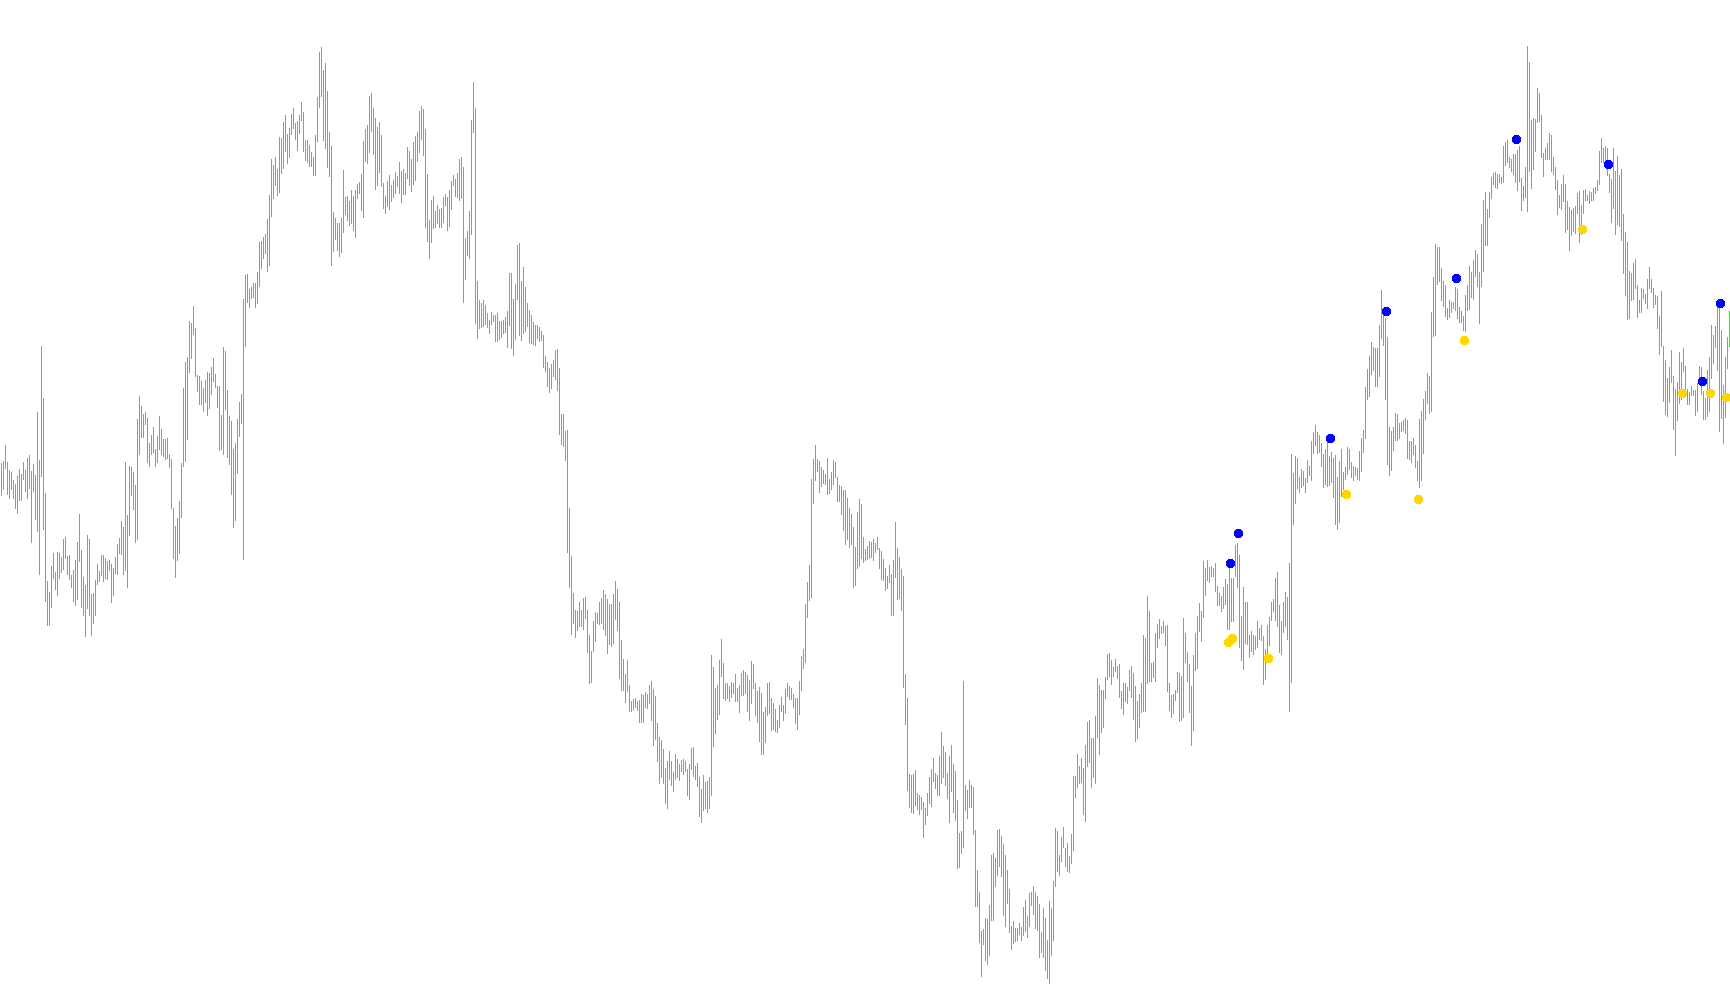
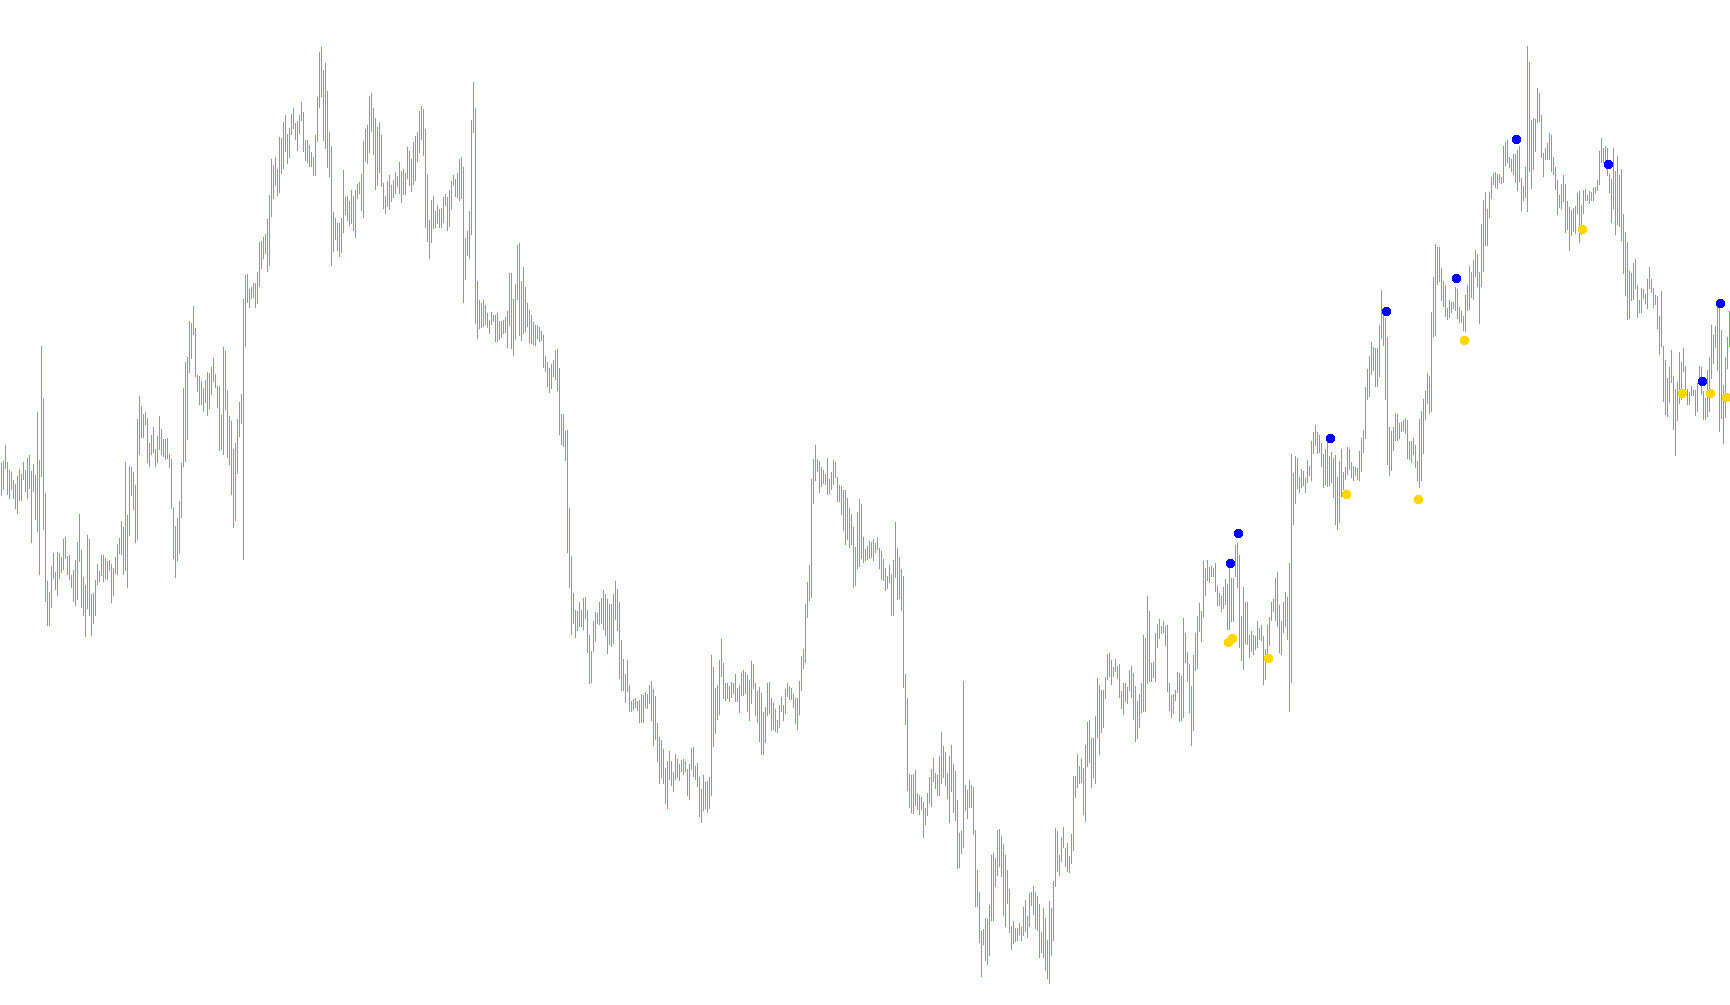
This indicator calculates the deviation between the current bar's midpoint and a weighted linear combination of the previous 40 closing prices.

PChannel
Indicator

PChannel

This indicator maps the extreme high and low price boundaries over a specific lookback period while calculating a centralized median equilibrium line.

PChannel_v1
Indicator

PChannel_v1

Identifies extreme price volatility by plotting the highest peaks and lowest troughs over a user-defined period to establish visual price corridors.

PChannel_WITH SHIFT
Indicator

PChannel_WITH SHIFT

This indicator projects upper and lower price extremes based on a fixed lookback period to identify volatility envelopes and their median equilibrium point.

PDF
Indicator

PDF

iStochastic

Quantifies the frequency of occurrence for specific stochastic oscillator values over a rolling lookback period to identify momentum clusters.

PDF_v1
Indicator

PDF_v1

iStochastic

This indicator quantifies the historical density of stochastic oscillations across a specific lookback period to visualize price momentum concentration.

PDF_v2
Indicator

PDF_v2

iStochastic

This indicator quantifies the historical density of stochastic oscillator values over a rolling period to visualize momentum concentration levels.

Indicator

PDI

iMA
Indicator

PDI_001

iMA
Pearson2
Indicator

Pearson2

iMAiStdDev

This indicator quantifies the linear relationship between two separate currency pairs by calculating the Pearson correlation coefficient based on moving average deviations and standard deviations.

Percent Bollinger Bands
Indicator

Percent Bollinger Bands

iBands

This indicator calculates the normalized percentage of the asset price within the volatility range defined by the upper and lower Bollinger Bands.

Percent Bollinger Bands_v1
Indicator

Percent Bollinger Bands_v1

iBands

This indicator quantifies the closing price's spatial location within the upper and lower Bollinger Bands as a normalized percentage.

Percent Change MICEX
Indicator

Percent Change MICEX

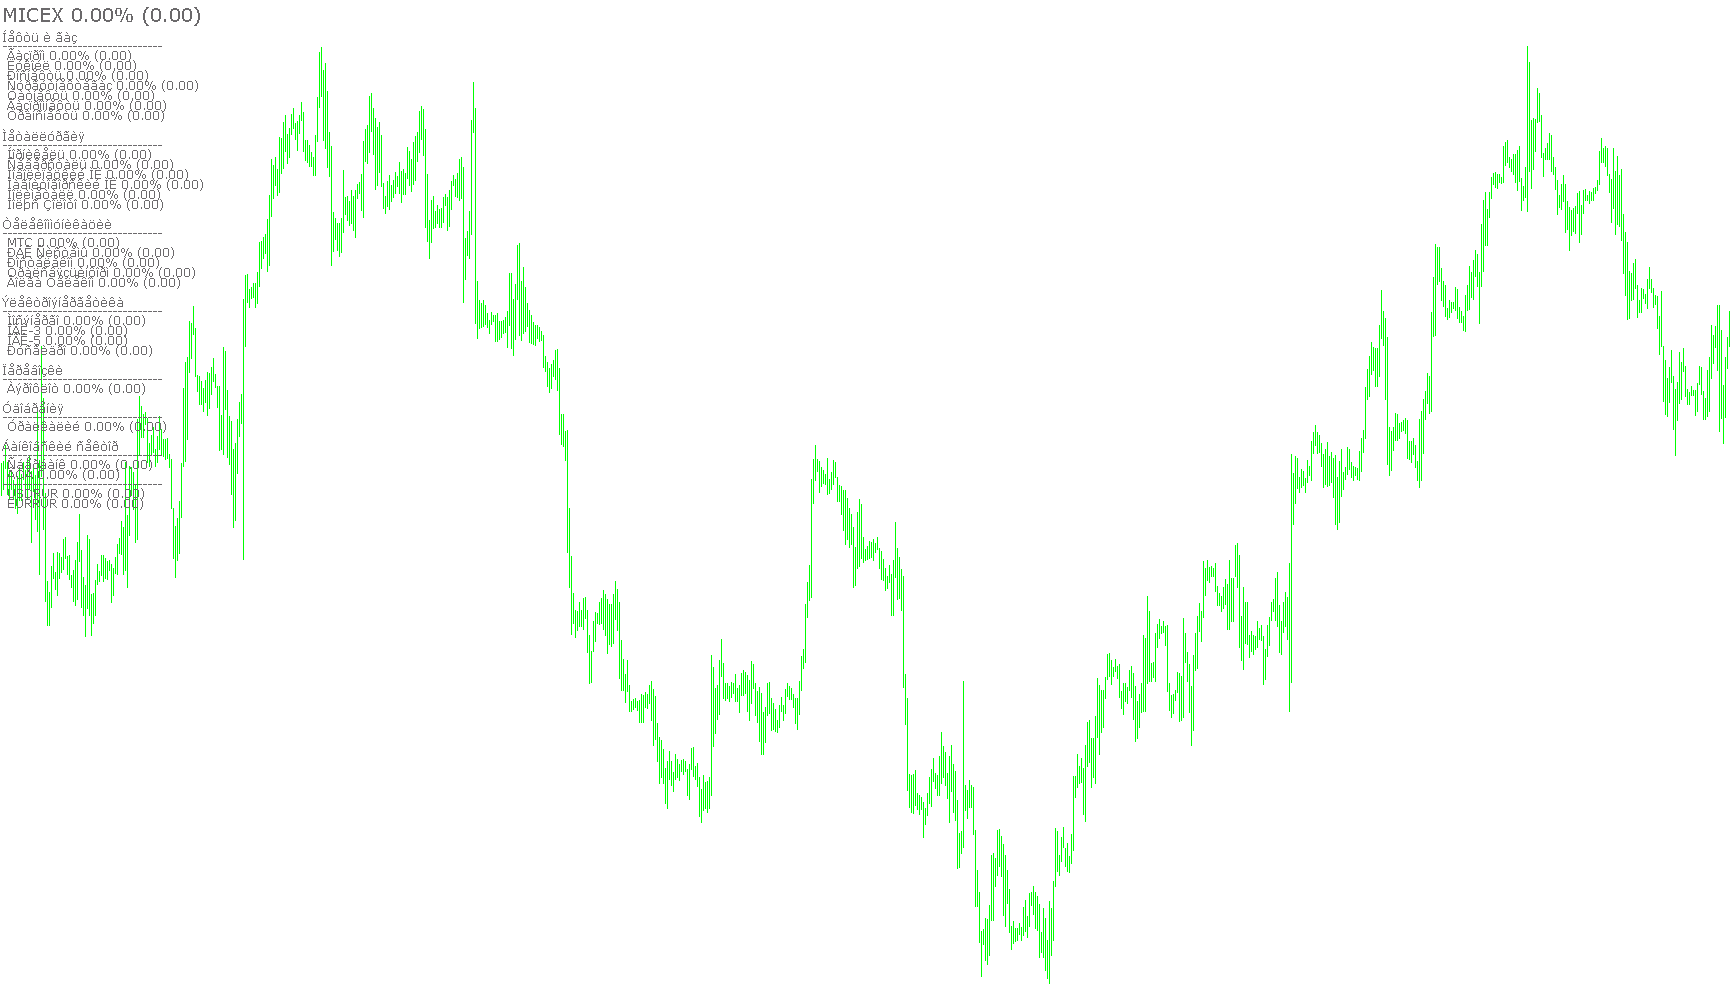
This indicator calculates and displays the real-time daily percentage change for a diverse range of Russian stocks and currency pairs, categorized by industrial sectors.

Percent Change USStocks
Indicator

Percent Change USStocks

This indicator monitors and visualizes the daily percentage price changes of major U.S. stocks, industrial sectors, and global indices to provide a real-time snapshot of market sentiment.

Percent R - PCR
Indicator

Percent R - PCR

Calculates the percentage of the distance between the highest high and lowest low that the current closing price has traversed over a specific lookback period.

percent
Indicator

percent

This indicator calculates the statistical frequency of current price action residing within the historical price boundaries of a defined lookback period to measure local concentration.

Percentage
Indicator

Percentage

This indicator dynamically calculates and displays real-time percentage fluctuations and absolute price changes for daily, weekly, and monthly intervals on the chart.

Percenter
Indicator

Percenter

Calculates terminal capital ratios by processing simple, compound, nominal, and continuous growth rates over defined temporal intervals.
PercentR - PCR1
Indicator

PercentR - PCR1

The indicator calculates the percentage of the current closing price relative to the extreme high and low boundaries over a specified look-back period.

PercentR - PCR1_001
Indicator

PercentR - PCR1_001

This indicator quantifies the proximity of the current closing price to the extreme lower bound of a rolling high-low range as a percentage.

Percent_Levels
Indicator

Percent_Levels

The algorithm dynamically projects a series of equidistant price expansion levels based on a fixed percentage deviation from a specific historical closing price.

Perceptron AI
Indicator

Perceptron AI

iAC

The logic executes a multi-layered weighted summation of the Accumulation/Distribution (AC) indicator across four distinct temporal offsets to generate a binary activation state.

Perintis[DIGISTOCH]
Indicator

Perintis[DIGISTOCH]

iStochastic

This indicator aggregates and visualizes real-time stochastic momentum across six distinct timeframes simultaneously, using dynamic color-coding and directional arrows to identify concurrent bullish and bearish trend alignments.

PeriodAdaptiveMA
Indicator

PeriodAdaptiveMA

iMAOnArray

Calculates a rolling moving average of price data exclusively for the current trading day, resetting its calculation buffer at each new daily open.

periodgen
Indicator

periodgen

This script parses granular M1 historical binary files to aggregate and reconstruct synchronized multi-timeframe data arrays from M5 up to D1.

PeriodSeperator_edited_by_tc_v1.1mm
Indicator

PeriodSeperator_edited_by_tc_v1.1mm

This indicator automates the projection of vertical session boundaries and specific time-based price milestones across multiple multi-timeframe intervals.

Period_Converter++
Indicator

Period_Converter++

This indicator synthesizes raw price data into higher timeframe structures by calculating OHLCV values and exporting them to both .hst and .csv file formats.

period_converter
Indicator

period_converter

This script aggregates lower timeframe price data into a larger custom period and exports the reconstructed OHLCV history to an external binary file.

period_converterALL
Indicator

period_converterALL

This script parses M1 price data to reconstruct and export synchronized historical OHLCV records into multiple higher timeframes simultaneously.

period_converter_ALL
Indicator

period_converter_ALL

This script iterates through minute-level historical data to synthesize and export aggregated OHLCV candles into multiple higher timeframes simultaneously.

Period_Converter_MN
Indicator

Period_Converter_MN

This indicator performs real-time aggregation of minute-level data into custom expanded monthly timeframes by generating persistent offline history files and broadcasting window updates via Win32 API calls.

Period_Converter_MultiWindows
Indicator

Period_Converter_MultiWindows

This indicator dynamically aggregates tick data into custom timeframes by generating synthetic history files and broadcasting live updates to multiple offline charts via Win32 API calls.

Period_Converter_Opt
Indicator

Period_Converter_Opt

This indicator dynamically synthesizes higher timeframe data by interpolating raw price action into custom offline history files with real-time synchronization.

period_converter_shift
Indicator

period_converter_shift

This script parses historical price data to synthesize and export custom timeframe bars into a binary file based on user-defined multipliers and time offsets.

PerkyAsctrend1-2
Indicator

PerkyAsctrend1-2

iWPR

This indicator identifies trend exhaustion by monitoring price expansion relative to average volatility, utilizing a modified Williams %R and historical range calculations to signal peak reversals.

PerkyAsctrend1
Indicator

PerkyAsctrend1

iWPR

This indicator identifies momentum shifts by analyzing relative price expansion against average volatility and detecting specific breakout thresholds using a modified William's Percent Range calculation.

PerkyAsctrend11
Indicator

PerkyAsctrend11

iWPR

Identifies trend reversals by monitoring price action deviations against rolling average ranges combined with a smoothed Williams Percent Range filter.

PerkyAsctrend11_v1
Indicator

PerkyAsctrend11_v1

iWPR

The logic identifies trend reversals by calculating the average price volatility and scanning for significant expansion gaps relative to the Williams %R oscillator's momentum values.

PerkyAsctrend1_v1
Indicator

PerkyAsctrend1_v1

iWPR

The indicator identifies structural trend shifts by analyzing price expansion relative to average volatility using a dynamic Williams Percent Range calculation.

PerkyAsctrend1_v2
Indicator

PerkyAsctrend1_v2

iWPR

The indicator identifies trend reversals by correlating Weighted Price Range (WPR) exhaustion levels with significant price-action volatility spikes and multi-bar expansion thresholds.

PerkyAsctrend1_v3
Indicator

PerkyAsctrend1_v3

iWPR

This indicator identifies trend reversals by calculating dynamic volatility ranges to filter Williams Percent Range (WPR) extremes and pinpoint breakout levels.

PerkyAsctrend1_v4
Indicator

PerkyAsctrend1_v4

iWPR

This indicator identifies trend reversals by monitoring the William %R oscillator relative to dynamic volatility thresholds calculated from average bar ranges and price movement spikes.

Perkytrend
Indicator

Perkytrend

iADX

This indicator identifies bullish momentum by tracking the ADX mainline's ascent above a specific intensity floor to filter out range-bound noise.

PFE
Indicator

PFE

iMAOnArray

This indicator quantifies price velocity by dividing the net displacement over a specific period by the cumulative absolute volatility of those same candles.

Indicator

pfe2 ex

pfe2
Indicator

pfe2

The indicator calculates a momentum-based efficiency ratio by comparing the square root of current price displacement against cumulative historical volatility, smoothed through an exponential recursive filter.

pfe2_v1
Indicator

pfe2_v1

This indicator quantifies price movement velocity by calculating the ratio of long-term directional displacement against cumulative short-term volatility, smoothed via an exponential weighting decay.

pfe2_v2
Indicator

pfe2_v2

This indicator quantifies price velocity by comparing the square root of long-term displacement against a cumulative sum of short-term oscillations, applying an exponential smoothing filter to stabilize the resulting momentum trajectory.

Phat_TD_REI
Indicator

Phat_TD_REI

This indicator categorizes price momentum signals from the TD_REI source into bullish, bearish, and neutral histogram zones based on customizable numerical thresholds.