Pivots Custom
Download script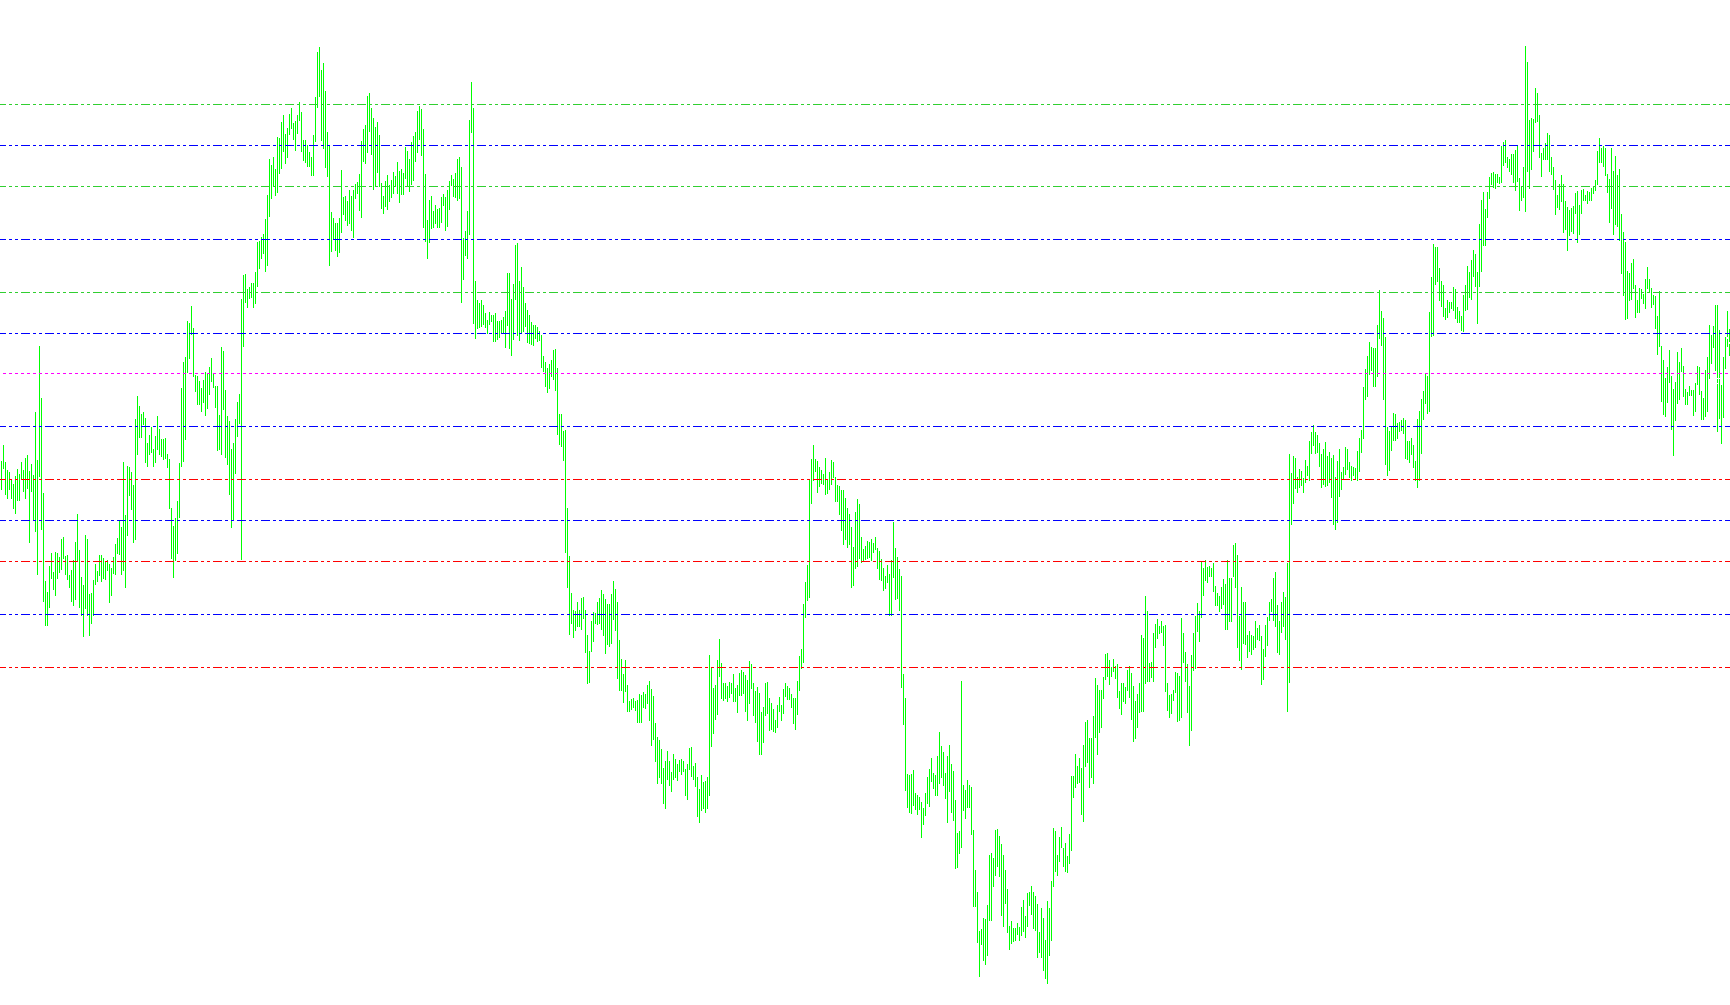
This script is a financial analysis tool designed for the MetaTrader platform. Its primary purpose is to automatically calculate and visualize key price levels—known as Pivot Points, Camarilla Levels, and Midpoints—directly on your trading charts. These levels are frequently used by traders to identify potential support and resistance zones where the price might encounter difficulty moving higher or lower.
Core Functionality
The script works by gathering historical price data (specifically the high, low, and closing prices) from previous trading sessions. Based on this data, it calculates several types of technical levels:
1. Standard Pivot Points The tool identifies the "main" pivot point (the balance point of the previous day's price action) and projects three levels above it (Resistance) and three levels below it (Support). These help traders gauge the overall "swing" of the market.
2. Camarilla Levels These are specialized price levels often used by day traders to predict potential breakout points or reversal zones. The script calculates four specific levels (H3, H4, L3, L4) based on the range of the previous trading period.
3. Midpoint Pivots To provide even more granular detail, the script can display "midpoints." These are the mathematical halfway marks between the major support and resistance lines, offering more precise areas for potential price consolidation.
Key Features & User Experience
- Dynamic Visualization: Instead of just providing numbers, the script automatically draws horizontal lines and text labels on your chart. This allows you to see exactly where these levels sit in relation to current market movement.
- Timeframe Flexibility: You can adjust the settings to pull data from different timeframes (such as Daily, Hourly, etc.). The script is intelligent enough to handle these shifts, ensuring the levels remain relevant to the chart you are viewing.
- Customizable View: The script includes "toggle" switches in its settings. This means you can choose to see everything at once, or you can turn off specific sections (like Camarilla or Midpoints) to keep your chart clean and focused on the data that matters most to your specific strategy.
- Real-Time Updates: As new price data arrives, the script updates the levels and provides a text comment on the screen showing the current high, low, range, and even a countdown of how much time remains until the next candle forms.
Summary for the User
In short, this tool replaces manual calculations with automated visual cues. It takes the "math" out of identifying support and resistance, allowing you to see significant price boundaries instantly so you can make faster, more informed trading decisions.
//+------------------------------------------------------------------+
//|                                                        Pivot.mq4 |
//|                      Copyright © 2004, MetaQuotes Software Corp. |
//|                                        http://www.metaquotes.net |
//|                                                                  |
//|                                    Modified by Alejandro Galindo |
//|                                                  ag@elcactus.com |
//|                                                                  |
//|                         Additional Modifications by Trinity Webs |
//|                                     http://forex.trinitywebs.com |
//+------------------------------------------------------------------+
#property copyright "Copyright © 2004, MetaQuotes Software Corp."
#property link      "http://www.metaquotes.net"

#property indicator_chart_window
#property indicator_buffers 1
#property indicator_color1 CLR_NONE


extern bool pivots     = true;
extern bool camarilla  = false;
extern bool midpivots  = true;
extern int  TimeOffset = 0;
extern int  TimeFrame  = PERIOD_D1;
/*+----------------------------------------------------+
  Options for TimeFrame
       1 for M1
       5 for M5
      15 for M15
      30 for M30
      60 for H1
     240 for H4
    1440 for D1
   10080 for W1
   43200 for MN1
  +-------------------------------------------------------*/


double day_high=0;
double day_low=0;
double yesterday_high=0;
double yesterday_open=0;
double yesterday_low=0;
double yesterday_close=0;
double today_open=0;
double today_high=0;
double today_low=0;
double P=0;
double Q=0;
double R1,R2,R3;
double M0,M1,M2,M3,M4,M5;
double S1,S2,S3;
double H4,H3,L4,L3;
double nQ=0;
double nD=0;
double D=0;
double rates_d1[2][6];
double rates_h1[2][6];
double ExtMapBuffer1[];

//+------------------------------------------------------------------+
//| Custom indicator initialization function                         |
//+------------------------------------------------------------------+
int init() {
  IndicatorBuffers(4);
  SetIndexStyle(0,DRAW_ARROW);
  SetIndexArrow(0,159);
  SetIndexBuffer(0, ExtMapBuffer1);

  //---- indicators
  R1=0; R2=0; R3=0;
  M0=0; M1=0; M2=0; M3=0; M4=0; M5=0;
  S1=0; S2=0; S3=0;
  H4=0; H3=0; L4=0; L3=0;

  return(0);
}

//+------------------------------------------------------------------+
//| Custom indicator deinitialization function                       |
//+------------------------------------------------------------------+
int deinit() {
  ObjectDelete("R1 Label");
  ObjectDelete("R1 Line");
  ObjectDelete("R2 Label");
  ObjectDelete("R2 Line");
  ObjectDelete("R3 Label");
  ObjectDelete("R3 Line");
  ObjectDelete("S1 Label");
  ObjectDelete("S1 Line");
  ObjectDelete("S2 Label");
  ObjectDelete("S2 Line");
  ObjectDelete("S3 Label");
  ObjectDelete("S3 Line");
  ObjectDelete("P Label");
  ObjectDelete("P Line");
  ObjectDelete("H4 Label");
  ObjectDelete("H4 Line");
  ObjectDelete("H3 Label");
  ObjectDelete("H3 Line");
  ObjectDelete("L3 Label");
  ObjectDelete("L3 Line");
  ObjectDelete("L4 Label");
  ObjectDelete("L4 Line");
  ObjectDelete("M5 Label");
  ObjectDelete("M5 Line");
  ObjectDelete("M4 Label");
  ObjectDelete("M4 Line");
  ObjectDelete("M3 Label");
  ObjectDelete("M3 Line");
  ObjectDelete("M2 Label");
  ObjectDelete("M2 Line");
  ObjectDelete("M1 Label");
  ObjectDelete("M1 Line");
  ObjectDelete("M0 Label");
  ObjectDelete("M0 Line");
  return(0);
}

//+------------------------------------------------------------------+
//| Custom indicator iteration function                              |
//+------------------------------------------------------------------+
int start()
  {

//---- TODO: add your code here
if (TimeFrame != 10080 && TimeFrame != 43200)
  TimeFrame = PERIOD_D1;

//if (TimeFrame < PERIOD_D1)
  //TimeFrame = PERIOD_D1;

//---- exit if period is greater than daily charts
if(Period() > 1440 && TimeFrame == PERIOD_D1) {
  Print("Error - Chart period is greater than 1 day.");
  return(-1); // then exit
}

//---- Get new daily prices

if (TimeFrame != PERIOD_D1) {
  ArrayCopyRates(rates_d1, Symbol(), TimeFrame);
  yesterday_close = rates_d1[1][4];
  yesterday_open = rates_d1[1][1];
  today_open = rates_d1[0][1];
  yesterday_high = rates_d1[1][3];
  yesterday_low = rates_d1[1][2];
  day_high = rates_d1[0][3];
  day_low = rates_d1[0][2];
}
else {
  ArrayCopyRates(rates_d1, Symbol(), PERIOD_D1);
  yesterday_high = rates_d1[1][3];
  yesterday_low = rates_d1[1][2];
  day_high = rates_d1[0][3];
  day_low = rates_d1[0][2];

  ArrayCopyRates(rates_h1, Symbol(), PERIOD_H1);
  for (int i=0; i<=25; i++)
  {
    if (TimeMinute(rates_h1[i][0]) == 0 && (TimeHour(rates_h1[i][0]) - TimeOffset) == 0)
    {
      yesterday_close = rates_h1[i+1][4];
      yesterday_open = rates_h1[i+24][1];
      today_open = rates_h1[i][1];
      break;
    }
  }
}

//---- Calculate Pivots

D = (day_high - day_low);
Q = (yesterday_high - yesterday_low);
P = (yesterday_high + yesterday_low + yesterday_close) / 3;
R1 = (2*P)-yesterday_low;
S1 = (2*P)-yesterday_high;
R2 = P+(yesterday_high - yesterday_low);
S2 = P-(yesterday_high - yesterday_low);

	H4 = (Q*0.55)+yesterday_close;
	H3 = (Q*0.27)+yesterday_close;
	R3 = (2*P)+(yesterday_high-(2*yesterday_low));
	M5 = (R2+R3)/2;
//	R2 = P-S1+R1;
	M4 = (R1+R2)/2;
//	R1 = (2*P)-yesterday_low;
	M3 = (P+R1)/2;
//	P = (yesterday_high + yesterday_low + yesterday_close)/3;
	M2 = (P+S1)/2;
//	S1 = (2*P)-yesterday_high;
	M1 = (S1+S2)/2;
//	S2 = P-R1+S1;
	S3 = (2*P)-((2* yesterday_high)-yesterday_low);
	L3 = yesterday_close-(Q*0.27);
	L4 = yesterday_close-(Q*0.55);
	M0 = (S2+S3)/2;

if (Q > 5)
{
	nQ = Q;
}
else
{
	nQ = Q*10000;
}

if (D > 5)
{
	nD = D;
}
else
{
	nD = D*10000;
}


//Comment("High= ",yesterday_high,"    Previous Days Range= ",nQ,"\nLow= ",yesterday_low,"    Current Days Range= ",nD,"\nClose= ",yesterday_close);

double seco= (Time[4]-Time[5])-MathMod(CurTime(),Time[4]-Time[5]);
double minu=seco/60;
seco=(minu-MathFloor(minu))*60;
minu=MathFloor(minu);

Comment("High= ",yesterday_high,"    Previous Days Range= ",nQ,"\nLow= ",yesterday_low,"    Current Days Range= ",nD,"\nClose= ",yesterday_close,"    Time Frame= ", TimeFrame, "\nTime for next bar: ",	minu," min ",seco," sec");

//---- Set line labels on chart window

//---- Pivot Lines
   if (pivots==true)
   {
      if(ObjectFind("R1 label") != 0)
      {
      ObjectCreate("R1 label", OBJ_TEXT, 0, Time[0], R1);
      ObjectSetText("R1 label", " R1", 8, "Arial", EMPTY);
      }
      else
      {
      ObjectMove("R1 label", 0, Time[0], R1);
      }

      if(ObjectFind("R2 label") != 0)
      {
      ObjectCreate("R2 label", OBJ_TEXT, 0, Time[0], R2);
      ObjectSetText("R2 label", " R2", 8, "Arial", EMPTY);
      }
      else
      {
      ObjectMove("R2 label", 0, Time[0], R2);
      }

      if(ObjectFind("R3 label") != 0)
      {
      ObjectCreate("R3 label", OBJ_TEXT, 0, Time[0], R3);
      ObjectSetText("R3 label", " R3", 8, "Arial", EMPTY);
      }
      else
      {
      ObjectMove("R3 label", 0, Time[0], R3);
      }

      if(ObjectFind("P label") != 0)
      {
      ObjectCreate("P label", OBJ_TEXT, 0, Time[0], P);
      ObjectSetText("P label", "Pivot  " +DoubleToStr(P,4), 8, "Arial", EMPTY);
      }
      else
      {
      ObjectMove("P label", 0, Time[0], P);
      }

      if(ObjectFind("S1 label") != 0)
      {
      ObjectCreate("S1 label", OBJ_TEXT, 0, Time[0], S1);
      ObjectSetText("S1 label", "S1", 8, "Arial", EMPTY);
      }
      else
      {
      ObjectMove("S1 label", 0, Time[0], S1);
      }

      if(ObjectFind("S2 label") != 0)
      {
      ObjectCreate("S2 label", OBJ_TEXT, 0, Time[0], S2);
      ObjectSetText("S2 label", "S2", 8, "Arial", EMPTY);
      }
      else
      {
      ObjectMove("S2 label", 0, Time[0], S2);
      }

      if(ObjectFind("S3 label") != 0)
      {
      ObjectCreate("S3 label", OBJ_TEXT, 0, Time[0], S3);
      ObjectSetText("S3 label", "S3", 8, "Arial", EMPTY);
      }
      else
      {
      ObjectMove("S3 label", 0, Time[0], S3);
      }

//---  Draw  Pivot lines on chart
      if(ObjectFind("S1 line") != 0)
      {
      ObjectCreate("S1 line", OBJ_HLINE, 0, Time[40], S1);
      ObjectSet("S1 line", OBJPROP_STYLE, STYLE_DASHDOTDOT);
      ObjectSet("S1 line", OBJPROP_COLOR, Red);
      }
      else
      {
      ObjectMove("S1 line", 0, Time[40], S1);
      //ObjectSet("S1 line", OBJPROP_COLOR, indicator_color1);
      }

      if(ObjectFind("S2 line") != 0)
      {
      ObjectCreate("S2 line", OBJ_HLINE, 0, Time[40], S2);
      ObjectSet("S2 line", OBJPROP_STYLE, STYLE_DASHDOTDOT);
      ObjectSet("S2 line", OBJPROP_COLOR, Red);
      }
      else
      {
      ObjectMove("S2 line", 0, Time[40], S2);
      }

      if(ObjectFind("S3 line") != 0)
      {
      ObjectCreate("S3 line", OBJ_HLINE, 0, Time[40], S3);
      ObjectSet("S3 line", OBJPROP_STYLE, STYLE_DASHDOTDOT);
      ObjectSet("S3 line", OBJPROP_COLOR, Red);
      }
      else
      {
      ObjectMove("S3 line", 0, Time[40], S3);
      }

      if(ObjectFind("P line") != 0)
      {
      ObjectCreate("P line", OBJ_HLINE, 0, Time[40], P);
      ObjectSet("P line", OBJPROP_STYLE, STYLE_DOT);
      ObjectSet("P line", OBJPROP_COLOR, Magenta);
      }
      else
      {
      ObjectMove("P line", 0, Time[40], P);
      }

      if(ObjectFind("R1 line") != 0)
      {
      ObjectCreate("R1 line", OBJ_HLINE, 0, Time[40], R1);
      ObjectSet("R1 line", OBJPROP_STYLE, STYLE_DASHDOTDOT);
      ObjectSet("R1 line", OBJPROP_COLOR, LimeGreen);
      }
      else
      {
      ObjectMove("R1 line", 0, Time[40], R1);
      }

      if(ObjectFind("R2 line") != 0)
      {
      ObjectCreate("R2 line", OBJ_HLINE, 0, Time[40], R2);
      ObjectSet("R2 line", OBJPROP_STYLE, STYLE_DASHDOTDOT);
      ObjectSet("R2 line", OBJPROP_COLOR, LimeGreen);
      }
      else
      {
      ObjectMove("R2 line", 0, Time[40], R2);
      }

      if(ObjectFind("R3 line") != 0)
      {
      ObjectCreate("R3 line", OBJ_HLINE, 0, Time[40], R3);
      ObjectSet("R3 line", OBJPROP_STYLE, STYLE_DASHDOTDOT);
      ObjectSet("R3 line", OBJPROP_COLOR, LimeGreen);
      }
      else
      {
      ObjectMove("R3 line", 0, Time[40], R3);
      }
   }
//---- End of Pivot Line Draw


//----- Camarilla Lines

   if (camarilla==true)
   {
      if(ObjectFind("H4 label") != 0)
      {
      ObjectCreate("H4 label", OBJ_TEXT, 0, Time[0], H4);
      ObjectSetText("H4 label", " H4", 8, "Arial", EMPTY);
      }
      else
      {
      ObjectMove("H4 label", 0, Time[0], H4);
      }

      if(ObjectFind("H3 label") != 0)
      {
      ObjectCreate("H3 label", OBJ_TEXT, 0, Time[0], H3);
      ObjectSetText("H3 label", " H3", 8, "Arial", EMPTY);
      }
      else
      {
      ObjectMove("H3 label", 0, Time[0], H3);
      }

      if(ObjectFind("L3 label") != 0)
      {
      ObjectCreate("L3 label", OBJ_TEXT, 0, Time[0], L3);
      ObjectSetText("L3 label", " L3", 8, "Arial", EMPTY);
      }
      else
      {
      ObjectMove("L3 label", 0, Time[0], L3);
      }

      if(ObjectFind("L4 label") != 0)
      {
      ObjectCreate("L4 label", OBJ_TEXT, 0, Time[0], L4);
      ObjectSetText("L4 label", " L4", 8, "Arial", EMPTY);
      }
      else
      {
      ObjectMove("L4 label", 0, Time[0], L4);
      }

//---- Draw Camarilla lines on Chart
      if(ObjectFind("H4 line") != 0)
      {
      ObjectCreate("H4 line", OBJ_HLINE, 0, Time[40], H4);
      ObjectSet("H4 line", OBJPROP_STYLE, STYLE_DASHDOTDOT);
      ObjectSet("H4 line", OBJPROP_COLOR, Yellow);
      }
      else
      {
      ObjectMove("H4 line", 0, Time[40], H4);
      }

      if(ObjectFind("H3 line") != 0)
      {
      ObjectCreate("H3 line", OBJ_HLINE, 0, Time[40], H3);
      ObjectSet("H3 line", OBJPROP_STYLE, STYLE_DASHDOTDOT);
      ObjectSet("H3 line", OBJPROP_COLOR, Yellow);
      }
      else
      {
      ObjectMove("H3 line", 0, Time[40], H3);
      }

      if(ObjectFind("L3 line") != 0)
      {
      ObjectCreate("L3 line", OBJ_HLINE, 0, Time[40], L3);
      ObjectSet("L3 line", OBJPROP_STYLE, STYLE_DASHDOTDOT);
      ObjectSet("L3 line", OBJPROP_COLOR, Yellow);
      }
      else
      {
      ObjectMove("L3 line", 0, Time[40], L3);
      }

      if(ObjectFind("L4 line") != 0)
      {
      ObjectCreate("L4 line", OBJ_HLINE, 0, Time[40], L4);
      ObjectSet("L4 line", OBJPROP_STYLE, STYLE_DASHDOTDOT);
      ObjectSet("L4 line", OBJPROP_COLOR, Yellow);
      }
      else
      {
      ObjectMove("L4 line", 0, Time[40], L4);
      }
   }
//-------End of Draw Camarilla Lines

//------ Midpoints Pivots

   if (midpivots==true)
   {

      if(ObjectFind("M5 label") != 0)
      {
      ObjectCreate("M5 label", OBJ_TEXT, 0, Time[0], M5);
      ObjectSetText("M5 label", " M5", 8, "Arial", EMPTY);
      }
      else
      {
      ObjectMove("M5 label", 0, Time[0], M5);
      }

      if(ObjectFind("M4 label") != 0)
      {
      ObjectCreate("M4 label", OBJ_TEXT, 0, Time[0], M4);
      ObjectSetText("M4 label", " M4", 8, "Arial", EMPTY);
      }
      else
      {
      ObjectMove("M4 label", 0, Time[0], M4);
      }

      if(ObjectFind("M3 label") != 0)
      {
      ObjectCreate("M3 label", OBJ_TEXT, 0, Time[0], M3);
      ObjectSetText("M3 label", " M3", 8, "Arial", EMPTY);
      }
      else
      {
      ObjectMove("M3 label", 0, Time[0], M3);
      }

      if(ObjectFind("M2 label") != 0)
      {
      ObjectCreate("M2 label", OBJ_TEXT, 0, Time[0], M2);
      ObjectSetText("M2 label", " M2", 8, "Arial", EMPTY);
      }
      else
      {
      ObjectMove("M2 label", 0, Time[0], M2);
      }

      if(ObjectFind("M1 label") != 0)
      {
      ObjectCreate("M1 label", OBJ_TEXT, 0, Time[0], M1);
      ObjectSetText("M1 label", " M1", 8, "Arial", EMPTY);
      }
      else
      {
      ObjectMove("M1 label", 0, Time[0], M1);
      }

      if(ObjectFind("M0 label") != 0)
      {
      ObjectCreate("M0 label", OBJ_TEXT, 0, Time[0], M0);
      ObjectSetText("M0 label", " M0", 8, "Arial", EMPTY);
      }
      else
      {
      ObjectMove("M0 label", 0, Time[0], M0);
      }

//---- Draw Midpoint Pivots on Chart
      if(ObjectFind("M5 line") != 0)
      {
      ObjectCreate("M5 line", OBJ_HLINE, 0, Time[40], M5);
      ObjectSet("M5 line", OBJPROP_STYLE, STYLE_DASHDOTDOT);
      ObjectSet("M5 line", OBJPROP_COLOR, Blue);
      }
      else
      {
      ObjectMove("M5 line", 0, Time[40], M5);
      }

      if(ObjectFind("M4 line") != 0)
      {
      ObjectCreate("M4 line", OBJ_HLINE, 0, Time[40], M4);
      ObjectSet("M4 line", OBJPROP_STYLE, STYLE_DASHDOTDOT);
      ObjectSet("M4 line", OBJPROP_COLOR, Blue);
      }
      else
      {
      ObjectMove("M4 line", 0, Time[40], M4);
      }

      if(ObjectFind("M3 line") != 0)
      {
      ObjectCreate("M3 line", OBJ_HLINE, 0, Time[40], M3);
      ObjectSet("M3 line", OBJPROP_STYLE, STYLE_DASHDOTDOT);
      ObjectSet("M3 line", OBJPROP_COLOR, Blue);
      }
      else
      {
      ObjectMove("M3 line", 0, Time[40], M3);
      }

      if(ObjectFind("M2 line") != 0)
      {
      ObjectCreate("M2 line", OBJ_HLINE, 0, Time[40], M2);
      ObjectSet("M2 line", OBJPROP_STYLE, STYLE_DASHDOTDOT);
      ObjectSet("M2 line", OBJPROP_COLOR, Blue);
      }
      else
      {
      ObjectMove("M2 line", 0, Time[40], M2);
      }

      if(ObjectFind("M1 line") != 0)
      {
      ObjectCreate("M1 line", OBJ_HLINE, 0, Time[40], M1);
      ObjectSet("M1 line", OBJPROP_STYLE, STYLE_DASHDOTDOT);
      ObjectSet("M1 line", OBJPROP_COLOR, Blue);
      }
      else
      {
      ObjectMove("M1 line", 0, Time[40], M1);
      }

      if(ObjectFind("M0 line") != 0)
      {
      ObjectCreate("M0 line", OBJ_HLINE, 0, Time[40], M0);
      ObjectSet("M0 line", OBJPROP_STYLE, STYLE_DASHDOTDOT);
      ObjectSet("M0 line", OBJPROP_COLOR, Blue);
      }
      else
      {
      ObjectMove("M0 line", 0, Time[40], M0);
      }

   }
//----End of Midpoint Pivots Draw

//---- End Of Program
   return(0);
//#include "comment.mq4"

  }
//+------------------------------------------------------------------+
Comments