Pivot_W
Indicator

Pivot_W

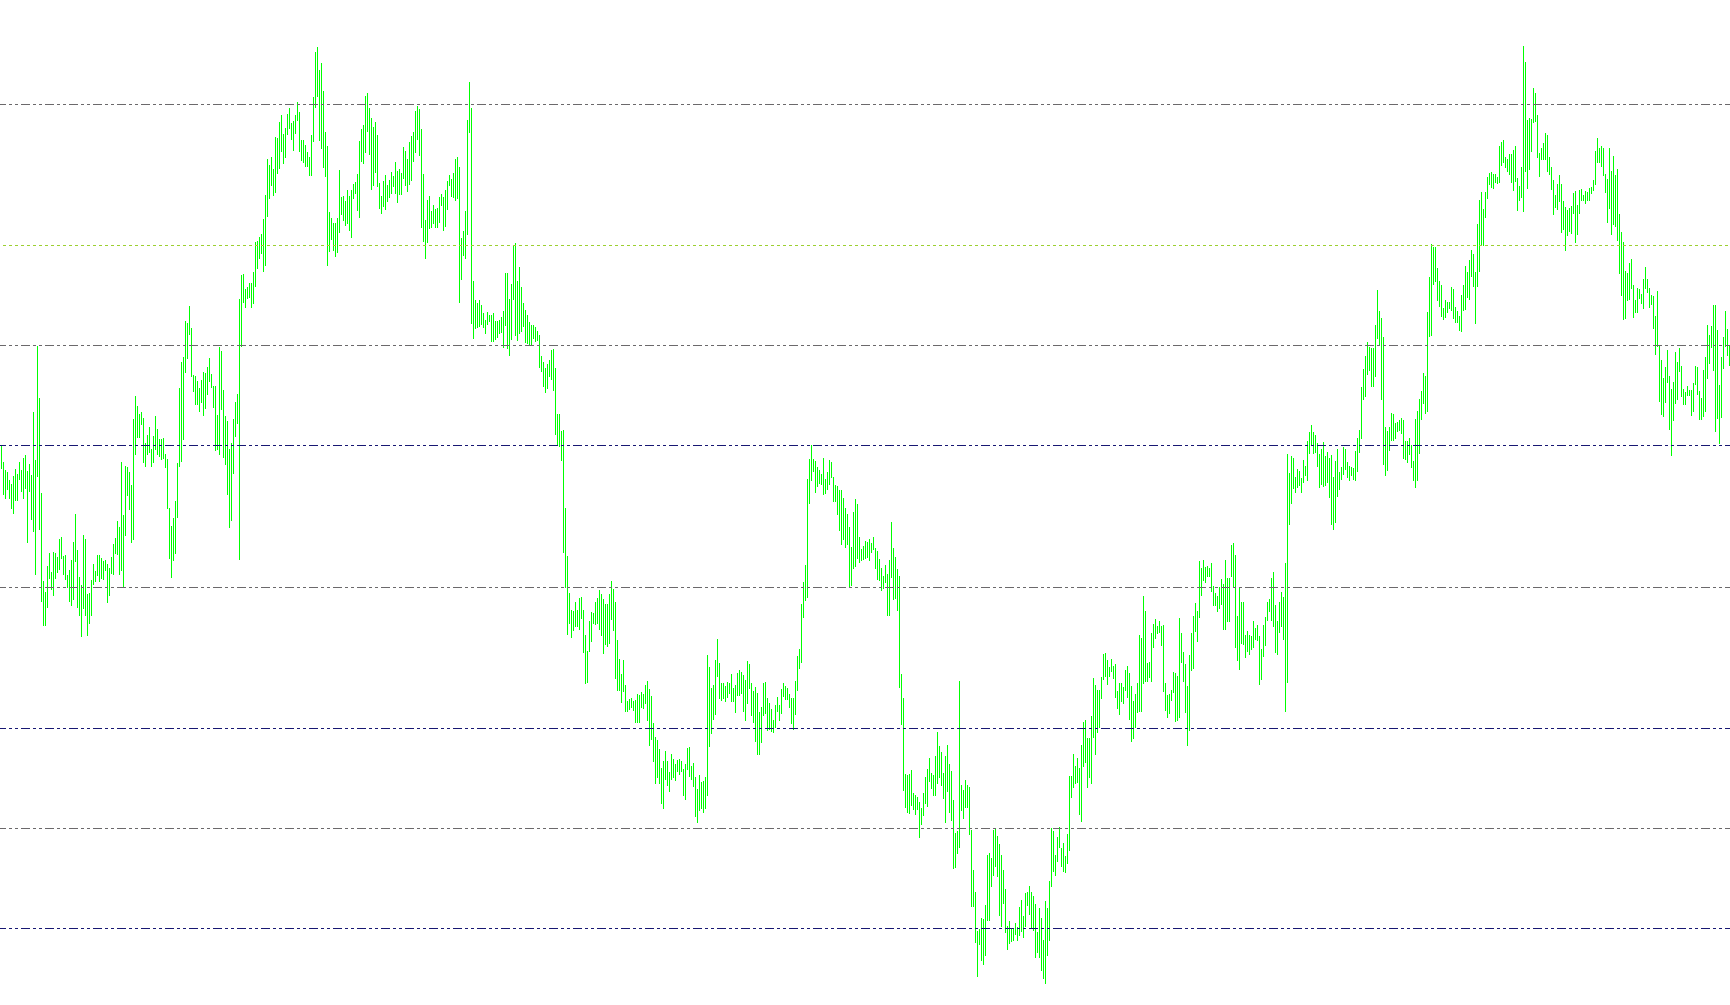
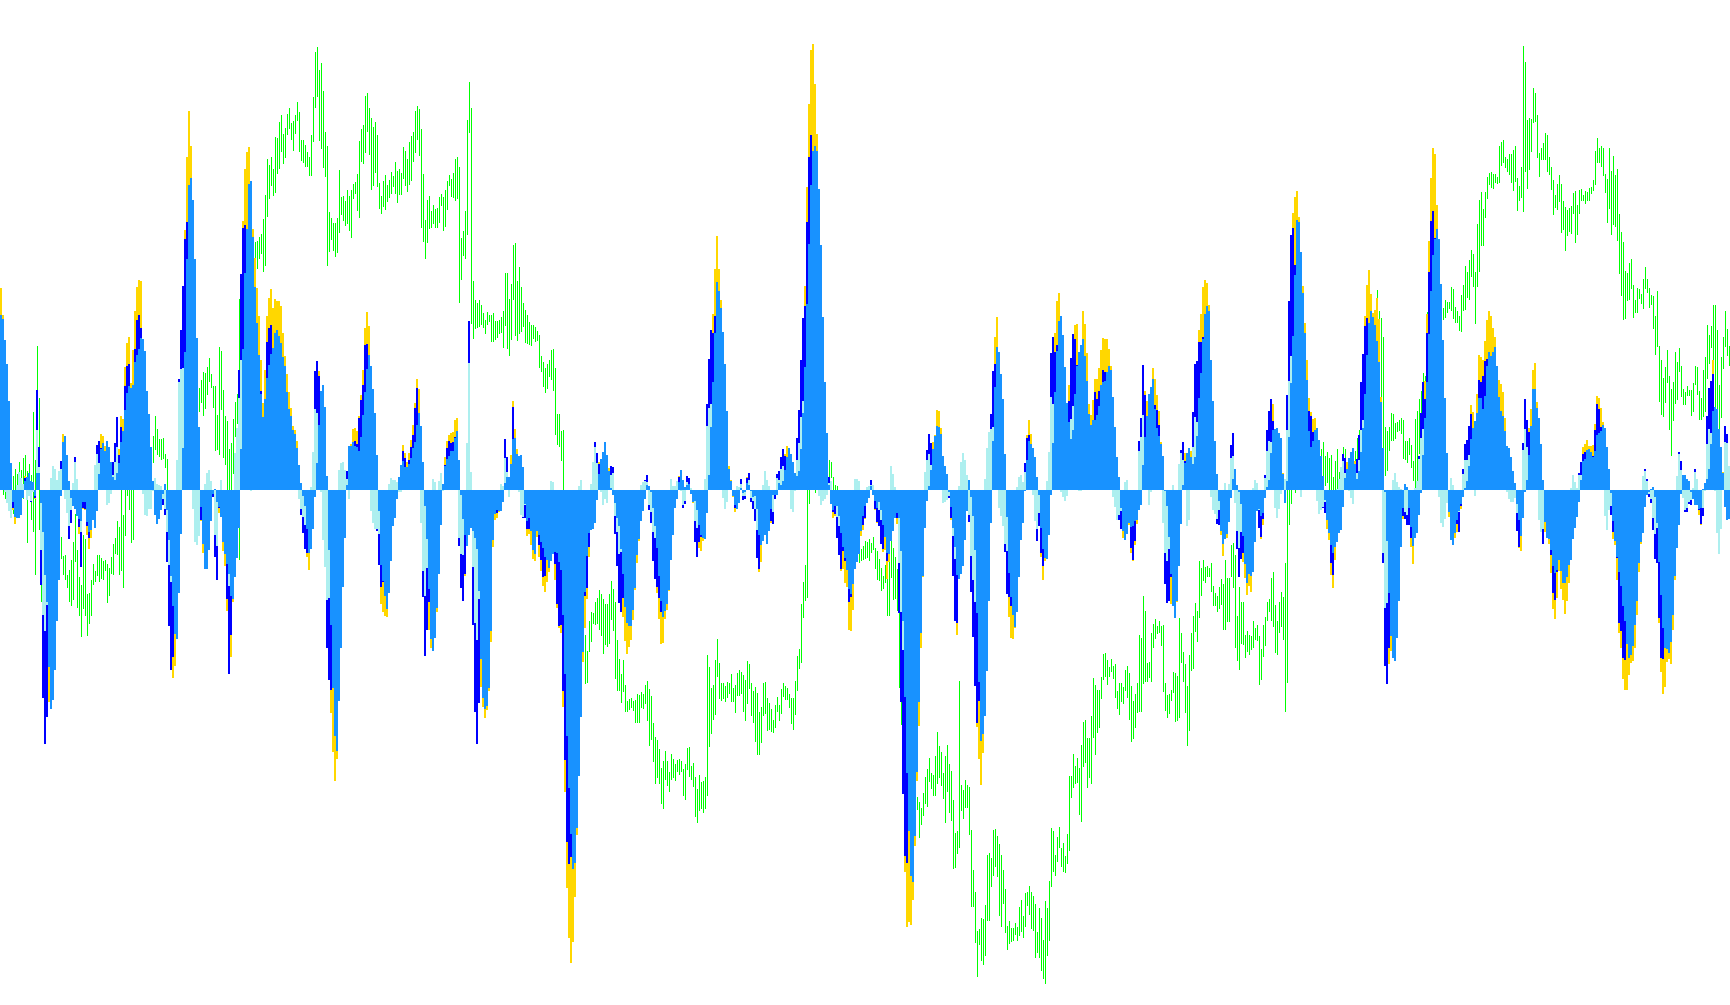
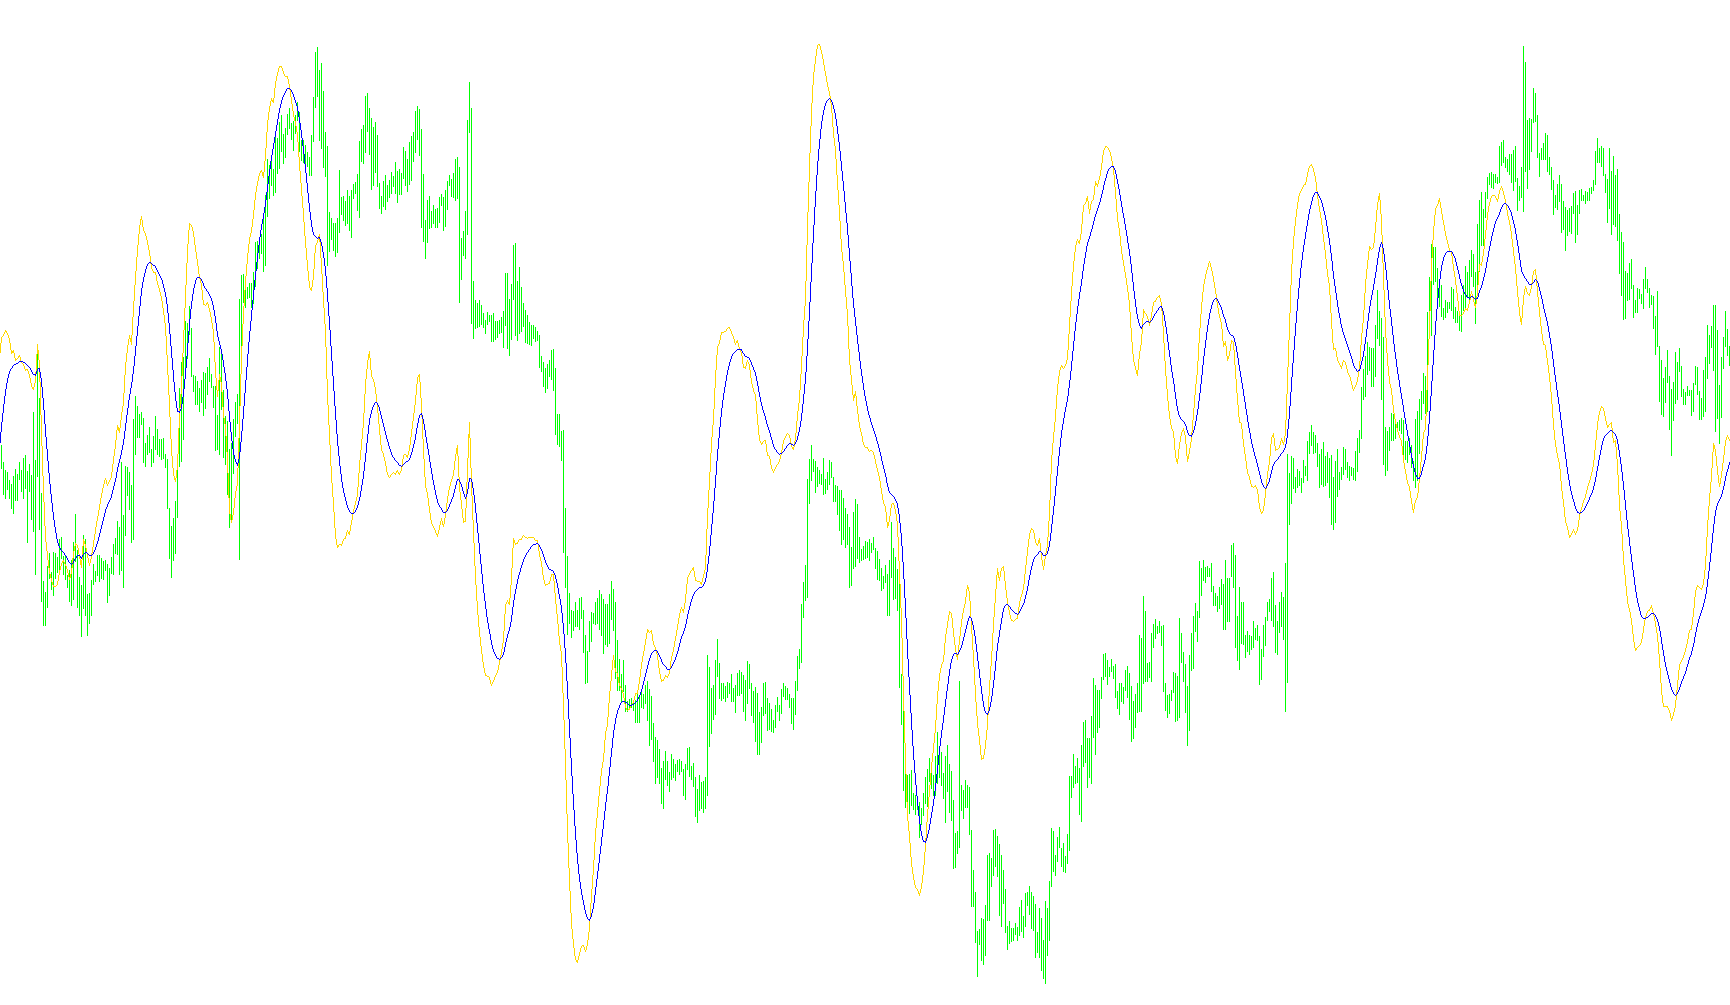
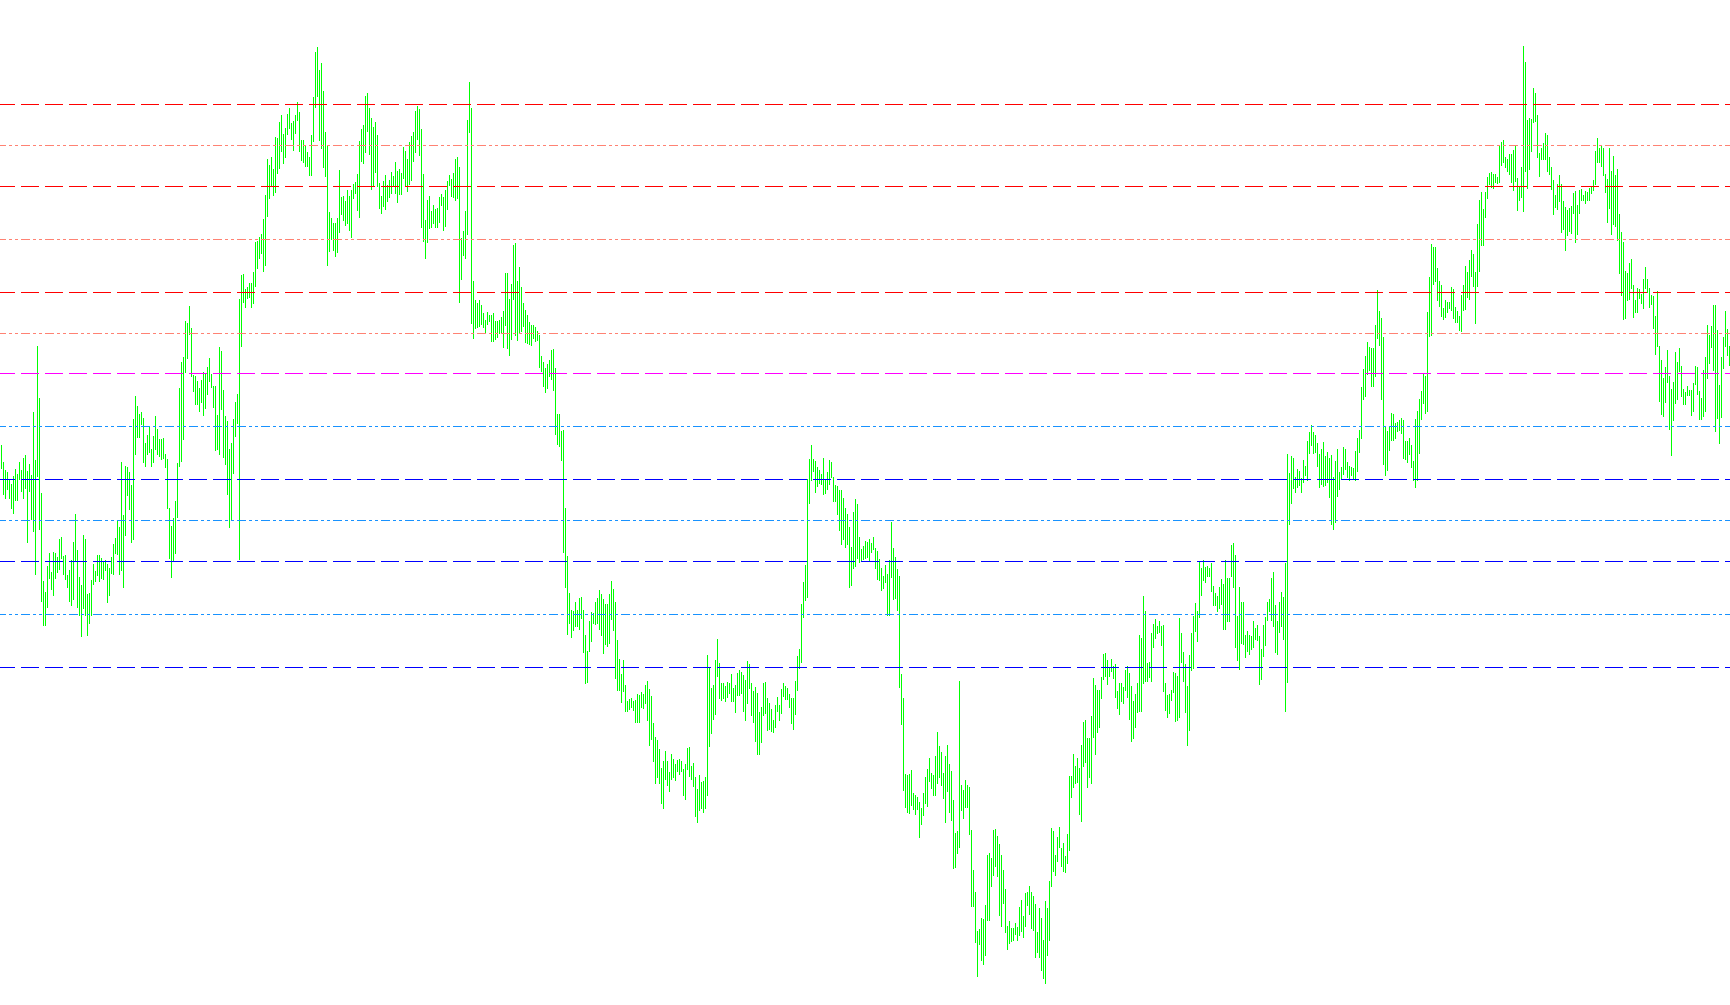
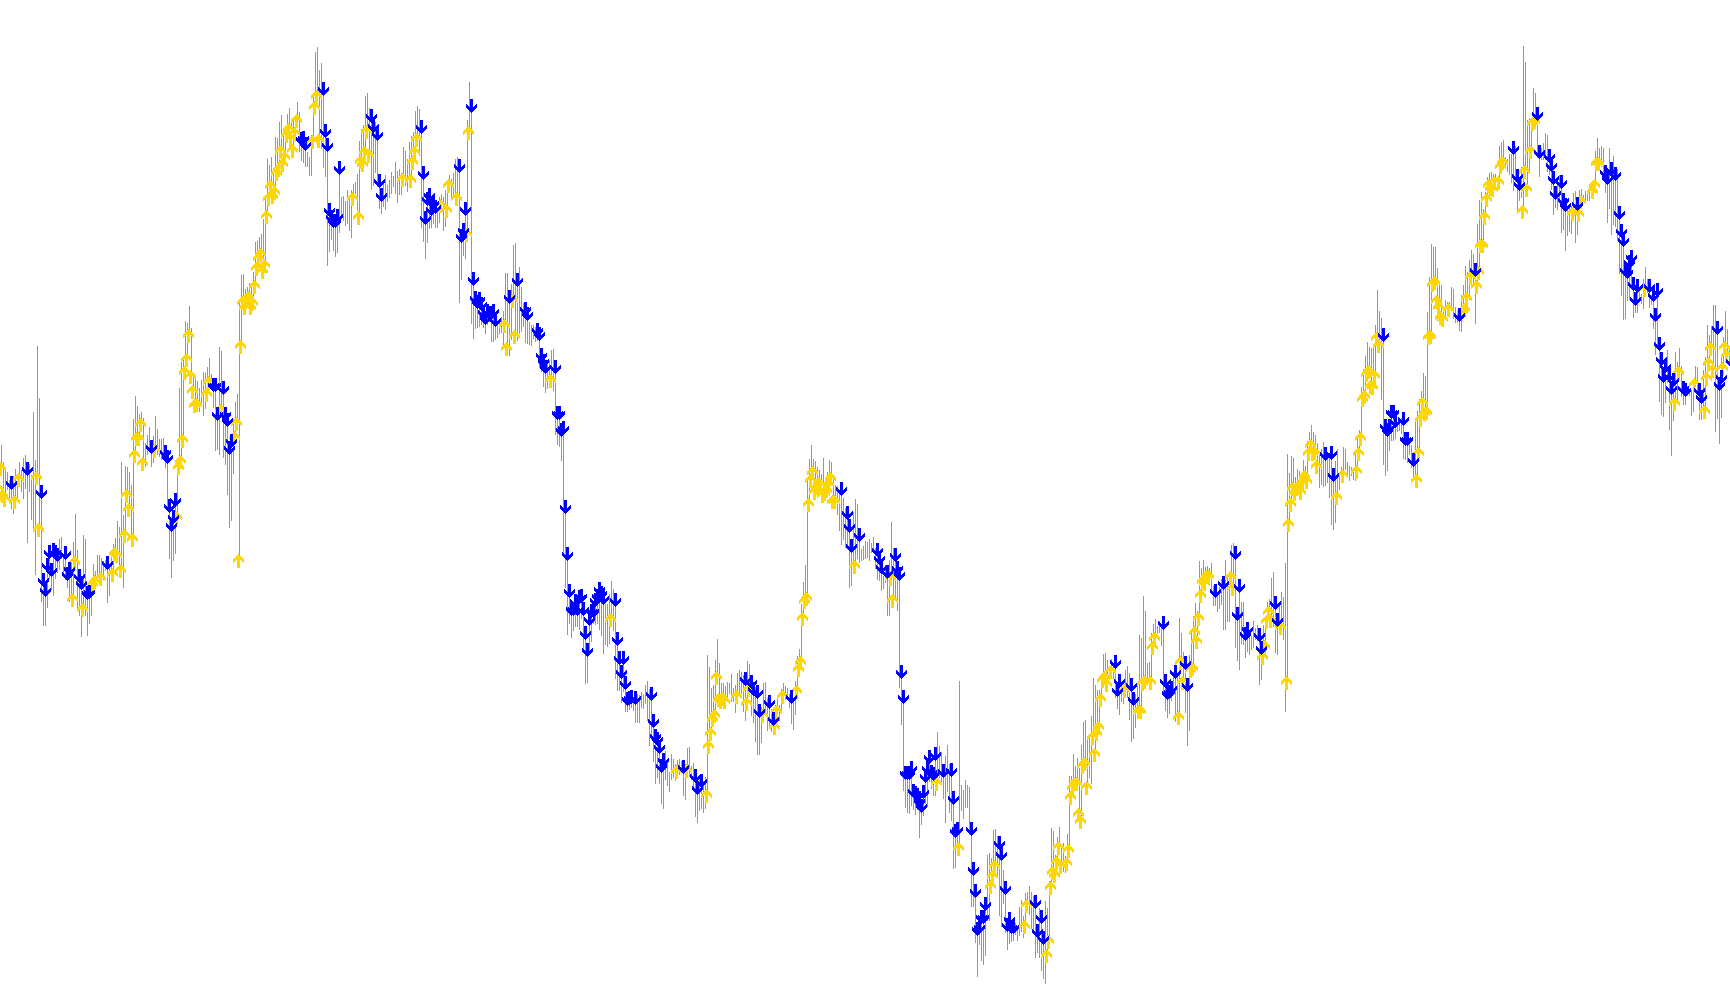
This indicator dynamically maps daily price action to visualize traditional pivot levels, Camarilla breakouts, and internal midpoint zones for high-precision supply and demand identification.

Pivot_WeeklyColorMod_cor
Indicator

Pivot_WeeklyColorMod_cor

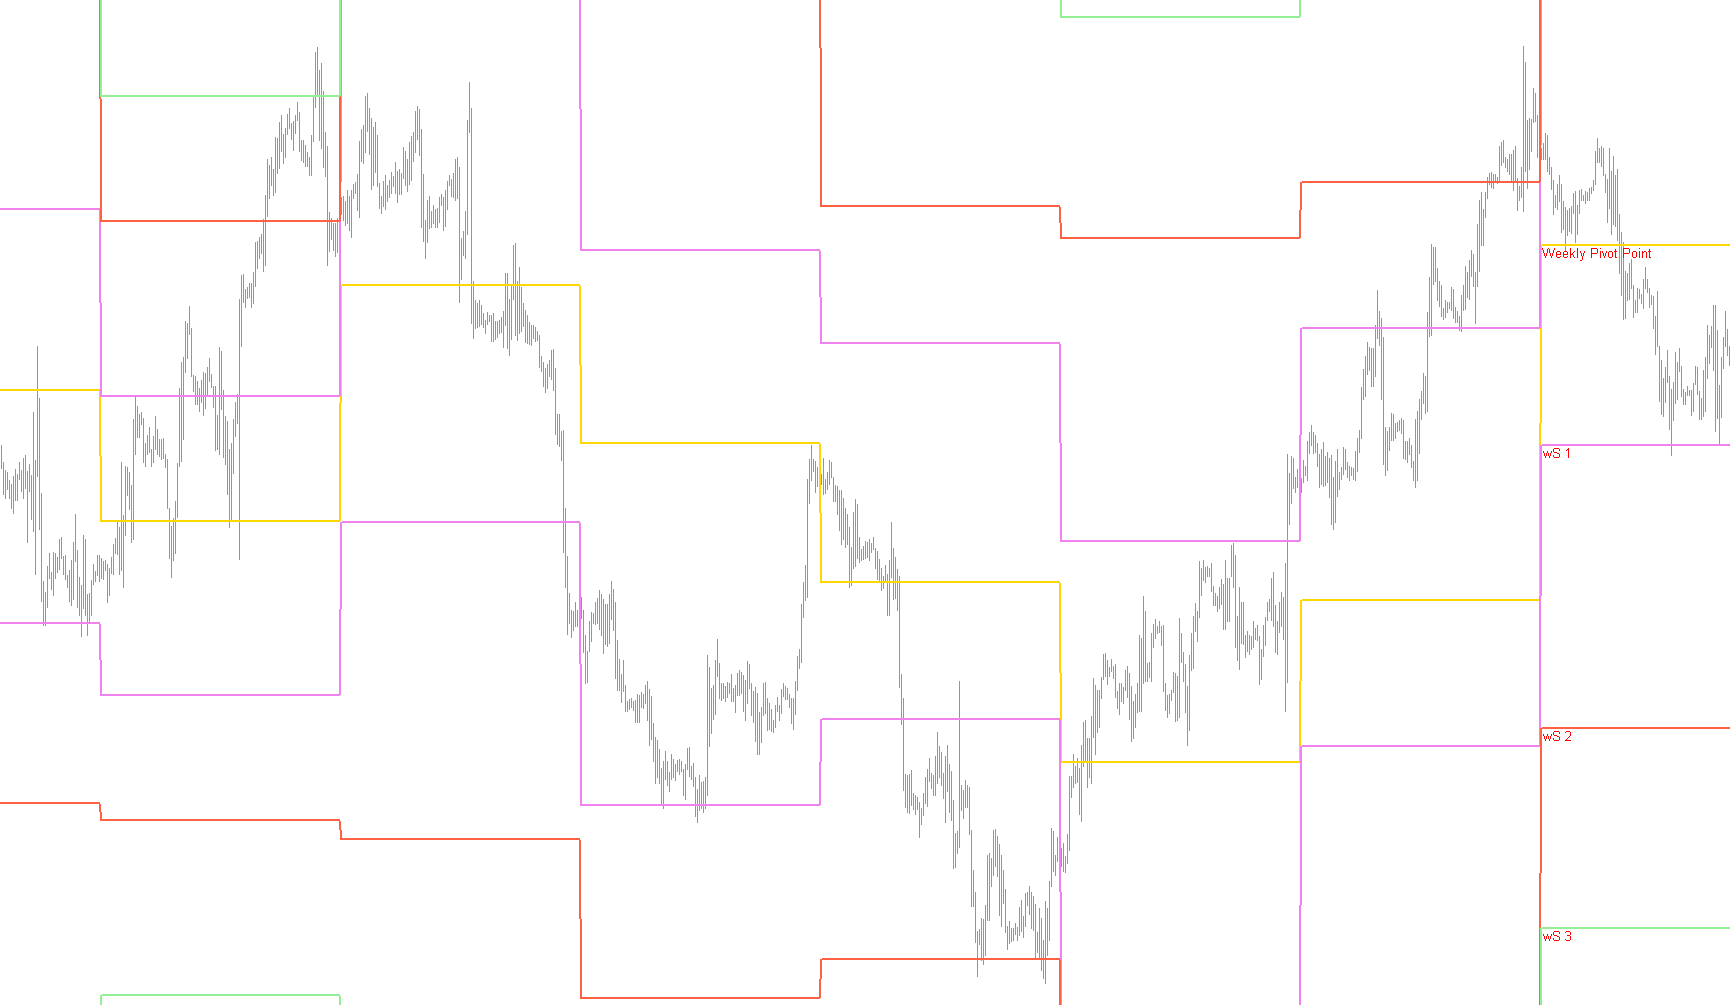
This indicator projects horizontal price zones by calculating weekly pivot levels and multi-tier support/resistance benchmarks based on the preceding week's volatility range.

Pj-over RSI
Indicator

Pj-over RSI

iRSI

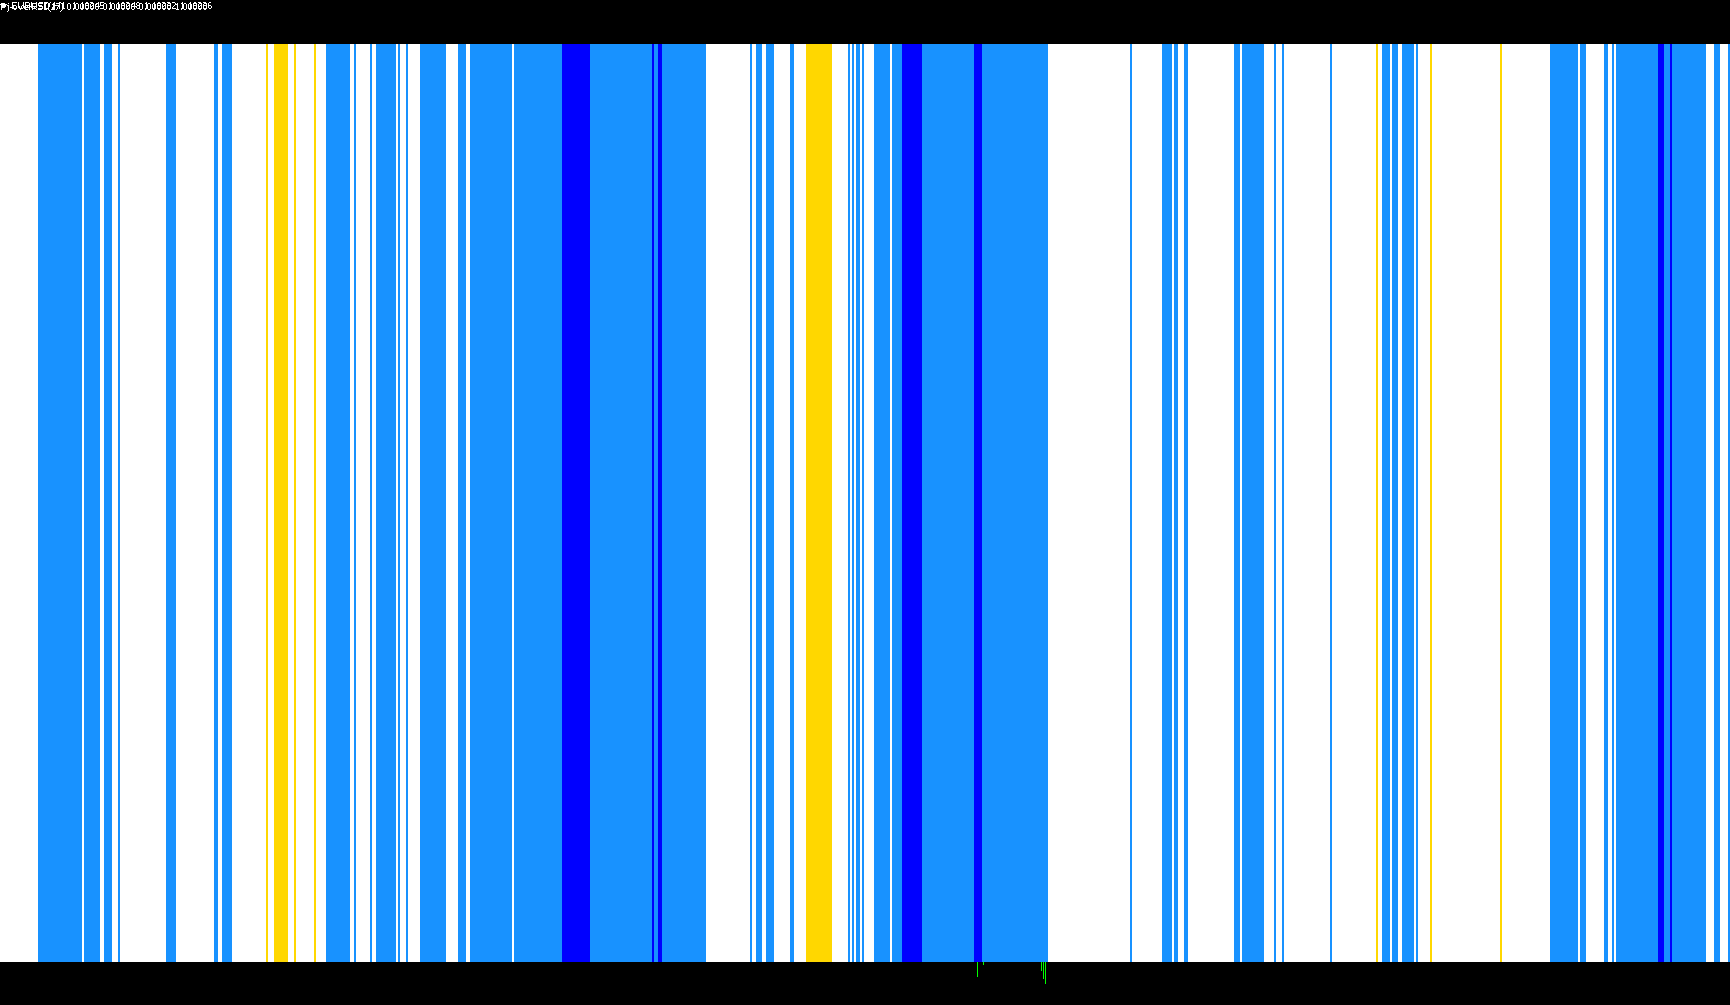
This indicator categorizes market velocity into four distinct states by mapping Relative Strength Index values to specific bullish, bearish, overbought, and oversold histogram zones.

Planet
Indicator

Planet

iMACDiMAiRSIiStochastic

This indicator identifies high-probability trend shifts by synchronizing H4 momentum filters—specifically EMA crossovers, RSI levels, and Stochastic trends—with real-time price action triggers.

PLdot
Indicator

PLdot

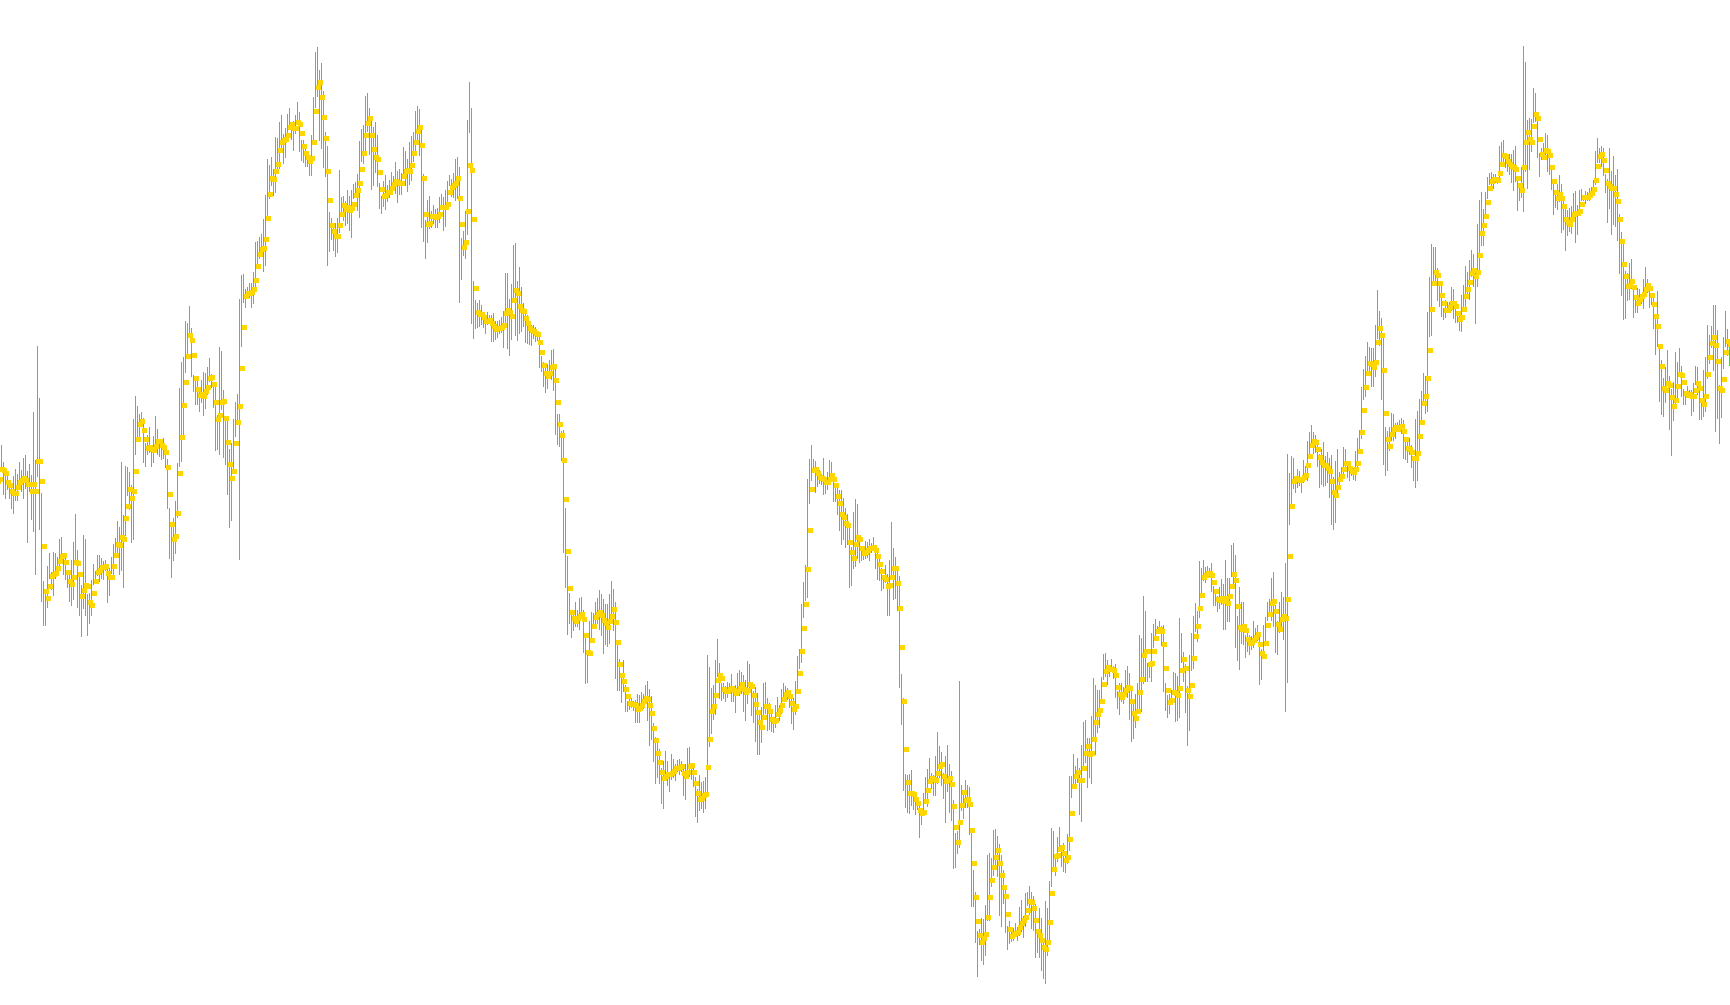
This indicator plots a visual signal based on the arithmetic average of the typical prices from the current and two preceding candles.

PLdot_v1
Indicator

PLdot_v1

This indicator plots visual markers based on the arithmetic average of three consecutive three-period pivot point calculations.

Indicator

PlotGraph

iMA
Indicator

pnn-trainer

Indicator

pnn

Indicator

pnn2-trainer

iCCI
Indicator

pnn2

Indicator

pnn3

Indicator

PNN_Iris

Indicator

PNN_parzen

Indicator

pnn_test

Indicator

pnn_train

PNN_v02
Indicator

PNN_v02

The system integrates a Support Vector Machine (SVM) architecture to train and predict market behaviors by processing price action data into external model files.

Indicator

pnn_verify3

Indicator

pnn_verify5

pOH
Indicator

pOH

This indicator plots a sequential toggle between closing and opening prices at a fixed historical offset to visualize price polarity.

Polarized Fractal Efficiency
Indicator

Polarized Fractal Efficiency

The indicator quantifies price movement velocity by calculating the geometric distance of a primary trend vector against the cumulative sum of incremental price steps over a defined period.

Polarized_Fractal_Efficiency
Indicator

Polarized_Fractal_Efficiency

iMAOnArray

Quantifies market momentum by comparing the hypotenuse of a macro price displacement against the cumulative sum of micro-price fluctuations.

PowerTrend
Indicator

PowerTrend

iMA

This indicator calculates directional momentum by extracting and comparing specific weighted price offsets from a cumulative moving average summation.

PPO
Indicator

PPO

iMAiMAOnArray

This indicator quantifies price velocity by calculating the percentage difference between two exponential moving averages relative to the slower trend line.

PPO_v2
Indicator

PPO_v2

iMAiMAOnArray

This indicator quantifies price velocity by calculating the percentage difference between two exponential moving averages relative to their slower component.
PP_4TimeFrames_Changed
Indicator

PP_4TimeFrames_Changed

This indicator projects synchronized daily, weekly, and monthly pivot levels along with intermediate midpoints and secondary support/resistance zones for comprehensive structural analysis.

Indicator

precentualzz_victor-mtf

iATR
precentualzz_victor
Indicator

precentualzz_victor

This indicator identifies structural trend shifts by plotting directional signals when the average bar price deviates from a dynamically escalating baseline by a user-defined percentage threshold.

precentualzz_victor30
Indicator

precentualzz_victor30

Identifies structural trend reversals by detecting price deviations exceeding a cumulative percentage threshold based on average bar equilibrium.

precentualzz_victor_001
Indicator

precentualzz_victor_001

This indicator identifies structural trend pivots by monitoring price deviations from a dynamic, compounding benchmark based on the arithmetic mean of price extremes.

Predict
Indicator

Predict

This indicator identifies trend reversals and flat zones by calculating the relative variance between a dual-point moving average and a five-point moving average normalized against price volatility.

Predictive_Price_FPI
Indicator

Predictive_Price_FPI

This algorithm identifies and plots theoretical price levels by calculating the mathematical equilibrium points of currency triads to detect triangular arbitrage opportunities.

Predictive_Price_FPIv2.2
Indicator

Predictive_Price_FPIv2.2

This tool calculates the equilibrium price levels of specific currency trios by computing a rolling average of their relative market weightings and plotting them as dynamic horizontal support lines.

Predictive_Price_FPIv2
Indicator

Predictive_Price_FPIv2

This algorithm calculates a dynamic equilibrium level by evaluating the geometric reciprocal product of predefined currency triplets to identify price saturation points.

Predictive_Price_FPIv2_001
Indicator

Predictive_Price_FPIv2_001

Identifies and plots synthetic price equilibrium levels by calculating the inverse product relationship between three interconnected currency pairs.

PredictPrice
Indicator

PredictPrice

This indicator calculates a predictive price value based on the variance between short-term and long-term price averages to identify directional exhaustion points.

PredictPriceHist
Indicator

PredictPriceHist

This indicator calculates a predictive price value by measuring the variance between short-term and long-term moving averages to identify trend reversals and momentum shifts.

Predict_v1
Indicator

Predict_v1

This indicator identifies trend shifts by calculating the percentage variance between short-term and medium-term average price nodes to trigger directional signals.

Predict_v2
Indicator

Predict_v2

This indicator identifies directional shifts by calculating the percentage variance between two distinct moving average clusters and filtering for specific momentum thresholds.

Pretty_t3_LK_V1.2
Indicator

Pretty_t3_LK_V1.2

iATRiMA

This indicator calculates a high-order smoothing moving average using the Tim Tillson T3 algorithm, augmented by an Inverse Fisher Transform of the rate of change normalized by ATR to determine dynamic trend momentum.

Pretty_t3_LK_V1.3
Indicator

Pretty_t3_LK_V1.3

iATRiMA

This indicator calculates a high-order smoothed moving average using the Tillson T3 algorithm combined with a Fisher Transform filter to visualize trend velocity and momentum intensity via dynamic color shifting.

Pretty_T3_RSI_LK_V1.0
Indicator

Pretty_T3_RSI_LK_V1.0

iRSI

This indicator calculates a smoothed momentum signal by applying the T3 moving average algorithm to a centered Relative Strength Index, complemented by an Inverse Fisher Transform trend filter.

Pretty_T3_RSI_LK_V1.1
Indicator

Pretty_T3_RSI_LK_V1.1

iRSI

This indicator applies a triple exponential moving average (T3) smoothing algorithm to the Relative Strength Index (RSI) to identify momentum trends with reduced lag and dynamic color-coded visual feedback.

PrevDay-HiLo-kelvin
Indicator

PrevDay-HiLo-kelvin

This indicator dynamically plots the previous day's high, low, and opening price levels as horizontal reference lines to identify structural boundaries.

PrevDay-HiLo-kelvin_v1
Indicator

PrevDay-HiLo-kelvin_v1

Plots historical daily high, low, and opening price levels to identify key liquidity pivots and session boundaries.

PrevDayAndFloatingPivot
Indicator

PrevDayAndFloatingPivot

This indicator calculates and visualizes a static pivot level derived from the previous non-Sunday trading session alongside a dynamic floating pivot based on current intraday extremes.

PrevDayAndFloatingPivot_O
Indicator

PrevDayAndFloatingPivot_O

The indicator identifies the previous day's opening price as a static pivot while calculating a real-time floating pivot based on today's intraday highs, lows, and current closing price.

PrevDayAndFloatingPivot_O_001
Indicator

PrevDayAndFloatingPivot_O_001

This indicator maps the static opening price of the previous non-Sunday trading day against a dynamic pivot level calculated using real-time intraday highs, lows, and current closing prices.

PrevDayAndFloatingPivot_v1
Indicator

PrevDayAndFloatingPivot_v1

This indicator calculates and plots a static pivot point derived from previous non-Sunday session data alongside a floating dynamic pivot updated by current intraday price extremes.

PrevDayAndFloatingPivot_v2
Indicator

PrevDayAndFloatingPivot_v2

Calculates and plots static previous-day pivot levels alongside dynamic intraday floating pivots based on current session extremes.