PrevDayHL
Indicator

PrevDayHL

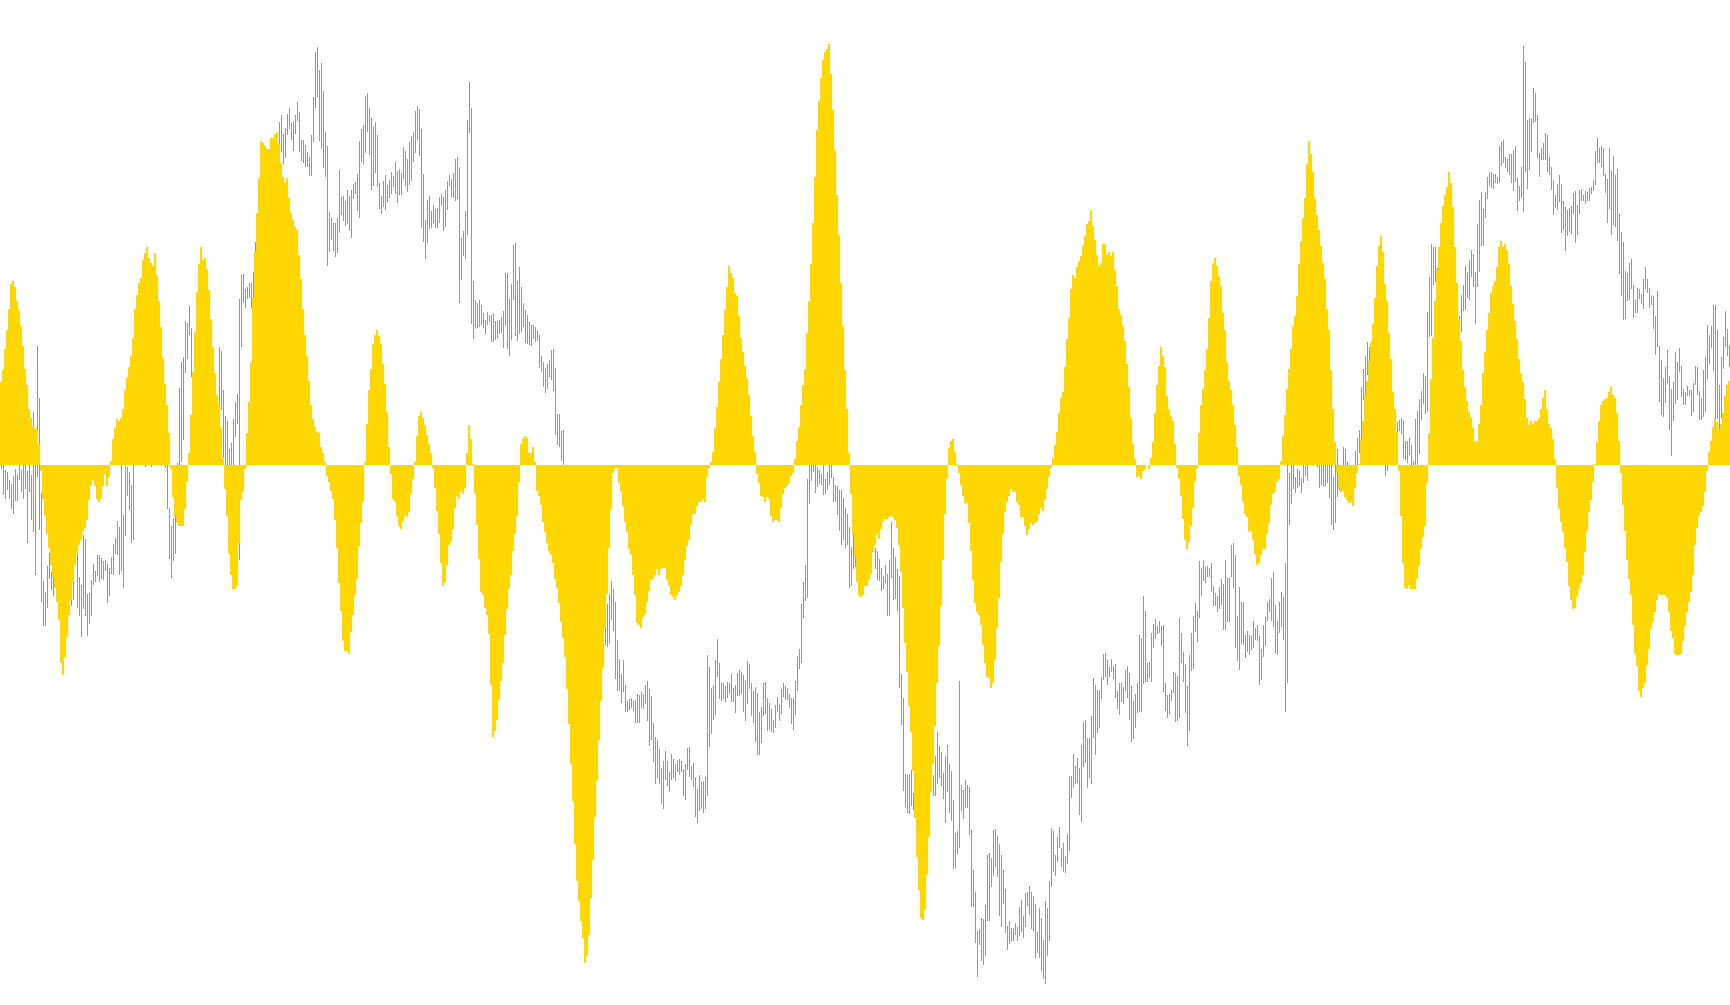
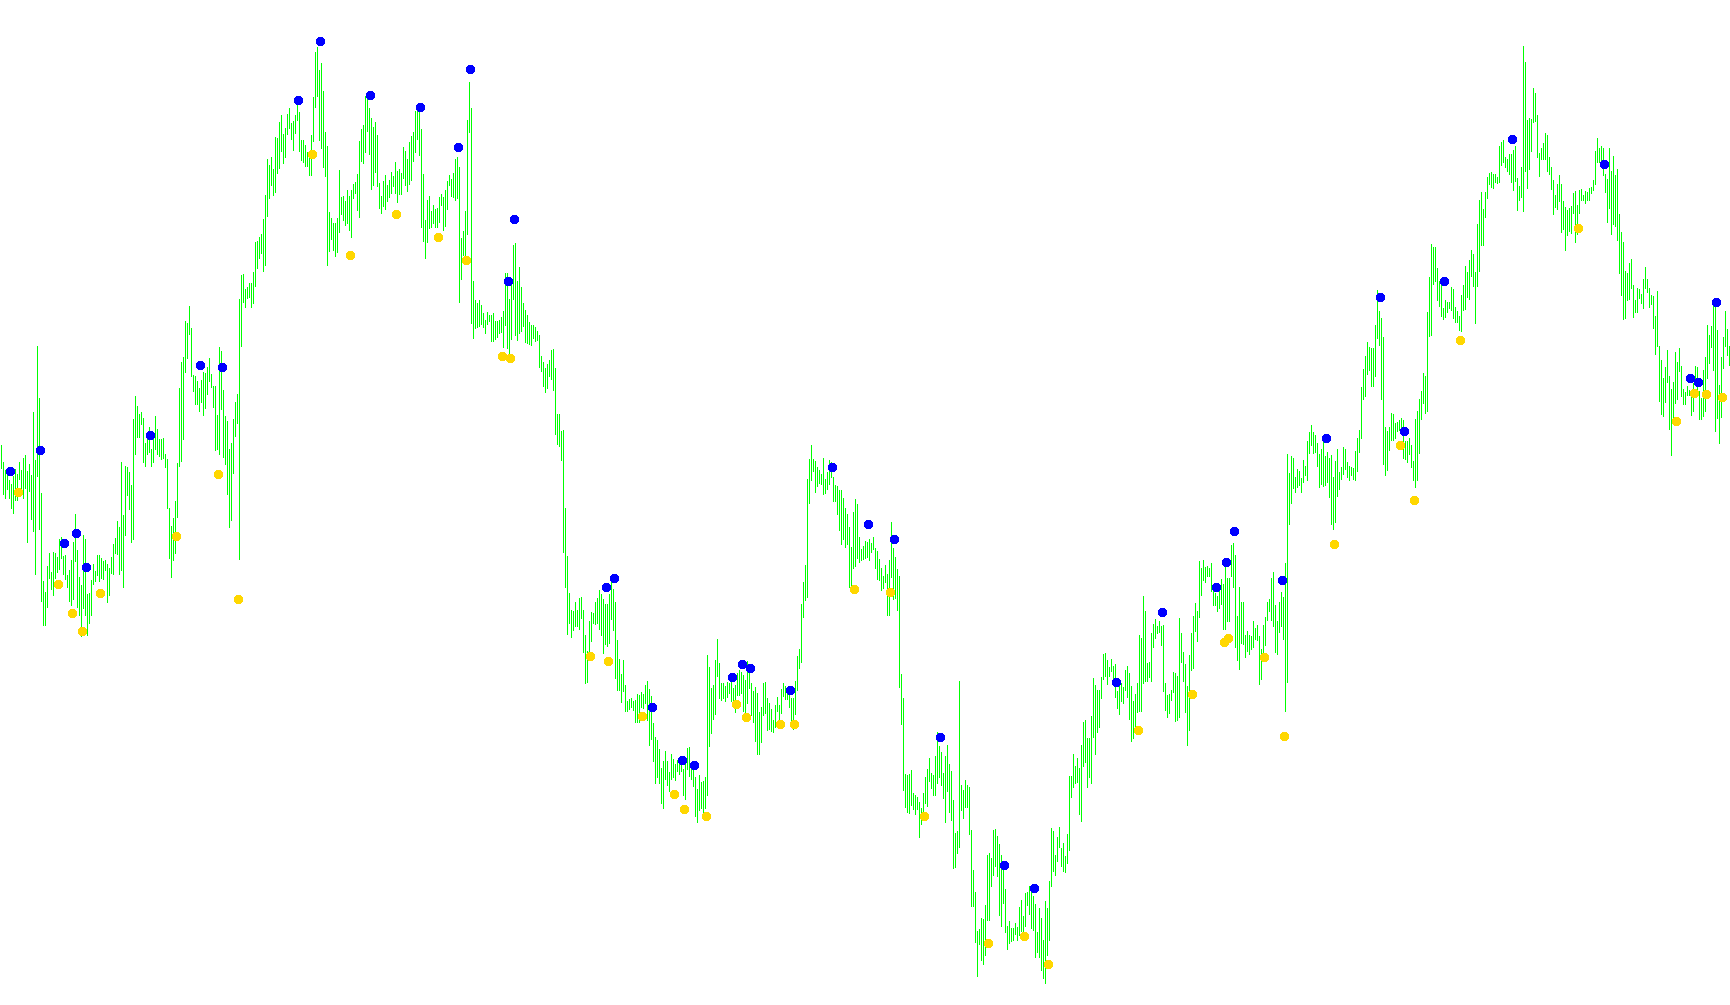
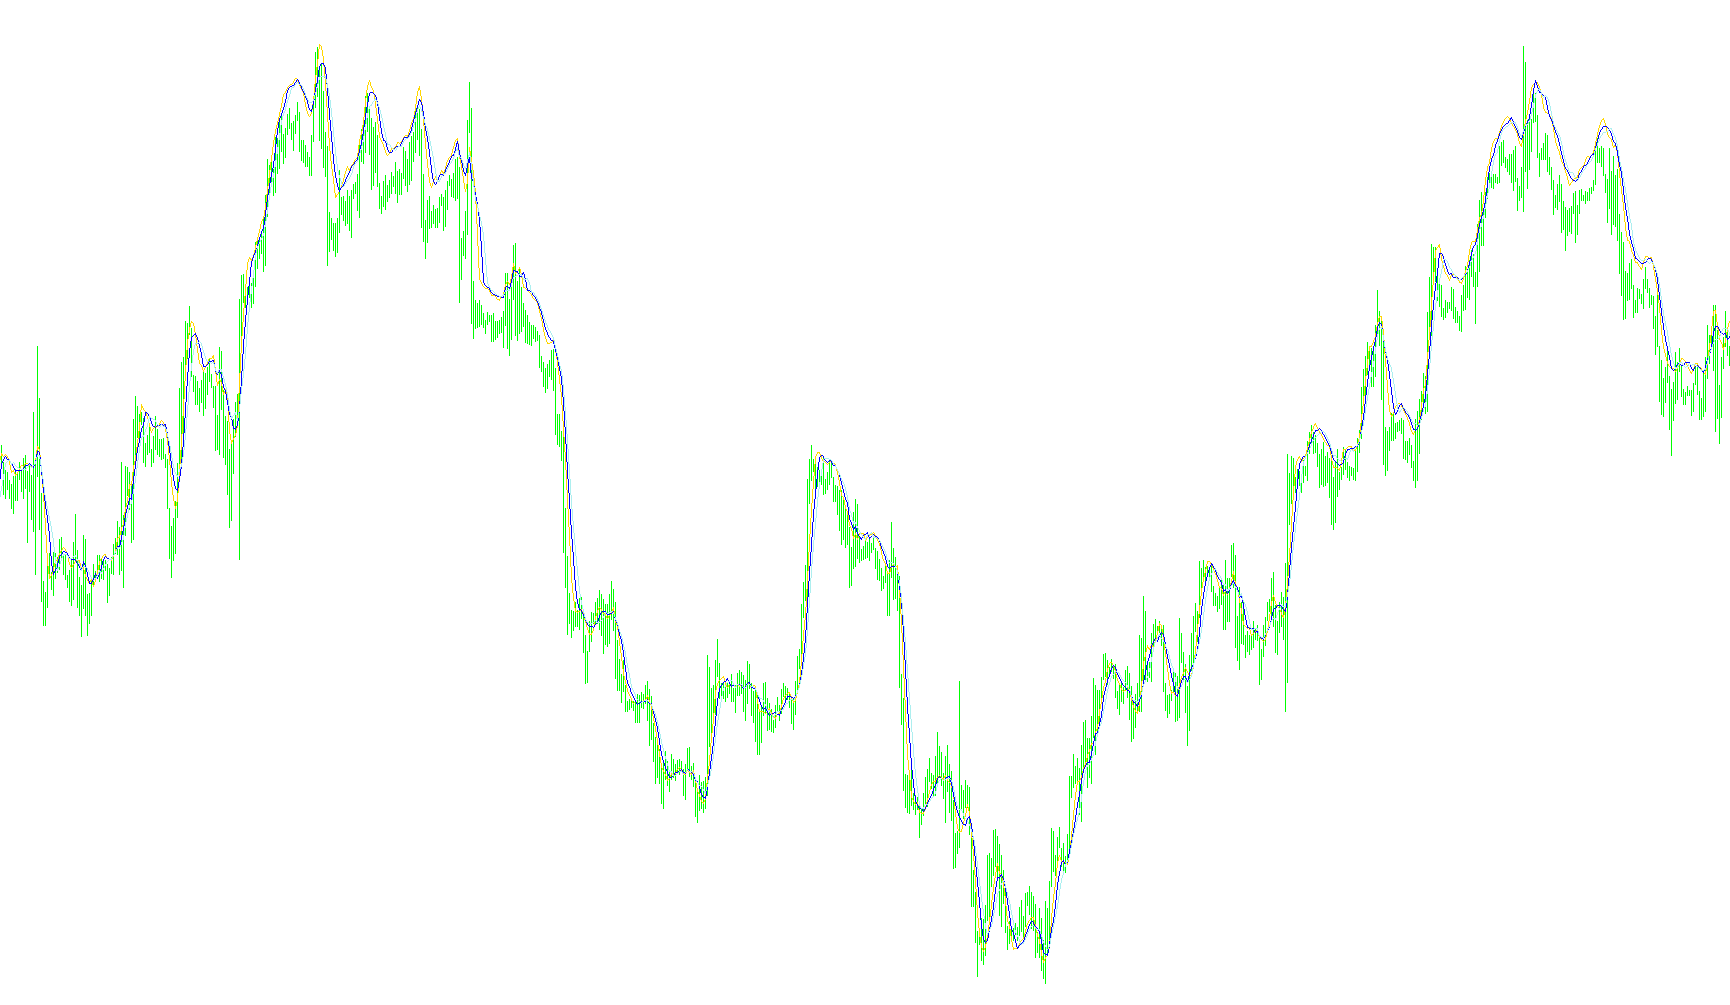
This indicator projects the historical high and low price levels from the preceding daily session onto the current chart to identify key structural pivot points.

PrevDay_HiLo_kelvin
Indicator

PrevDay_HiLo_kelvin

Identifies and projects the previous daily session's high, low, and opening price points to delineate historical volatility boundaries.

PrevDay_HiLo_kelvin_001
Indicator

PrevDay_HiLo_kelvin_001

This indicator identifies and plots the high, low, and opening price levels from the previous trading session onto the current chart to facilitate support and resistance analysis.

Price Alert(Alex)[1]
Indicator

Price Alert(Alex)[1]

This indicator triggers a notification when the current market price intersects with the vertical boundaries formed by the previous candle's high/low and the current candle's extremes.

Price Change
Indicator

Price Change

Calculates and displays the real-time price deviation from the current daily opening value with dynamic color-coded formatting.

Price Channel
Indicator

Price Channel

This indicator identifies price boundaries by calculating the extreme high and low points over a rolling period to plot upper, lower, and median volatility channels.

Indicator

Price Channel_v1

Price Channel_v2
Indicator

Price Channel_v2

Identifies localized price extrema to plot a three-tier boundary consisting of upper highs, lower lows, and a calculated median equilibrium.

Price Channel_v3
Indicator

Price Channel_v3

This indicator identifies the highest peak and lowest trough over a rolling period to project upper, lower, and median price boundaries.

Price Crosses MA
Indicator

Price Crosses MA

iMA

This indicator identifies trend reversals by detecting when price action breaches a specific pip buffer beyond the calculated moving average.

Price Data Collector
Indicator

Price Data Collector

This tool systematically iterates through a predefined array of currency pairs and timeframes to capture real-time open, high, low, and close price points.

Price Display
Indicator

Price Display

This indicator identifies intraday directional bias by evaluating the opening price relative to dynamic pivot levels derived from the previous day's high and low range.

Price Oscillator
Indicator

Price Oscillator

iMA

This indicator calculates the numerical variance between two distinct moving averages of varying periods and smoothing methods to visualize price momentum as a histogram.

Price range information
Indicator

Price range information

iCCIiMACDiRSIiStochastic

This indicator aggregates real-time data from multiple timeframes to provide a visual dashboard of MACD, RSI, Stochastic, CCI, and EMA trends simultaneously.

Price
Indicator

Price

This indicator transforms standard price action into a smoothed visual representation by calculating inverted high-low boundaries based on candle polarity.

PriceActionChanel
Indicator

PriceActionChanel

iMA

This indicator calculates upper and lower price boundaries by applying a percentage deviation to the Smoothed Moving Average of the high and low prices respectively.

PriceAlert
Indicator

PriceAlert

This indicator projects a customizable price threshold and calculates real-time pip distance while triggering audible or visual notifications upon market breach.

PriceBoxAlert
Indicator

PriceBoxAlert

The script scans for price entry into user-defined rectangular supply and demand zones to trigger real-time auditory and visual notifications.

PriceChannel_Signal_v1
Indicator

PriceChannel_Signal_v1

iATRiMA

This indicator identifies trend reversals and momentum continuations by monitoring price breaches of volatility-adjusted upper and lower boundaries based on high/low extremes.

PriceChannel_Stop_NK
Indicator

PriceChannel_Stop_NK

This indicator identifies trend reversals by calculating dynamic price channels based on historical highs and lows adjusted by a risk-weighted volatility factor.

PriceChannel_Stop_v1.2
Indicator

PriceChannel_Stop_v1.2

The indicator identifies directional shifts by monitoring price breakouts against a volatility-adjusted buffer zone derived from recent high and low extremes.

PriceChannel_Stop_v1.3
Indicator

PriceChannel_Stop_v1.3

This indicator identifies trend reversals by monitoring price breaches of a volatility-adjusted high-low range and tracking consecutive structural momentum shifts.

PriceChannel_Stop_v1
Indicator

PriceChannel_Stop_v1

This indicator identifies trend shifts by monitoring price breaches of risk-adjusted boundary zones calculated from local highs and lows.

PriceChannel_Stop_v1_001
Indicator

PriceChannel_Stop_v1_001

This indicator identifies structural trend shifts by monitoring price violations of dynamic high-low boundaries adjusted by a volatility risk percentage.

PriceChannel_Stop_v1_1_.2
Indicator

PriceChannel_Stop_v1_1_.2

The logic identifies structural momentum by detecting price breaches of volatility-adjusted channel boundaries and maintains trend persistence by locking trailing limits.

PriceChannel_Stop_v1_v1
Indicator

PriceChannel_Stop_v1_v1

This indicator identifies structural market shifts by projecting risk-adjusted price boundaries and isolating trend reversals based on price breaches of historical volatility corridors.

PriceChannel_Stop_v1_v2
Indicator

PriceChannel_Stop_v1_v2

This indicator identifies market structure by plotting trailing support and resistance boundaries based on a percentage-based risk volatility offset from the high-low range.

PriceChannel_Stop_v1_v3
Indicator

PriceChannel_Stop_v1_v3

The algorithm identifies directional shifts by calculating a risk-weighted volatility envelope and enforcing a non-reversing trailing stop based on historical extremes.

PriceChannel_Stop_v6
Indicator

PriceChannel_Stop_v6

This indicator identifies trend direction by detecting price breakouts beyond a risk-weighted corridor and projects trailing stop levels based on structural volatility.

PriceChannel_Stop_v6i
Indicator

PriceChannel_Stop_v6i

This indicator identifies trend reversals by detecting price breakouts relative to a risk-adjusted volatility channel and enforces trailing stop-loss boundaries.

PriceCounter
Indicator

PriceCounter

iMA

This indicator renders a real-time visual display of the current Exponential Moving Average price and an incrementing tick counter directly on the chart workspace.

PriceInfo
Indicator

PriceInfo

iMA

A comprehensive on-chart dashboard that visualizes real-time spread, pip variance from open, and a multi-period daily average range for precise volatility monitoring.

PriceInfo2
Indicator

PriceInfo2

iMA

This indicator calculates and displays real-time daily statistics, including average price range volatility over multiple lookback periods, current spread, and price progression from the session open.

PriceInfo2_1
Indicator

PriceInfo2_1

iMA

This indicator projects a real-time multi-metric overlay that calculates daily price excursions, average volatility benchmarks, and live spread tracking to visualize market range dynamics.

PriceLine_Ron_v01
Indicator

PriceLine_Ron_v01

This indicator projects the product of closing prices and trading volume over a historical range to visualize liquidity-adjusted price movement in a separate window.

PriceTrend
Indicator

PriceTrend

iMA

This indicator synthesizes multi-timeframe price actions with dual moving average crossovers to visualize structural momentum shifts.

PriceTrend1
Indicator

PriceTrend1

iMA

This indicator identifies multi-layered market direction by analyzing the relative positioning of price action against two distinct moving average hierarchies to signal primary and secondary trend shifts.

PriceTrend1A
Indicator

PriceTrend1A

iMA

This indicator analyzes market sentiment by comparing multi-timeframe price action against two distinct moving average layers to identify primary and secondary trend shifts.

PriceTrend1x2
Indicator

PriceTrend1x2

iMA

This indicator analyzes price action across three distinct timeframes using nested moving averages to identify synchronized bullish or bearish trend shifts.

PriceTrend1_001
Indicator

PriceTrend1_001

iMA

This indicator identifies directional bias by analyzing the relative positioning of price action against two distinct moving average layers to distinguish between primary trends and micro-fluctuations.

PriceTrender
Indicator

PriceTrender

iMA

This indicator maps smoothed moving average dynamics from a higher timeframe onto the current chart using dynamic price point selection.

PriceTrender2
Indicator

PriceTrender2

iMA

This indicator synchronizes multi-timeframe price action with dual moving average smoothing to visualize momentum shifts across varying temporalities.

PriceTrender2Alert
Indicator

PriceTrender2Alert

iMA

This indicator detects dynamic crossovers between customizable moving averages and specific price points across higher timeframes to trigger real-time alerts.

PriceTrender2KbarShift_cw
Indicator

PriceTrender2KbarShift_cw

iMA

This indicator synthesizes higher timeframe price data and dual moving average smoothing to visualize structural trends across different temporal scales.

PriceTrender2KbarShift_sw
Indicator

PriceTrender2KbarShift_sw

iMA

This indicator synchronizes price action and dual moving average crossovers across higher timeframes to visualize structural momentum.

PriceTrender2KbarShift_sw_v1
Indicator

PriceTrender2KbarShift_sw_v1

iMA

This indicator synchronizes multi-timeframe price data with dual moving average filters to visualize overarching trend dynamics across disparate temporalities.

PriceTrender2_v1
Indicator

PriceTrender2_v1

iMA
PriceTrenderChartTest
Indicator

PriceTrenderChartTest

iMA

This indicator identifies trend reversals by monitoring the crossover of a customizable price point against a Simple Moving Average across synchronized higher timeframes.

PriceTrend_001
Indicator

PriceTrend_001

iMA

This indicator projects multi-timeframe price action and dual moving average convergence onto a synchronized sub-window to visualize trend dynamics across disparate temporalities.

Price_BarsM2_MTF
Indicator

Price_BarsM2_MTF

This indicator overlays the Open, High, Low, and Close price data from a higher timeframe onto the current chart to visualize structural price boundaries.