Pivot-Calculator_002
Download script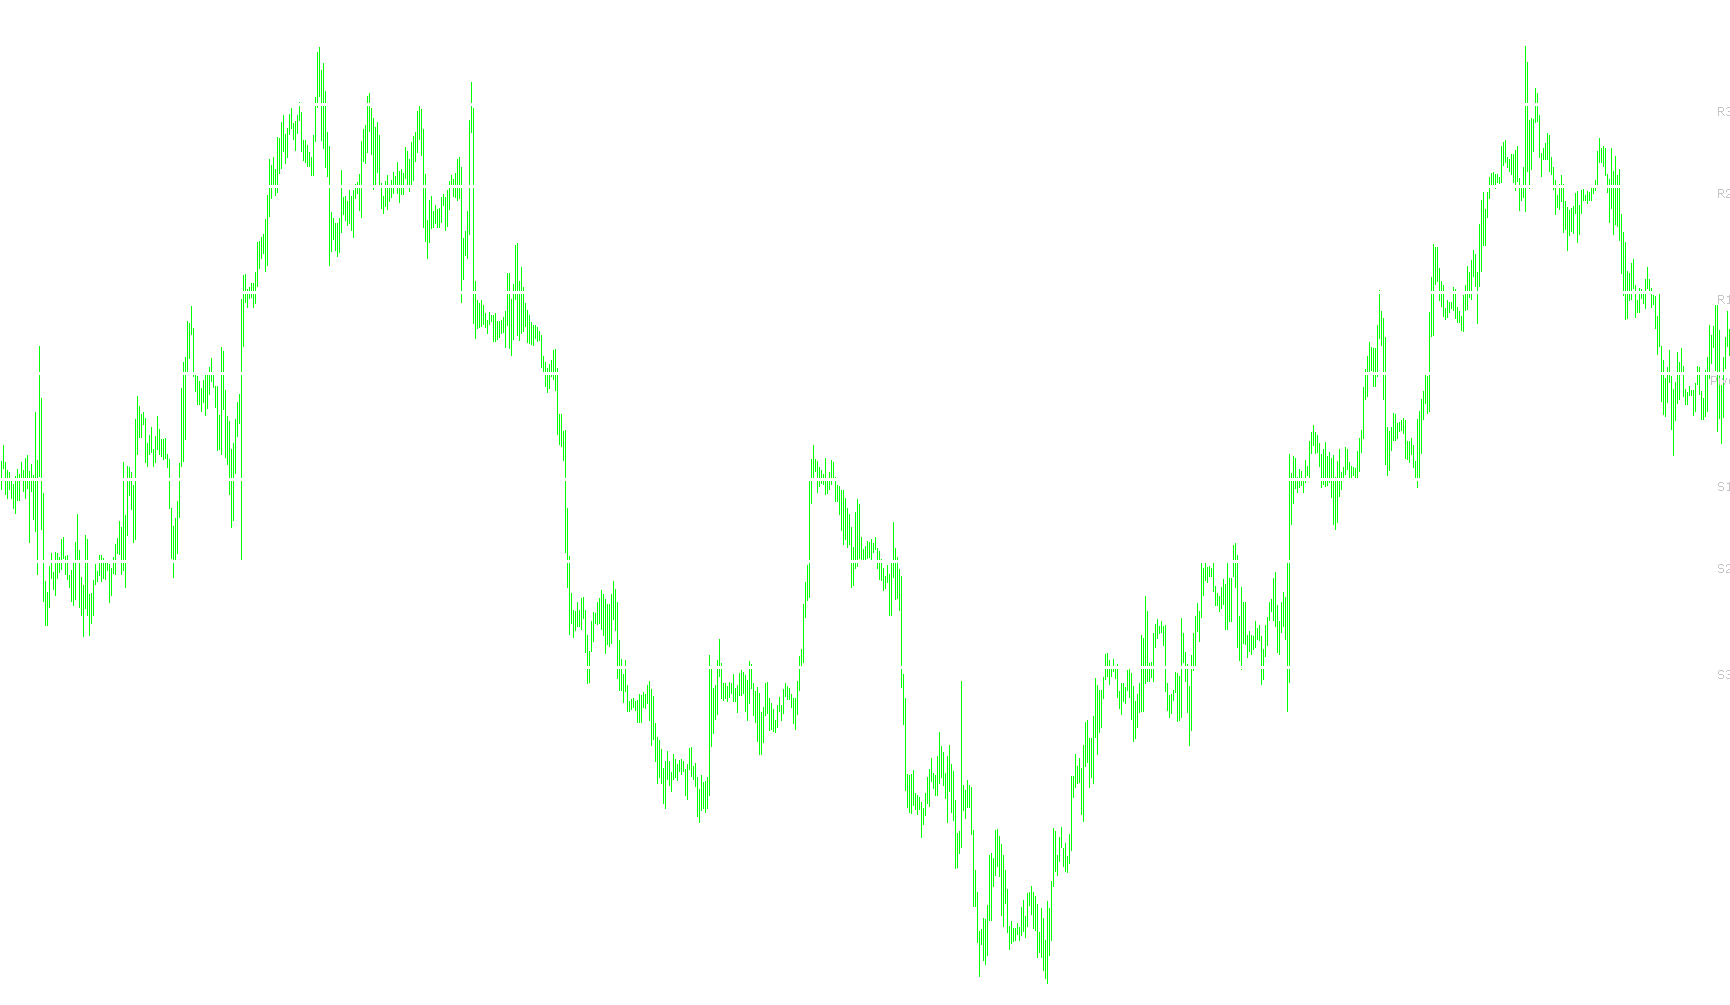
This script is designed to automatically identify and display key price levels—specifically Pivot Points, Support lines, and Resistance lines—directly on your trading chart. By automating these calculations, it provides a visual roadmap of potential areas where the market might face pressure or experience a reversal based on previous price action.
Core Functionality
The logic follows a structured process to translate historical data into real-time visual markers:
1. Data Retrieval and History Analysis The script begins by analyzing historical price movement. It specifically looks for the high, low, and closing prices of the previous trading session. To ensure accuracy, it includes intelligent handling for weekends; if the current day is Monday, the script is designed to "look back" to find the last completed Friday session rather than attempting to calculate based on a non-existent Sunday market.
2. The Pivot Calculation Logic Once the script has identified the previous session's key data points, it applies a standard mathematical formula to generate seven distinct levels:
- The Pivot (P): This is the central equilibrium point, calculated by taking the average of the previous day's high, low, and closing prices.
- Resistance Levels (R1, R2, R3): These represent "ceilings." They are calculated as price targets above the Pivot point where selling pressure may increase.
- Support Levels (S1, S2, S3): These represent "floors." They are calculated as price targets below the Pivot point where buying interest might strengthen.
3. Dynamic Visual Mapping Instead of just providing numbers in a list, the script actively draws these levels on your chart:
- Automatic Drawing: It creates horizontal lines for all seven levels (Pivot, R1-R3, and S1-S3).
- Real-Time Updates: The script constantly refreshes these lines to ensure they remain accurate as new data is processed.
- Clear Labeling: Each line is accompanied by a text label (e.g., "R1", "Pivot", "S2"), making it easy for a trader to identify exactly which price level they are looking at without having to guess.
Summary for the User
In simple terms, this tool acts as an automated technical analyst. It looks at what happened in the past market session, calculates where the "balance points" and "boundaries" should be for the current session, and draws them clearly on your screen. This allows you to see potential trade zones at a glance without performing any manual calculations.
//+------------------------------------------------------------------+
//|           Included is the PRICE based Pivot calculator           |
//|                (Daily Pivot,R1,R2,R3 & S1,S2,S3)                 |
//|                                                                  |
//|                                 Email: Xard777@connectfree.co.uk |
//+------------------------------------------------------------------+
#property copyright ""
#property link      ""
#property indicator_chart_window


extern int P = 5; //How many days back /0 = curr day/ 1 = yesterday/ 2= 2days ago

//---- input parameters ----
int fontsize = 10;
double LastHigh, LastLow, x;

//+------------------------------------------------------------------+
//| Custor indicator deinitialization function                       |
//+------------------------------------------------------------------+
int deinit()
  {
  ObjectsDeleteAll();
//----
   return(0);
  }
//+------------------------------------------------------------------+
//| Custom indicator initialization function                         |
//+------------------------------------------------------------------+
int init()
  {


//---- Name for DataWindow and indicator subwindow label
   IndicatorShortName("XA");
   SetIndexDrawBegin(0,1);
   IndicatorDigits(MarketInfo(Symbol(),MODE_DIGITS));

   return(0);
  }

//+------------------------------------------------------------------+
//| Custom indicator iteration function                              |
//+------------------------------------------------------------------+
int start()
{

  //{
   int counted_bars = IndicatorCounted();
   int limit, i;

//---- Indicator Calculation ----
   if(counted_bars == 0)
     {
       x = Period();
       if(x > 240)
           return(-1);
     }
   if(counted_bars < 0)
       return(-1);
   //---- last counted bar will be recounted
   //   if(counted_bars>0) counted_bars--;
      limit = (Bars - counted_bars) - 1;
//----
   for(i = limit; i >= 0; i--)
     {
       if(High[i+1] > LastHigh)
           LastHigh = High[i+1];
       //----
       if(Low[i+1] < LastLow)
           LastLow=Low[i+1];
       if(TimeDay(Time[i]) != TimeDay(Time[i+1]))
         {

           LastLow = Open[i];
           LastHigh = Open[i];

         }

//---- Pivot Setup ----
double rates[1][6],yesterday_volume,yesterday_close,yesterday_high,yesterday_low,yesterday_open;
ArrayCopyRates(rates, Symbol(), PERIOD_D1);

if(DayOfWeek() == 1)
{
   if(TimeDayOfWeek(iTime(Symbol(),PERIOD_D1,1)) == 5)
   {
       yesterday_volume = rates[1][5];
       yesterday_close = rates[1][4];
       yesterday_high = rates[1][3];
       yesterday_low = rates[1][2];
       yesterday_open = rates[1][1];

   }
   else
   {
      for(int d = 5;d>=0;d--)
      {
         if(TimeDayOfWeek(iTime(Symbol(),PERIOD_D1,d)) == 5)
         {
             yesterday_volume = rates[d][5];
             yesterday_close = rates[d][4];
             yesterday_high = rates[d][3];
             yesterday_low = rates[d][2];
             yesterday_open = rates[d][1];
         }

      }

   }
}
else
{
    yesterday_close = rates[1][4];
    yesterday_high = rates[1][3];
    yesterday_low = rates[1][2];
    yesterday_open = rates[1][1];
}

//---- Calculate Pivots ----
double R = yesterday_high - yesterday_low;//range
double p = (yesterday_high + yesterday_low + yesterday_close)/3;// Standard Pivot
double r3 = (2*p)+(yesterday_high-(2*yesterday_low));// Resistance 3
double r2 = p+(yesterday_high - yesterday_low);// Resistance point 2
double r1 = (2*p)-yesterday_low;// Resistance point 1
double s1 = (2*p)-yesterday_high;// Support point 1
double s2 = p-(yesterday_high - yesterday_low);// Support point 2
double s3 = (2*p)-((2* yesterday_high)-yesterday_low);// Support point 3

//Pivot, Support & Resistance Lines
ObjectDelete("p_Line");
ObjectCreate("p_Line", OBJ_HLINE,0, CurTime(),p);
ObjectSet("p_Line",OBJPROP_COLOR,Black);
ObjectSet("p_Line",OBJPROP_STYLE,STYLE_SOLID);
ObjectSet("p_Line",OBJPROP_WIDTH,3);

ObjectDelete("r1_Line");
ObjectCreate("r1_Line", OBJ_HLINE,0, CurTime(),r1);
ObjectSet("r1_Line",OBJPROP_COLOR,Black);
ObjectSet("r1_Line",OBJPROP_STYLE,STYLE_SOLID);
ObjectSet("r1_Line",OBJPROP_WIDTH,3);

ObjectDelete("r2_Line");
ObjectCreate("r2_Line", OBJ_HLINE,0, CurTime(),r2);
ObjectSet("r2_Line",OBJPROP_COLOR,Black);
ObjectSet("r2_Line",OBJPROP_STYLE,STYLE_SOLID);
ObjectSet("r2_Line",OBJPROP_WIDTH,3);

ObjectDelete("r3_Line");
ObjectCreate("r3_Line", OBJ_HLINE,0, CurTime(),r3);
ObjectSet("r3_Line",OBJPROP_COLOR,Black);
ObjectSet("r3_Line",OBJPROP_STYLE,STYLE_SOLID);
ObjectSet("r3_Line",OBJPROP_WIDTH,3);

ObjectDelete("s1_Line");
ObjectCreate("s1_Line", OBJ_HLINE,0, CurTime(),s1);
ObjectSet("s1_Line",OBJPROP_COLOR,Black);
ObjectSet("s1_Line",OBJPROP_STYLE,STYLE_SOLID);
ObjectSet("s1_Line",OBJPROP_WIDTH,3);

ObjectDelete("s2_Line");
ObjectCreate("s2_Line", OBJ_HLINE,0, CurTime(),s2);
ObjectSet("s2_Line",OBJPROP_COLOR,Black);
ObjectSet("s2_Line",OBJPROP_STYLE,STYLE_SOLID);
ObjectSet("s2_Line",OBJPROP_WIDTH,3);

ObjectDelete("s3_Line");
ObjectCreate("s3_Line", OBJ_HLINE,0, CurTime(),s3);
ObjectSet("s3_Line",OBJPROP_COLOR,Black);
ObjectSet("s3_Line",OBJPROP_STYLE,STYLE_SOLID);
ObjectSet("s3_Line",OBJPROP_WIDTH,3);

ObjectsRedraw();

// ---- Typing Labels ----

//R3 Label
if(ObjectFind("R3 label") != 0)
{
ObjectCreate("R3 label", OBJ_TEXT, 0, Time[3], r3);
ObjectSetText("R3 label", " R3 ", 9, "Verdana", Silver);
}
else
{
ObjectMove("R3 label", 0, Time[3], r3);
}

//S3 Label
if(ObjectFind("S3 label") != 0)
{
ObjectCreate("S3 label", OBJ_TEXT, 0, Time[3], s3);
ObjectSetText("S3 label", " S3 ", 9, "Verdana", Silver);
}
else
{
ObjectMove("S3 label", 0, Time[3], s3);
}

//R2 Label
if(ObjectFind("R2 label") != 0)
{
ObjectCreate("R2 label", OBJ_TEXT, 0, Time[3], r2);
ObjectSetText("R2 label", " R2 ", 9, "Verdana", Silver);
}
else
{
ObjectMove("R2 label", 0, Time[3], r2);
}

//S2 Label
if(ObjectFind("S2 label") != 0)
{
ObjectCreate("S2 label", OBJ_TEXT, 0, Time[3], s2);
ObjectSetText("S2 label", " S2 ", 9, "Verdana", Silver);
}
else
{
ObjectMove("S2 label", 0, Time[3], s2);
}

//R1 Label
if(ObjectFind("R1 label") != 0)
{
ObjectCreate("R1 label", OBJ_TEXT, 0, Time[3], r1);
ObjectSetText("R1 label", " R1 ", 9, "Verdana", Silver);
}
else
{
ObjectMove("R1 label", 0, Time[3], r1);
}

//S1 Label
if(ObjectFind("S1 label") != 0)
{
ObjectCreate("S1 label", OBJ_TEXT, 0, Time[3], s1);
ObjectSetText("S1 label", " S1 ", 9, "Verdana", Silver);
}
else
{
ObjectMove("S1 label", 0, Time[3], s1);
}

//Pivot Label
if(ObjectFind("P label") != 0)
{
ObjectCreate("P label", OBJ_TEXT, 0, Time[3], p);
ObjectSetText("P label", " Pivot ", 9, "Verdana", Silver);
}
else
{
ObjectMove("P label", 0, Time[3], p);
}

Comment("Pivot Calculator ");

}

   return(0);

  }
//Job Done
//+------------------------------------------------------------------+
Comments