Pivot-point
Download script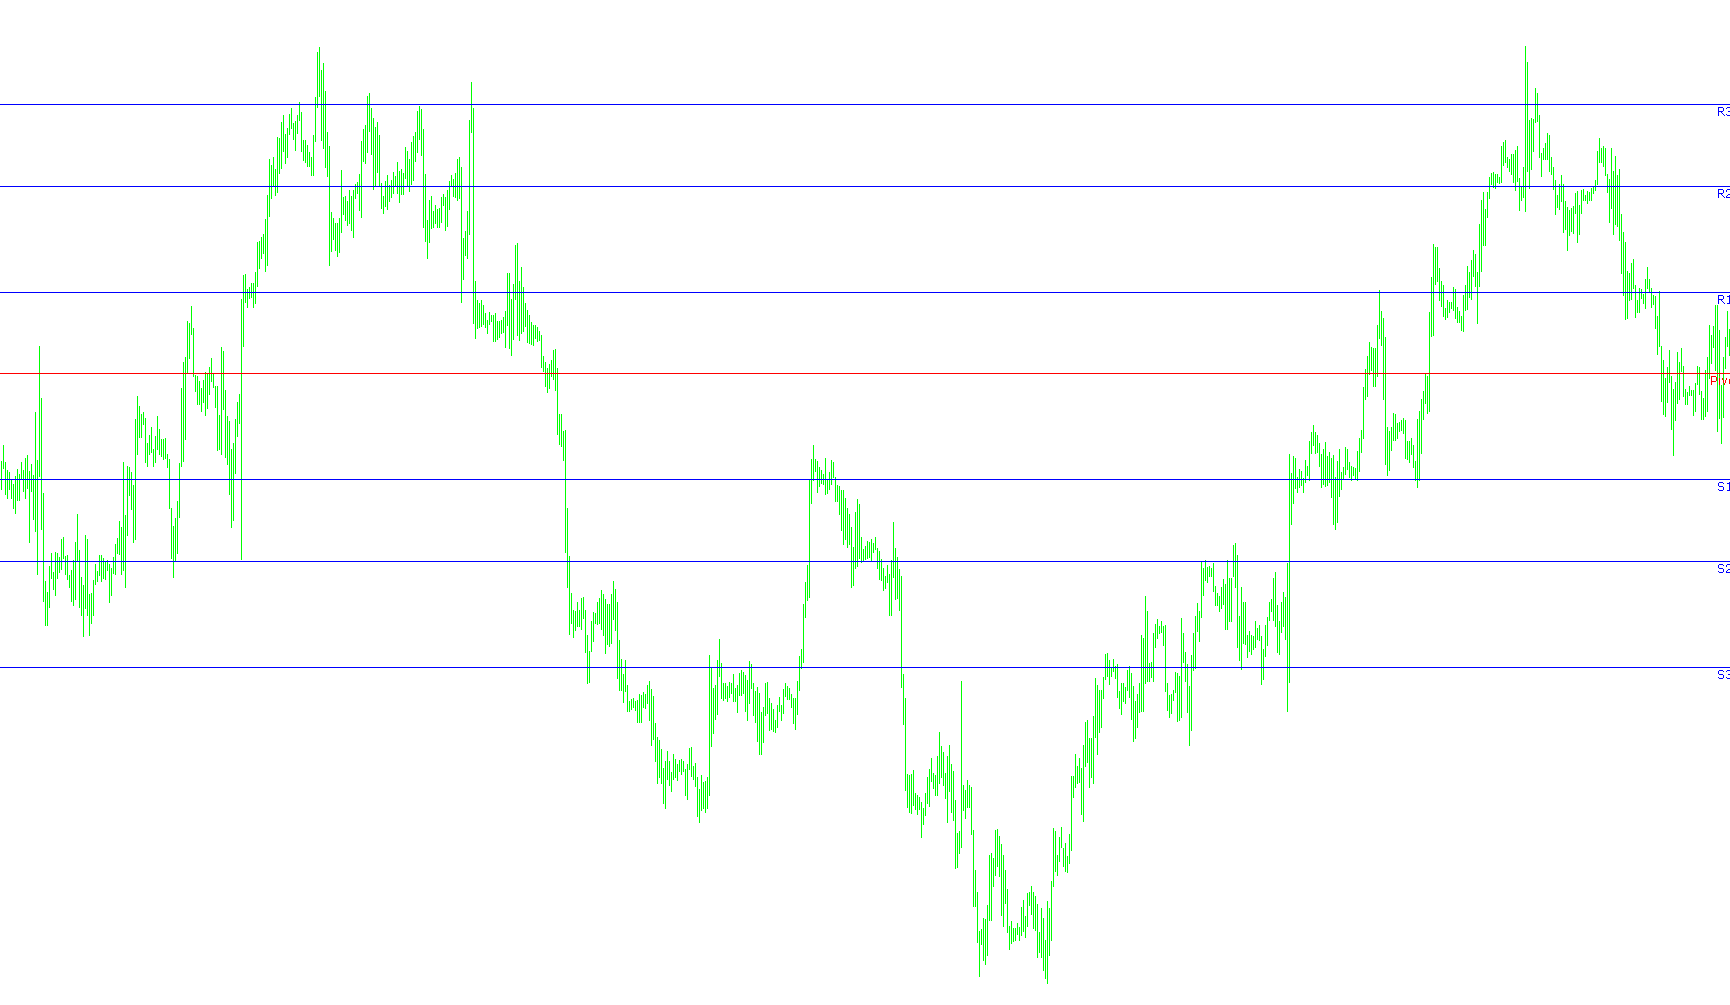
This script is a technical analysis tool designed for the MetaTrader platform to automatically identify and display key price levels on a trading chart. Its primary purpose is to calculate "Pivot Points," which are used by traders to determine potential support and resistance levels where the price might encounter difficulty moving higher or lower.
Core Functionality
The script focuses on historical price action to project future price boundaries. It specifically looks at the daily high, low, and closing prices of previous trading sessions to generate a structured grid of levels:
- Pivot Point (P): The central equilibrium price for the current period.
- Resistance Levels (R1, R2, R3): These represent upper boundaries where the price may face selling pressure.
- Support Levels (S1, S2, S3): These represent lower boundaries where the price may find buying interest.
Technical Logic & Workflow
The script follows a specific logical sequence to ensure accuracy:
1. Historical Data Retrieval The tool automatically scans the daily timeframe to gather data from the previous trading day. It is designed with "weekend awareness," meaning if it detects that the previous market day was a Friday (or a weekend), it intelligently looks back further to find the most recent completed Friday session. This prevents calculation errors caused by non-trading days.
2. Mathematical Calculation Once the previous day's High, Low, and Close are identified, the script applies standard financial formulas:
- The Pivot Point is calculated as the average of the previous day's high, low, and close.
- The Resistance and Support levels are then derived by applying multipliers to that Pivot Point and the difference between the previous day's high and low (the "range").
3. Visual Representation After performing the calculations, the script handles the visual output on your chart:
- Dynamic Lines: It draws horizontal lines across the chart for each calculated level. The Pivot line is typically highlighted in Red, while Support and Resistance levels are shown in Blue.
- Text Labels: To ensure clarity, the script places text labels (e.g., "R1", "S2", "Pivot") directly on the lines so you can immediately identify which level is which without having to guess.
- Auto-Cleanup: The script includes a self-cleaning routine; when removed from the chart, it automatically deletes all drawn lines and labels to keep your workspace tidy.
User Experience
From a user perspective, this tool automates the tedious math of "Pivot Point" trading. Instead of manually calculating price ranges every morning, the script provides an immediate visual map of where institutional support and resistance are expected to sit based on recent market history.
//+------------------------------------------------------------------+
//|           Included is the PRICE based Pivot calculator           |
//|                (Daily Pivot,R1,R2,R3 & S1,S2,S3)                 |
//|                                                                  |
//|                                 Email: Xard777@connectfree.co.uk |
//+------------------------------------------------------------------+
#property copyright ""
#property link      ""
#property indicator_chart_window


extern int P = 5; //How many days back /0 = curr day/ 1 = yesterday/ 2= 2days ago
extern bool DrawLine=true;

//---- input parameters ----
int fontsize = 10;
double LastHigh, LastLow, x;

//+------------------------------------------------------------------+
//| Custor indicator deinitialization function                       |
//+------------------------------------------------------------------+
int deinit()
  {
  Comment("");
  ObjectDelete("p_Line");
  ObjectDelete("r1_Line");
  ObjectDelete("r2_Line");
  ObjectDelete("r3_Line");
  ObjectDelete("s1_Line");
  ObjectDelete("s2_Line");
  ObjectDelete("s3_Line");
  ObjectDelete("P label");
  ObjectDelete("R1 label");
  ObjectDelete("R2 label");
  ObjectDelete("R3 label");
  ObjectDelete("S1 label");
  ObjectDelete("S2 label");
  ObjectDelete("S3 label");

//----
   return(0);
  }
//+------------------------------------------------------------------+
//| Custom indicator initialization function                         |
//+------------------------------------------------------------------+
int init()
  {


//---- Name for DataWindow and indicator subwindow label
   IndicatorShortName("XA");
   SetIndexDrawBegin(0,1);
   IndicatorDigits(MarketInfo(Symbol(),MODE_DIGITS));

   return(0);
  }

//+------------------------------------------------------------------+
//| Custom indicator iteration function                              |
//+------------------------------------------------------------------+
int start()
{

  //{
   int counted_bars = IndicatorCounted();
   int limit, i;

//---- Indicator Calculation ----
   if(counted_bars == 0)
     {
       x = Period();
       if(x > 240)
           return(-1);
     }
   if(counted_bars < 0)
       return(-1);
   //---- last counted bar will be recounted
   //   if(counted_bars>0) counted_bars--;
      limit = (Bars - counted_bars) - 1;
//----
   for(i = limit; i >= 0; i--)
     {
       if(High[i+1] > LastHigh)
           LastHigh = High[i+1];
       //----
       if(Low[i+1] < LastLow)
           LastLow=Low[i+1];
       if(TimeDay(Time[i]) != TimeDay(Time[i+1]))
         {

           LastLow = Open[i];
           LastHigh = Open[i];

         }

//---- Pivot Setup ----
double rates[1][6],yesterday_volume,yesterday_close,yesterday_high,yesterday_low,yesterday_open;
ArrayCopyRates(rates, Symbol(), PERIOD_D1);

if(DayOfWeek() == 1)
{
   if(TimeDayOfWeek(iTime(Symbol(),PERIOD_D1,1)) == 5)
   {
       yesterday_volume = rates[1][5];
       yesterday_close = rates[1][4];
       yesterday_high = rates[1][3];
       yesterday_low = rates[1][2];
       yesterday_open = rates[1][1];

   }
   else
   {
      for(int d = 5;d>=0;d--)
      {
         if(TimeDayOfWeek(iTime(Symbol(),PERIOD_D1,d)) == 5)
         {
             yesterday_volume = rates[d][5];
             yesterday_close = rates[d][4];
             yesterday_high = rates[d][3];
             yesterday_low = rates[d][2];
             yesterday_open = rates[d][1];
         }

      }

   }
}
else
{
    yesterday_close = rates[1][4];
    yesterday_high = rates[1][3];
    yesterday_low = rates[1][2];
    yesterday_open = rates[1][1];
}

//---- Calculate Pivots ----
double R = yesterday_high - yesterday_low;//range
double p = (yesterday_high + yesterday_low + yesterday_close)/3;// Standard Pivot
double r3 = (2*p)+(yesterday_high-(2*yesterday_low));// Resistance 3
double r2 = p+(yesterday_high - yesterday_low);// Resistance point 2
double r1 = (2*p)-yesterday_low;// Resistance point 1
double s1 = (2*p)-yesterday_high;// Support point 1
double s2 = p-(yesterday_high - yesterday_low);// Support point 2
double s3 = (2*p)-((2* yesterday_high)-yesterday_low);// Support point 3


//Pivot, Support & Resistance Lines

if (DrawLine)
{
ObjectDelete("p_Line");
ObjectCreate("p_Line", OBJ_HLINE,0, CurTime(),p);
ObjectSet("p_Line",OBJPROP_COLOR,Red);
ObjectSet("p_Line",OBJPROP_STYLE,STYLE_SOLID);
ObjectSet("p_Line",OBJPROP_WIDTH,1);

ObjectDelete("r1_Line");
ObjectCreate("r1_Line", OBJ_HLINE,0, CurTime(),r1);
ObjectSet("r1_Line",OBJPROP_COLOR,Blue);
ObjectSet("r1_Line",OBJPROP_STYLE,STYLE_SOLID);
ObjectSet("r1_Line",OBJPROP_WIDTH,1);

ObjectDelete("r2_Line");
ObjectCreate("r2_Line", OBJ_HLINE,0, CurTime(),r2);
ObjectSet("r2_Line",OBJPROP_COLOR,Blue);
ObjectSet("r2_Line",OBJPROP_STYLE,STYLE_SOLID);
ObjectSet("r2_Line",OBJPROP_WIDTH,1);

ObjectDelete("r3_Line");
ObjectCreate("r3_Line", OBJ_HLINE,0, CurTime(),r3);
ObjectSet("r3_Line",OBJPROP_COLOR,Blue);
ObjectSet("r3_Line",OBJPROP_STYLE,STYLE_SOLID);
ObjectSet("r3_Line",OBJPROP_WIDTH,1);

ObjectDelete("s1_Line");
ObjectCreate("s1_Line", OBJ_HLINE,0, CurTime(),s1);
ObjectSet("s1_Line",OBJPROP_COLOR,Blue);
ObjectSet("s1_Line",OBJPROP_STYLE,STYLE_SOLID);
ObjectSet("s1_Line",OBJPROP_WIDTH,1);

ObjectDelete("s2_Line");
ObjectCreate("s2_Line", OBJ_HLINE,0, CurTime(),s2);
ObjectSet("s2_Line",OBJPROP_COLOR,Blue);
ObjectSet("s2_Line",OBJPROP_STYLE,STYLE_SOLID);
ObjectSet("s2_Line",OBJPROP_WIDTH,1);

ObjectDelete("s3_Line");
ObjectCreate("s3_Line", OBJ_HLINE,0, CurTime(),s3);
ObjectSet("s3_Line",OBJPROP_COLOR,Blue);
ObjectSet("s3_Line",OBJPROP_STYLE,STYLE_SOLID);
ObjectSet("s3_Line",OBJPROP_WIDTH,1);

ObjectsRedraw();

// ---- Typing Labels ----

//R3 Label
if(ObjectFind("R3 label") != 0)
{
ObjectCreate("R3 label", OBJ_TEXT, 0, Time[3], r3);
ObjectSetText("R3 label", " R3 ", 9, "Verdana", Blue);
}
else
{
ObjectMove("R3 label", 0, Time[3], r3);
}

//S3 Label
if(ObjectFind("S3 label") != 0)
{
ObjectCreate("S3 label", OBJ_TEXT, 0, Time[3], s3);
ObjectSetText("S3 label", " S3 ", 9, "Verdana", Blue);
}
else
{
ObjectMove("S3 label", 0, Time[3], s3);
}

//R2 Label
if(ObjectFind("R2 label") != 0)
{
ObjectCreate("R2 label", OBJ_TEXT, 0, Time[3], r2);
ObjectSetText("R2 label", " R2 ", 9, "Verdana", Blue);
}
else
{
ObjectMove("R2 label", 0, Time[3], r2);
}

//S2 Label
if(ObjectFind("S2 label") != 0)
{
ObjectCreate("S2 label", OBJ_TEXT, 0, Time[3], s2);
ObjectSetText("S2 label", " S2 ", 9, "Verdana", Blue);
}
else
{
ObjectMove("S2 label", 0, Time[3], s2);
}

//R1 Label
if(ObjectFind("R1 label") != 0)
{
ObjectCreate("R1 label", OBJ_TEXT, 0, Time[3], r1);
ObjectSetText("R1 label", " R1 ", 9, "Verdana", Blue);
}
else
{
ObjectMove("R1 label", 0, Time[3], r1);
}

//S1 Label
if(ObjectFind("S1 label") != 0)
{
ObjectCreate("S1 label", OBJ_TEXT, 0, Time[3], s1);
ObjectSetText("S1 label", " S1 ", 9, "Verdana", Blue);
}
else
{
ObjectMove("S1 label", 0, Time[3], s1);
}

//Pivot Label
if(ObjectFind("P label") != 0)
{
ObjectCreate("P label", OBJ_TEXT, 0, Time[3], p);
ObjectSetText("P label", " Pivot ", 9, "Verdana", Red);
}
else
{
ObjectMove("P label", 0, Time[3], p);
}


}
}
   return(0);

  }
//Job Done
//+------------------------------------------------------------------+
Comments