Pivots By MoStAsHaR15_v1
Download script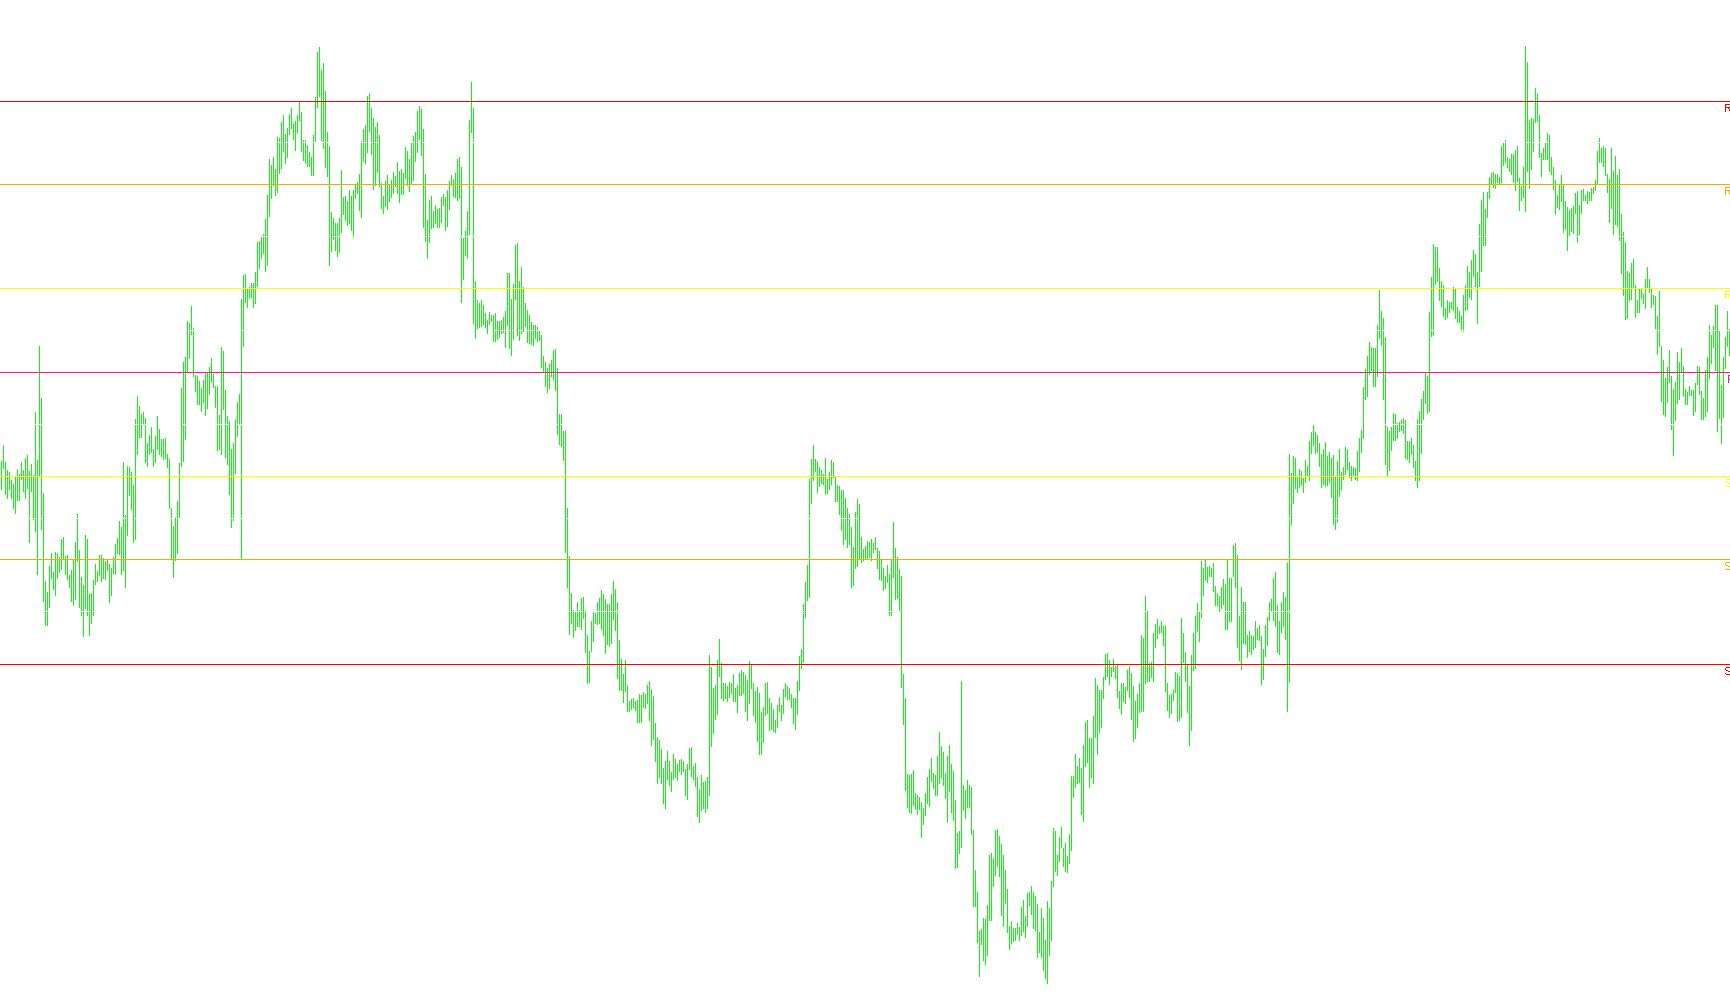
This script is designed for traders who use technical analysis to identify potential support and resistance levels on their charts. It automatically calculates and draws two distinct types of price levels—Camarilla Pivots and Standard Pivot Points—based on the previous day's trading data (high, low, and closing prices).
How the Logic Works
Data Collection and Processing The script first scans through recent historical data to identify the specific price movements from the previous trading session. It looks for three key pieces of information:
- The highest price reached (High)
- The lowest price reached (Low)
- The final price at the end of the session (Close)
It accounts for time zone differences (GMT shift) to ensure it is pulling the correct daily data regardless of your local time setting.
Calculation Methods Once the previous day's data is captured, the script performs two different sets of mathematical calculations:
- Standard Pivot Points: It establishes a "Pivot Point" (the equilibrium price) and calculates three levels of Resistance (R1, R2, R3) and three levels of Support (S1, S2, S3). These are used to identify where the price might encounter pressure or find a floor.
- Camarilla & Midpoints: Using the established Pivot Points, the script further breaks down the price action into "Midpoints." These provide more granular levels (H1–H3 and L1–L3), which help traders identify smaller fluctuations within the larger price trends.
Visual Presentation on Chart The script automates the drawing process so that you do not have to calculate these numbers manually. It performs the following actions:
- Dynamic Line Drawing: It creates horizontal lines on your chart for every calculated level. Each type of level is assigned a specific color (e.g., Red for R3, Orange for R2, Yellow for R1, and Deep Pink for the Pivot Point).
- Style Differentiation: It uses different line styles—such as solid lines for primary levels and dash-dot lines for midpoints—to help you distinguish between primary targets and secondary fluctuations at a glance.
- Automated Labeling: The script automatically places text labels (like "R1", "S2", "P") next to the lines on the right side of the chart, making it easy to identify exactly which price level you are looking at.
User Requirements To ensure accuracy, the logic includes a safety check: the script will only function correctly on timeframes smaller than one day (e.g., 1-hour, 15-minute, or 5-minute charts). If a larger timeframe is used, the script will notify you that the chart period is too high for the calculation to be valid.
/*-----------------------------+
|			       |
| Shared by www.Aptrafx.com    |
|			       |
+------------------------------*/

//+------------------------------------------------------------------+
//|                         Camarilla & Pivots                       |
//|                                                                  |
//|                                                   By MoStAsHaR15 |
//+------------------------------------------------------------------+
#property copyright "MoStAsHaR15 © 2005"
#property link      "http://www.mostashar15.com"

#property indicator_chart_window
//---- input parameters
extern int       GMTshift=2;
//+------------------------------------------------------------------+
//| Custom indicator initialization function                         |
//+------------------------------------------------------------------+
int init()
  {
//---- indicators
//----
   return(0);
  }
//+------------------------------------------------------------------+
//| Custor indicator deinitialization function                       |
//+------------------------------------------------------------------+
int deinit()
  {
//---- TODO: add your code here

//----
   return(0);
  }
//+------------------------------------------------------------------+
//| Custom indicator iteration function                              |
//+------------------------------------------------------------------+
int start()
  {
   int    counted_bars=IndicatorCounted();
//---- TODO: add your code here
double day_high=0;
double day_low=0;
double yesterday_high=0;
double yesterday_open=0;
double yesterday_low=0;
double yesterday_close=0;
double today_open=0;

double P=0,S=0,R=0,S1=0,R1=0,S2=0,R2=0,S3=0,R3=0,nQ=0,nD=0,D=0;
double H3,H2,H1,L1,L2,L3;
int cnt=720;
double cur_day=0;
double prev_day=0;

double rates_d1[2][6];

//---- exit if period is greater than daily charts
if(Period() > 1440)
{
Print("Error - Chart period is greater than 1 day.");
return(-1); // then exit
}

//---- Get new daily prices & calculate pivots

while (cnt!= 0)
{
	cur_day = TimeDay(Time[cnt]- (GMTshift*3600));

	if (prev_day != cur_day)
	{
		yesterday_close = Close[cnt+1];
		today_open = Open[cnt];
		yesterday_high = day_high;
		yesterday_low = day_low;

		day_high = High[cnt];
		day_low  = Low[cnt];

		prev_day = cur_day;
	}

   if (High[cnt]>day_high)
   {
      day_high = High[cnt];
   }
   if (Low[cnt]<day_low)
   {
      day_low = Low[cnt];
   }

//	SetIndexValue(cnt, 0);
	cnt--;

}

//------ Pivot Points ------

P = (yesterday_high + yesterday_low + yesterday_close)/3;
R1 = (2*P)-yesterday_low;
S1 = (2*P)-yesterday_high;
R2 = P-S1+R1;
S2 = P-R1+S1;
R3 = (2*P)+(yesterday_high-(2*yesterday_low));
S3 = (2*P)-((2* yesterday_high)-yesterday_low);

//------ Midpoints ------

H3 = (S2+S3)/2;
H2 = (S1+S2)/2;
H1 = (P+S1)/2;
L1 = (P+R1)/2;
L2 = (R1+R2)/2;
L3 = (R2+R3)/2;
//H3 = yesterday_high / yesterday_low * yesterday_close;
//H2 = (((yesterday_high/yesterday_low)+0.83)/1.83 )* yesterday_close;
//H1 = (((yesterday_high/yesterday_low)+2.66)/3.66 )* yesterday_close;
//L1 = yesterday_close - (H1-yesterday_close);
//L2 = yesterday_close - (H2-yesterday_close);
//L3 = yesterday_close - (H3-yesterday_close);

//------ DRAWING LINES ------

Comment("Camarilla Levels by MoStAsHaR15");

ObjectDelete("P_Line");

ObjectDelete("S3_Line");
ObjectDelete("R3_Line");

ObjectDelete("S2_Line");
ObjectDelete("R2_Line");

ObjectDelete("S1_Line");
ObjectDelete("R1_Line");

ObjectDelete("H3_Line");
ObjectDelete("L3_Line");

ObjectDelete("H2_Line");
ObjectDelete("L2_Line");

ObjectDelete("H1_Line");
ObjectDelete("L1_Line");

ObjectCreate("P_Line", OBJ_HLINE,0, CurTime(),P);
ObjectSet("P_Line",OBJPROP_COLOR,DeepPink);
ObjectSet("P_Line",OBJPROP_STYLE,STYLE_SOLID);

ObjectCreate("S3_Line", OBJ_HLINE,0, CurTime(),S3);
ObjectSet("S3_Line",OBJPROP_COLOR,Red);
ObjectSet("S3_Line",OBJPROP_STYLE,STYLE_SOLID);

ObjectCreate("R3_Line", OBJ_HLINE,0, CurTime(),R3);
ObjectSet("R3_Line",OBJPROP_COLOR,Red);
ObjectSet("R3_Line",OBJPROP_STYLE,STYLE_SOLID);

ObjectCreate("S2_Line", OBJ_HLINE,0, CurTime(),S2);
ObjectSet("S2_Line",OBJPROP_COLOR,Orange);
ObjectSet("S2_Line",OBJPROP_STYLE,STYLE_SOLID);

ObjectCreate("R2_Line", OBJ_HLINE,0, CurTime(),R2);
ObjectSet("R2_Line",OBJPROP_COLOR,Orange);
ObjectSet("R2_Line",OBJPROP_STYLE,STYLE_SOLID);

ObjectCreate("S1_Line", OBJ_HLINE,0, CurTime(),S1);
ObjectSet("S1_Line",OBJPROP_COLOR,Yellow);
ObjectSet("S1_Line",OBJPROP_STYLE,STYLE_SOLID);

ObjectCreate("R1_Line", OBJ_HLINE,0, CurTime(),R1);
ObjectSet("R1_Line",OBJPROP_COLOR,Yellow);
ObjectSet("R1_Line",OBJPROP_STYLE,STYLE_SOLID);

ObjectCreate("H3_Line", OBJ_HLINE,0, CurTime(),H3);
ObjectSet("H3_Line",OBJPROP_COLOR,White);
ObjectSet("H3_Line",OBJPROP_STYLE,STYLE_DASHDOTDOT);

ObjectCreate("H2_Line", OBJ_HLINE,0, CurTime(),H2);
ObjectSet("H2_Line",OBJPROP_COLOR,White);
ObjectSet("H2_Line",OBJPROP_STYLE,STYLE_DASHDOTDOT);

ObjectCreate("H1_Line", OBJ_HLINE,0, CurTime(),H1);
ObjectSet("H1_Line",OBJPROP_COLOR,White);
ObjectSet("H1_Line",OBJPROP_STYLE,STYLE_DASHDOTDOT);

ObjectCreate("L1_Line", OBJ_HLINE,0, CurTime(),L1);
ObjectSet("L1_Line",OBJPROP_COLOR,White);
ObjectSet("L1_Line",OBJPROP_STYLE,STYLE_DASHDOTDOT);

ObjectCreate("L2_Line", OBJ_HLINE,0, CurTime(),L2);
ObjectSet("L2_Line",OBJPROP_COLOR,White);
ObjectSet("L2_Line",OBJPROP_STYLE,STYLE_DASHDOTDOT);

ObjectCreate("L3_Line", OBJ_HLINE,0, CurTime(),L3);
ObjectSet("L3_Line",OBJPROP_COLOR,White);
ObjectSet("L3_Line",OBJPROP_STYLE,STYLE_DASHDOTDOT);

ObjectsRedraw();

// --- Typing Labels

if(ObjectFind("R3 label") != 0)
{
ObjectCreate("R3 label", OBJ_TEXT, 0, Time[0], R3);
ObjectSetText("R3 label", " R3 ", 8, "Arial", Red);
}
else
{
ObjectMove("R3 label", 0, Time[0], R3);
}

if(ObjectFind("S3 label") != 0)
{
ObjectCreate("S3 label", OBJ_TEXT, 0, Time[0], S3);
ObjectSetText("S3 label", " S3 ", 8, "Arial", Red);
}
else
{
ObjectMove("S3 label", 0, Time[0], S3);
}

if(ObjectFind("R2 label") != 0)
{
ObjectCreate("R2 label", OBJ_TEXT, 0, Time[0], R2);
ObjectSetText("R2 label", " R2 ", 8, "Arial", Orange);
}
else
{
ObjectMove("R2 label", 0, Time[0], R2);
}

 if(ObjectFind("S2 label") != 0)
{
ObjectCreate("S2 label", OBJ_TEXT, 0, Time[0], S2);
ObjectSetText("S2 label", " S2 ", 8, "Arial", Orange);
}
else
{
ObjectMove("S2 label", 0, Time[0], S2);
}

 if(ObjectFind("R1 label") != 0)
{
ObjectCreate("R1 label", OBJ_TEXT, 0, Time[0], R1);
ObjectSetText("R1 label", " R1 ", 8, "Arial", Yellow);
}
else
{
ObjectMove("R1 label", 0, Time[0], R1);
}

 if(ObjectFind("S1 label") != 0)
{
ObjectCreate("S1 label", OBJ_TEXT, 0, Time[0], S1);
ObjectSetText("S1 label", " S1 ", 8, "Arial", Yellow);
}
else
{
ObjectMove("S1 label", 0, Time[0], S1);
}

 if(ObjectFind("P label") != 0)
{
ObjectCreate("P label", OBJ_TEXT, 0, Time[0], P);
ObjectSetText("P label", " P ", 8, "Arial", DeepPink);
}
else
{
ObjectMove("P label", 0, Time[0], P);
}
   return(0);
 }
//+------------------------------------------------------------------+
Comments