Pivot(23JUL05)_v1
Download script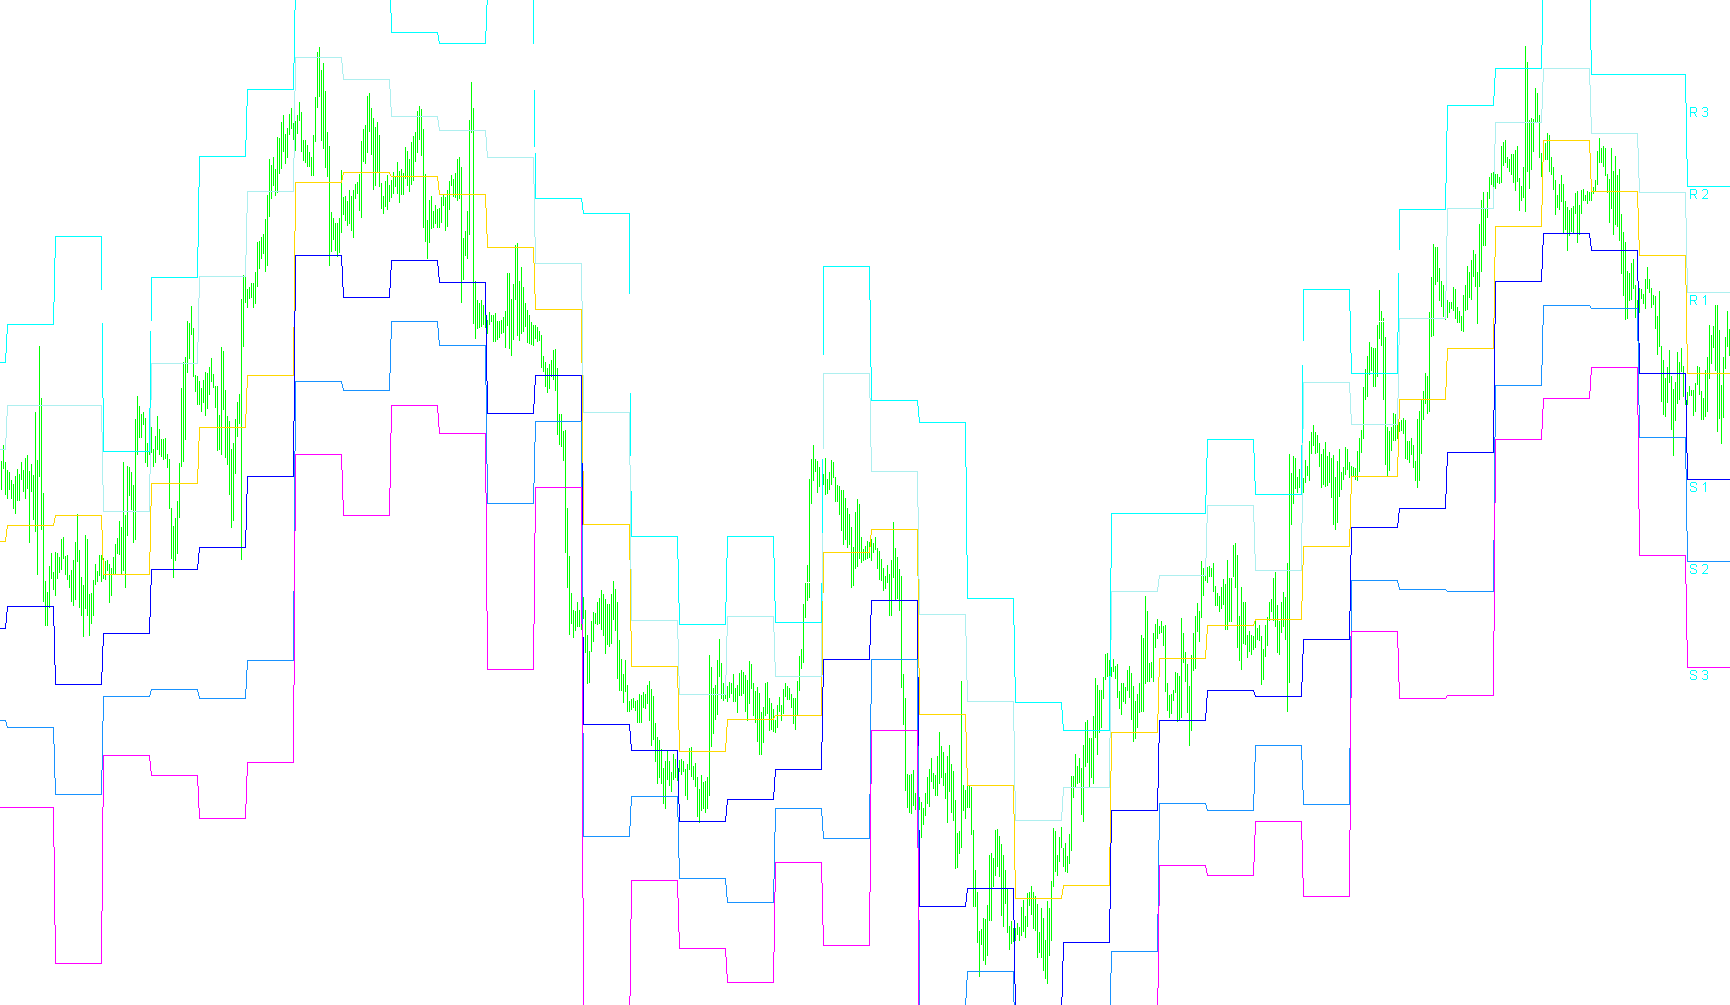
This script is a technical analysis tool designed to automatically identify and plot key price levels on a trading chart. It uses a classic financial method known as "Pivot Points," which are used by traders to determine the floor (support) and ceiling (resistance) of market prices for a specific period.
Core Functionality
The primary goal of this tool is to help traders visualize potential turning points where the price might stall, reverse, or break through. It calculates several distinct levels based on the price action of the previous trading day:
- Pivot Point (P): The central equilibrium point for the current period.
- Resistance Levels (R1, R2, R3): These represent "ceilings." They indicate areas where selling pressure might increase, potentially pushing the price back down.
- Support Levels (S1, S2, S3): These represent "floors." They indicate areas where buying interest might increase, potentially preventing the price from falling further.
How it Works Logically
The script operates by analyzing historical data and performing the following logic:
- Data Gathering: It identifies the highest price reached (High), the lowest price reached (Low), and the closing price of the previous trading day.
- New Day Detection: The script is programmed to look for a change in the calendar day. Every time a new day begins, it triggers its calculation engine.
- Mathematical Projection: Once a new day is detected, it applies specific formulas to the previous day's data to project the current day's levels. For example, it calculates the central Pivot Point by averaging the previous high, low, and closing price, then derives the various Support and Resistance levels relative to that center.
- Visual Mapping: After calculating these values, the script draws them onto your chart as horizontal lines. It also places text labels (S1, R1, S2, R2, etc.) so you can easily identify which level is which at a glance.
User Experience
For a trader, this means the chart will automatically update with a set of planned "boundaries" for each trading day. By observing how the price interacts with these lines, you can better anticipate market behavior—looking for signs of strength when price approaches a Support level or weakness when it nears a Resistance level.
/*-----------------------------+
|			       |
| Shared by www.Aptrafx.com    |
|			       |
+------------------------------*/

//+------------------------------------------------------------------+
//|                                                        Pivot.mq4 |
//|                               Copyright © 2004, Poul_Trade_Forum |
//|                                                         Aborigen |
//|                                          http://forex.kbpauk.ru/ |
//+------------------------------------------------------------------+
#property copyright "Poul Trade Forum"
#property link      "http://forex.kbpauk.ru/"

#property indicator_chart_window
//#property indicator_separate_window
#property indicator_buffers 7
#property indicator_color1 Aqua
#property indicator_color2 DodgerBlue
#property indicator_color3 Tan
#property indicator_color4 DodgerBlue
#property indicator_color5 Tan
#property indicator_color6 Bisque
#property indicator_color7 Bisque
//---- input parameters

//---- buffers
double PBuffer[];
double S1Buffer[];
double R1Buffer[];
double S2Buffer[];
double R2Buffer[];
double S3Buffer[];
double R3Buffer[];
string Pivot="Pivot Point",Sup1="S 1", Res1="R 1";
string Sup2="S 2", Res2="R 2", Sup3="S 3", Res3="R 3";
int fontsize=10;
double P,S1,R1,S2,R2,S3,R3;
double LastHigh,LastLow,x;

//+------------------------------------------------------------------+
//| Custor indicator deinitialization function                       |
//+------------------------------------------------------------------+
int deinit()
  {
//---- TODO: add your code here

   ObjectDelete("Pivot");
   ObjectDelete("Sup1");
   ObjectDelete("Res1");
   ObjectDelete("Sup2");
   ObjectDelete("Res2");
   ObjectDelete("Sup3");
   ObjectDelete("Res3");

//----
   return(0);
  }
//+------------------------------------------------------------------+
//| Custom indicator initialization function                         |
//+------------------------------------------------------------------+
int init()
  {
   string short_name;


//---- indicator line
   SetIndexStyle(0,DRAW_LINE);
   SetIndexStyle(1,DRAW_LINE);
   SetIndexStyle(2,DRAW_LINE);
   SetIndexStyle(3,DRAW_LINE);
   SetIndexStyle(4,DRAW_LINE);
   SetIndexStyle(5,DRAW_LINE);
   SetIndexStyle(6,DRAW_LINE);
   SetIndexBuffer(0,PBuffer);
   SetIndexBuffer(1,S1Buffer);
   SetIndexBuffer(2,R1Buffer);
   SetIndexBuffer(3,S2Buffer);
   SetIndexBuffer(4,R2Buffer);
   SetIndexBuffer(5,S3Buffer);
   SetIndexBuffer(6,R3Buffer);


//---- name for DataWindow and indicator subwindow label
   short_name="Pivot Point";
   IndicatorShortName(short_name);
   SetIndexLabel(0,short_name);

//----
   SetIndexDrawBegin(0,1);
//----


//----
   return(0);
  }

//+------------------------------------------------------------------+
//| Custom indicator iteration function                              |
//+------------------------------------------------------------------+
int start()

  {
   int    counted_bars=IndicatorCounted();

   int limit, i;
//---- indicator calculation
if (counted_bars==0)
{
   x=Period();
   if (x>240) return(-1);
   ObjectCreate("Sup1", OBJ_TEXT, 0, 0, 0);
   ObjectSetText("Sup1", "      S 1",fontsize,"Arial", Aqua);
   ObjectCreate("Res1", OBJ_TEXT, 0, 0, 0);
   ObjectSetText("Res1", "      R 1",fontsize,"Arial", Aqua);
   ObjectCreate("Sup2", OBJ_TEXT, 0, 0, 0);
   ObjectSetText("Sup2", "      S 2",fontsize,"Arial", Aqua);
   ObjectCreate("Res2", OBJ_TEXT, 0, 0, 0);
   ObjectSetText("Res2", "      R 2",fontsize,"Arial", Aqua);
   ObjectCreate("Sup3", OBJ_TEXT, 0, 0, 0);
   ObjectSetText("Sup3", "      S 3",fontsize,"Arial", Aqua);
   ObjectCreate("Res3", OBJ_TEXT, 0, 0, 0);
   ObjectSetText("Res3", "      R 3",fontsize,"Arial", Aqua);
}
   if(counted_bars<0) return(-1);
//---- last counted bar will be recounted
//   if(counted_bars>0) counted_bars--;
   limit=(Bars-counted_bars)-1;


for (i=limit; i>=0;i--)
{

if (High[i+1]>LastHigh) LastHigh=High[i+1];
if (Low[i+1]<LastLow) LastLow=Low[i+1];

if (TimeDay(Time[i])!=TimeDay(Time[i+1]))
   {
   P=(LastHigh+LastLow+Close[i+1])/3;
   R1 = (2*P)-LastLow;
   S1 = (2*P)-LastHigh;
   R2 = P+(LastHigh - LastLow);
   S2 = P-(LastHigh - LastLow);
   R3 = (2*P)+(LastHigh-(2*LastLow));
   S3 = (2*P)-((2* LastHigh)-LastLow);
   LastLow=Open[i]; LastHigh=Open[i];

   ObjectMove("Pivot", 0, Time[i],P);
   ObjectMove("Sup1", 0, Time[i],S1);
   ObjectMove("Res1", 0, Time[i],R1);
   ObjectMove("Sup2", 0, Time[i],S2);
   ObjectMove("Res2", 0, Time[i],R2);
   ObjectMove("Sup3", 0, Time[i],S3);
   ObjectMove("Res3", 0, Time[i],R3);

   }

    PBuffer[i]=P;
    S1Buffer[i]=S1;
    R1Buffer[i]=R1;
    S2Buffer[i]=S2;
    R2Buffer[i]=R2;
    S3Buffer[i]=S3;
    R3Buffer[i]=R3;

}

//----
   return(0);
  }
//+------------------------------------------------------------------+
Comments