Keltner Channels_v1
Download script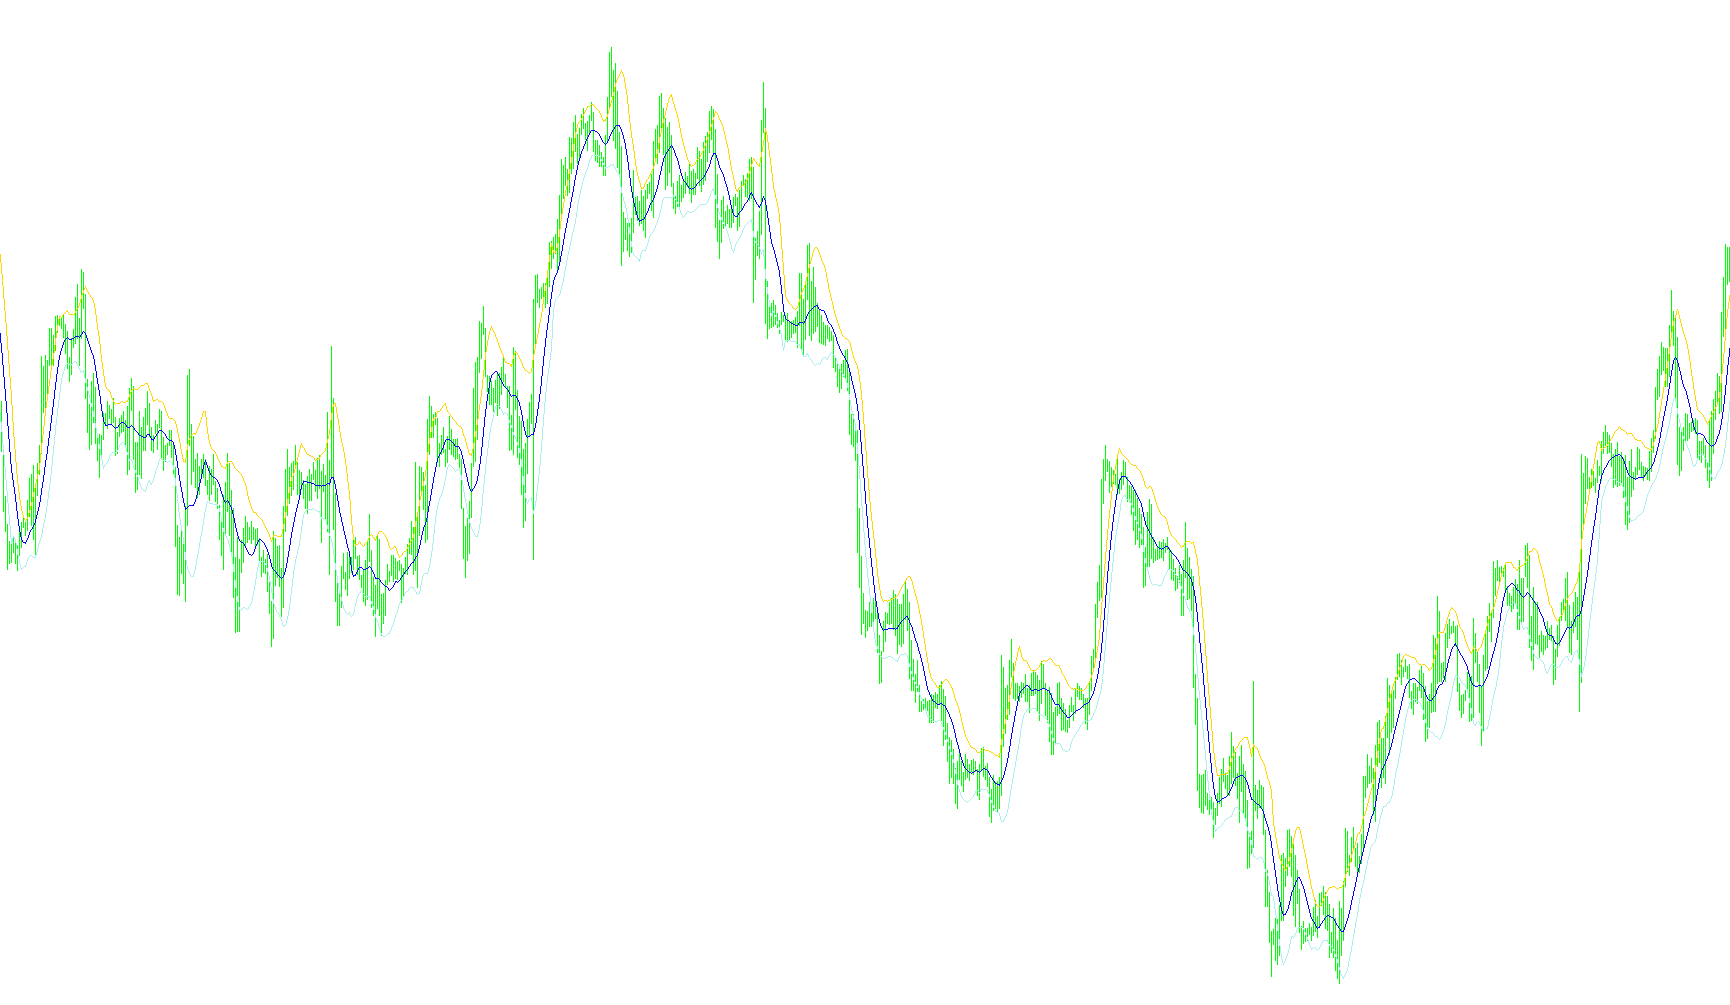
This tool is designed to provide a visual representation of market volatility and price trends by plotting three distinct lines on your trading chart. It helps traders identify the "normal" range of price movement and detect potential extremes where the market may be overextended.
Core Logic Overview
The indicator operates by calculating a central path for the price and then establishing a boundary around that path based on how much the price typically fluctuates.
1. The Central Trend (Middle Line) The software first calculates a Simple Moving Average (SMA). This serves as the "heartbeat" of the price action, smoothing out short-term noise to show you the average price over a specific set timeframe (the period). This line represents the equilibrium point of the current market trend.
2. The Volatility Calculation To determine how wide the boundaries should be, the script looks at the "Range" of each price candle—specifically the distance between the highest and lowest points reached during each session. It adds up these ranges over your chosen period and calculates their average. This tells the tool how much the market "wiggles" on a regular basis.
3. The Outer Boundaries (Upper and Lower Channels) Finally, the script constructs the channel by applying that volatility measurement to the central trend line:
- The Upper Channel: Calculated by adding the volatility average to the middle line.
- The Lower Channel: Calculated by subtracting the volatility average from the middle line.
How to Interpret the Results
When you view this on a chart, you will see a " коридор" (channel) that expands and contracts automatically:
- Market Stability: When the price stays within the upper and lower lines, it is behaving according to its recent historical volatility.
- Expansion: If the lines move further apart, it indicates that the market is experiencing higher-than-normal price swings.
- Contraction: If the lines tighten together, it suggests a period of low activity or consolidation.
- Breakouts: When the price moves outside of these boundaries, it signals that a significant move is occurring that exceeds the standard historical "noise" of the market, which many traders use as a signal to watch for potential trend reversals or strong momentum shifts.
/*-----------------------------+
|			       |
| Shared by www.Aptrafx.com    |
|			       |
+------------------------------*/

//+------------------------------------------------------------------+
//|                                             Keltner Channels.mq4 |
//|                                                  Coded by Gilani |
//|                      Copyright © 2005, MetaQuotes Software Corp. |
//|                                        http://www.metaquotes.net |
//+------------------------------------------------------------------+
#property copyright "Copyright © 2005, MetaQuotes Software Corp."
#property link      "http://www.metaquotes.net"
//+------------------------------------------------------------------+
//| Custom indicator initialization function                         |
//+------------------------------------------------------------------+
#property indicator_chart_window
#property indicator_buffers 3
#property indicator_color1 White
#property indicator_color2 White
#property indicator_color3 White


double upper[], middle[], lower[];
extern int period = 10;


int init()
  {
   SetIndexStyle(0,DRAW_LINE);
   SetIndexShift(0,0);
   SetIndexDrawBegin(0,0);
   SetIndexBuffer(0,upper);

   SetIndexStyle(1,DRAW_LINE);
   SetIndexShift(1,0);
   SetIndexDrawBegin(1,0);
   SetIndexBuffer(1,middle);

   SetIndexStyle(2,DRAW_LINE);
   SetIndexShift(2,0);
   SetIndexDrawBegin(2,0);
   SetIndexBuffer(2,lower);


//---- indicators
//----
   return(0);
  }
//+------------------------------------------------------------------+
//| Custor indicator deinitialization function                       |
//+------------------------------------------------------------------+
int deinit()
  {
//---- TODO: add your code here

//----
   return(0);
  }
//+------------------------------------------------------------------+
//| Custom indicator iteration function                              |
//+------------------------------------------------------------------+
int start() {
   int limit;
   int counted_bars=IndicatorCounted();
   if(counted_bars<0) return(-1);
   if(counted_bars>0) counted_bars--;
   limit=Bars-counted_bars;

   double avg;

   for(int x=0; x<limit; x++) {
      middle[x] = iMA(NULL, 0, period, 0, MODE_SMA, PRICE_TYPICAL, x);
      avg  = findAvg(period, x);
      upper[x] = middle[x] + avg;
      lower[x] = middle[x] - avg;
   }
   return(0);
  }
//+------------------------------------------------------------------+


   double findAvg(int period, int shift) {
      double sum=0;
      for (int x=shift;x<(shift+period);x++) {
         sum += High[x]-Low[x];
      }
      sum = sum/period;
      return (sum);
   }
Comments