Keltner Channels_v3
Download script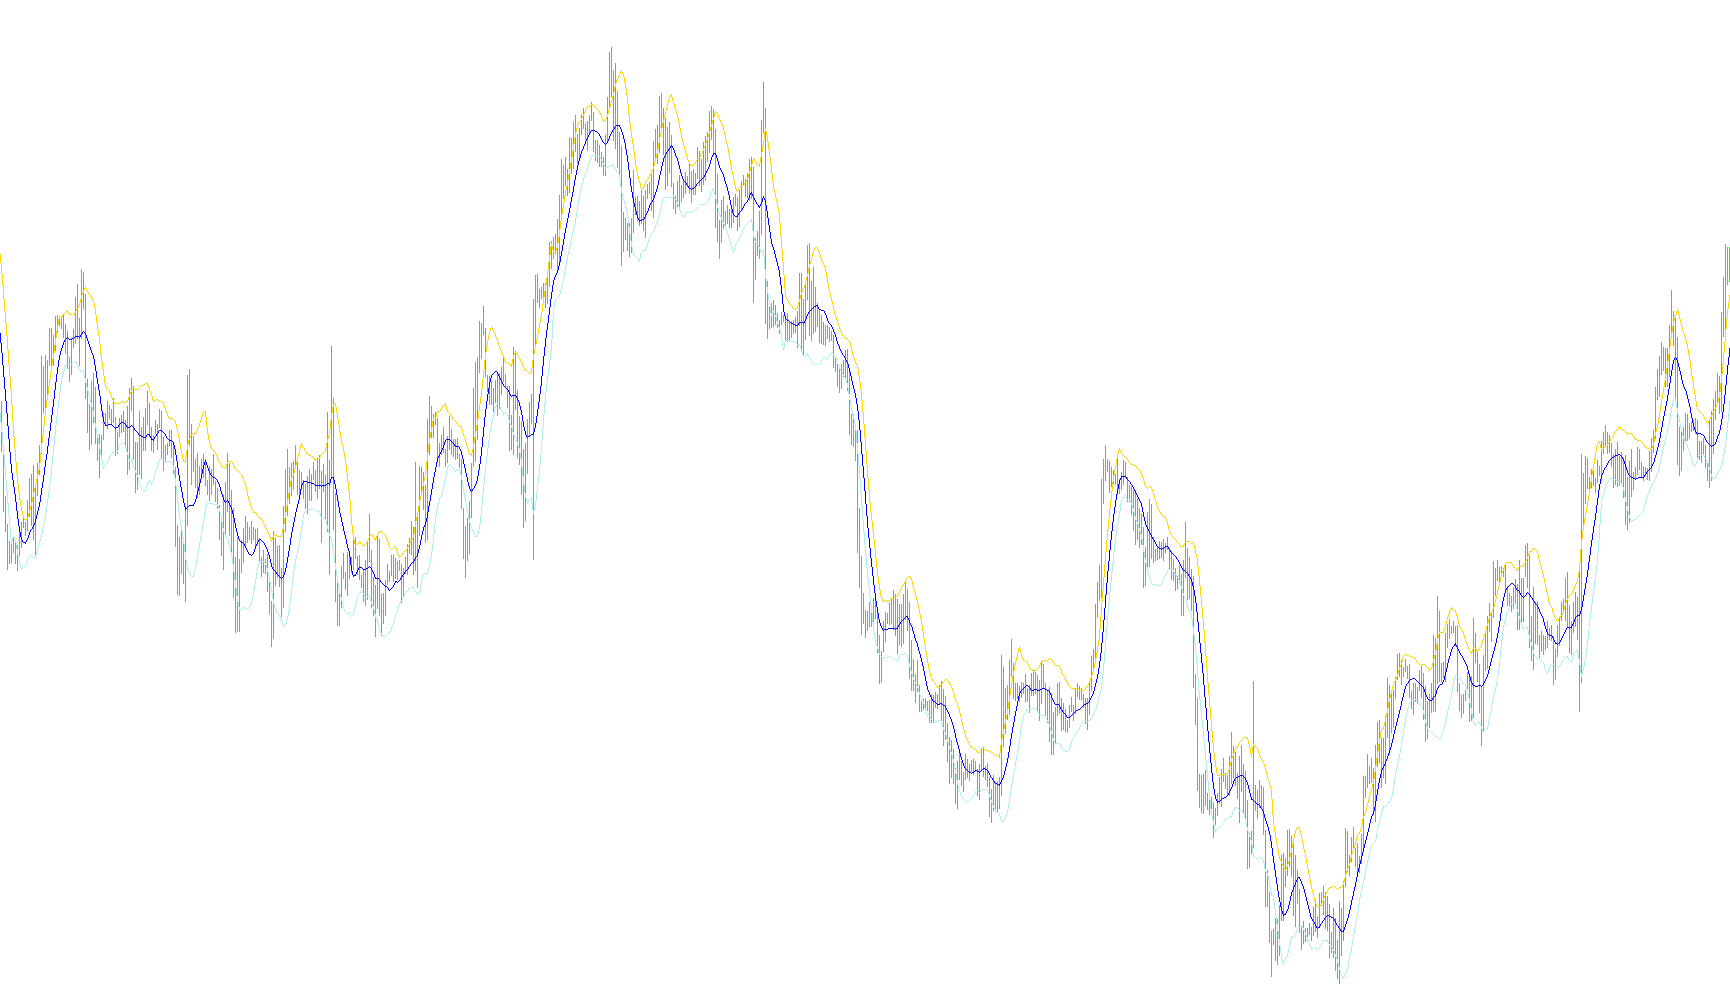
This technical indicator is designed to help traders visualize market volatility and price trends by plotting a three-line channel directly on the trading chart. By analyzing historical price movements, it creates a "corridor" that helps identify whether the current price is behaving normally or experiencing unusual fluctuations.
How the Logic Works
The indicator functions by calculating three distinct lines based on a specific timeframe (the period) provided by the user. Here is the step--by-step breakdown of how it processes data:
1. Establishing the Core Trend (The Middle Line) The foundation of the indicator is a moving average. The script looks at the "typical" price—a balance between the high, low, and closing prices—over a set number of previous candles. This creates a central line that smooths out the erratic "noise" of the market to show you the general direction in which the price is moving.
2. Measuring Market Volatility (The Range) To determine how wide the outer boundaries of the channel should be, the script performs a secondary calculation. It examines the distance between the highest price and the lowest price for every candle over the chosen period. By averaging these distances, the script determines the "standard" amount of movement currently occurring in the market.
3. Creating the Boundaries (Upper and Lower Lines) Finally, the indicator combines the core trend with the volatility measurement:
- The Upper Line: This is created by adding the volatility average to the middle trend line. It represents the ceiling of normal price movement.
- The Lower Line: This is created by subtracting the volatility average from the middle trend line. It represents the floor of normal price movement.
Visual Summary for Traders
When you see this on your chart, you are essentially looking at a dynamic "envelope."
- The Middle Line shows you the current equilibrium of the market.
- The Outer Channels show you the boundaries of expected price action.
When the price stays within these lines, the market is considered to be moving within its normal range. When the price pushes outside of these boundaries, it suggests a high-volatility event or a potential breakout in the trend.
//+------------------------------------------------------------------+
//|                                             Keltner Channels.mq4 |
//|                                                  Coded by Gilani |
//|                      Copyright © 2005, MetaQuotes Software Corp. |
//|                                        http://www.metaquotes.net |
//+------------------------------------------------------------------+
#property copyright "Copyright © 2005, MetaQuotes Software Corp."
#property link      "http://www.metaquotes.net"
//+------------------------------------------------------------------+
//| Custom indicator initialization function                         |
//+------------------------------------------------------------------+
#property indicator_chart_window
#property indicator_buffers 3
#property indicator_color1 Red
#property indicator_color2 Green
#property indicator_color3 Black
//----
double upper[], middle[], lower[];
extern int period=10;
//----
//+------------------------------------------------------------------+
//|                                                                  |
//+------------------------------------------------------------------+
int init()
  {
   SetIndexStyle(0,DRAW_LINE);
   SetIndexShift(0,0);
   SetIndexDrawBegin(0,0);
   SetIndexBuffer(0,upper);
   SetIndexStyle(1,DRAW_LINE);
   SetIndexShift(1,0);
   SetIndexDrawBegin(1,0);
   SetIndexBuffer(1,middle);
   SetIndexStyle(2,DRAW_LINE);
   SetIndexShift(2,0);
   SetIndexDrawBegin(2,0);
   SetIndexBuffer(2,lower);
//---- indicators
//----
   return(0);
  }
//+------------------------------------------------------------------+
//| Custor indicator deinitialization function                       |
//+------------------------------------------------------------------+
int deinit()
  {
//---- TODO: add your code here
//----
   return(0);
  }
//+------------------------------------------------------------------+
//| Custom indicator iteration function                              |
//+------------------------------------------------------------------+
  int start()
  {
   int limit;
   int counted_bars=IndicatorCounted();
   if(counted_bars<0) return(-1);
   if(counted_bars>0) counted_bars--;
   limit=Bars-counted_bars;
//----
   double avg;
     for(int x=0; x<limit; x++)
     {
      middle[x]=iMA(NULL, 0, period, 0, MODE_SMA, PRICE_TYPICAL, x);
      avg =findAvg(period, x);
      upper[x]=middle[x] + avg;
      lower[x]=middle[x] - avg;
     }
   return(0);
  }
//+------------------------------------------------------------------+
  double findAvg(int period, int shift)
  {
   double sum=0;
     for(int x=shift;x<(shift+period);x++)
     {
      sum+=High[x]-Low[x];
     }
   sum=sum/period;
   return(sum);
  }
//+------------------------------------------------------------------+
Comments