KI_signals_v1a
Download script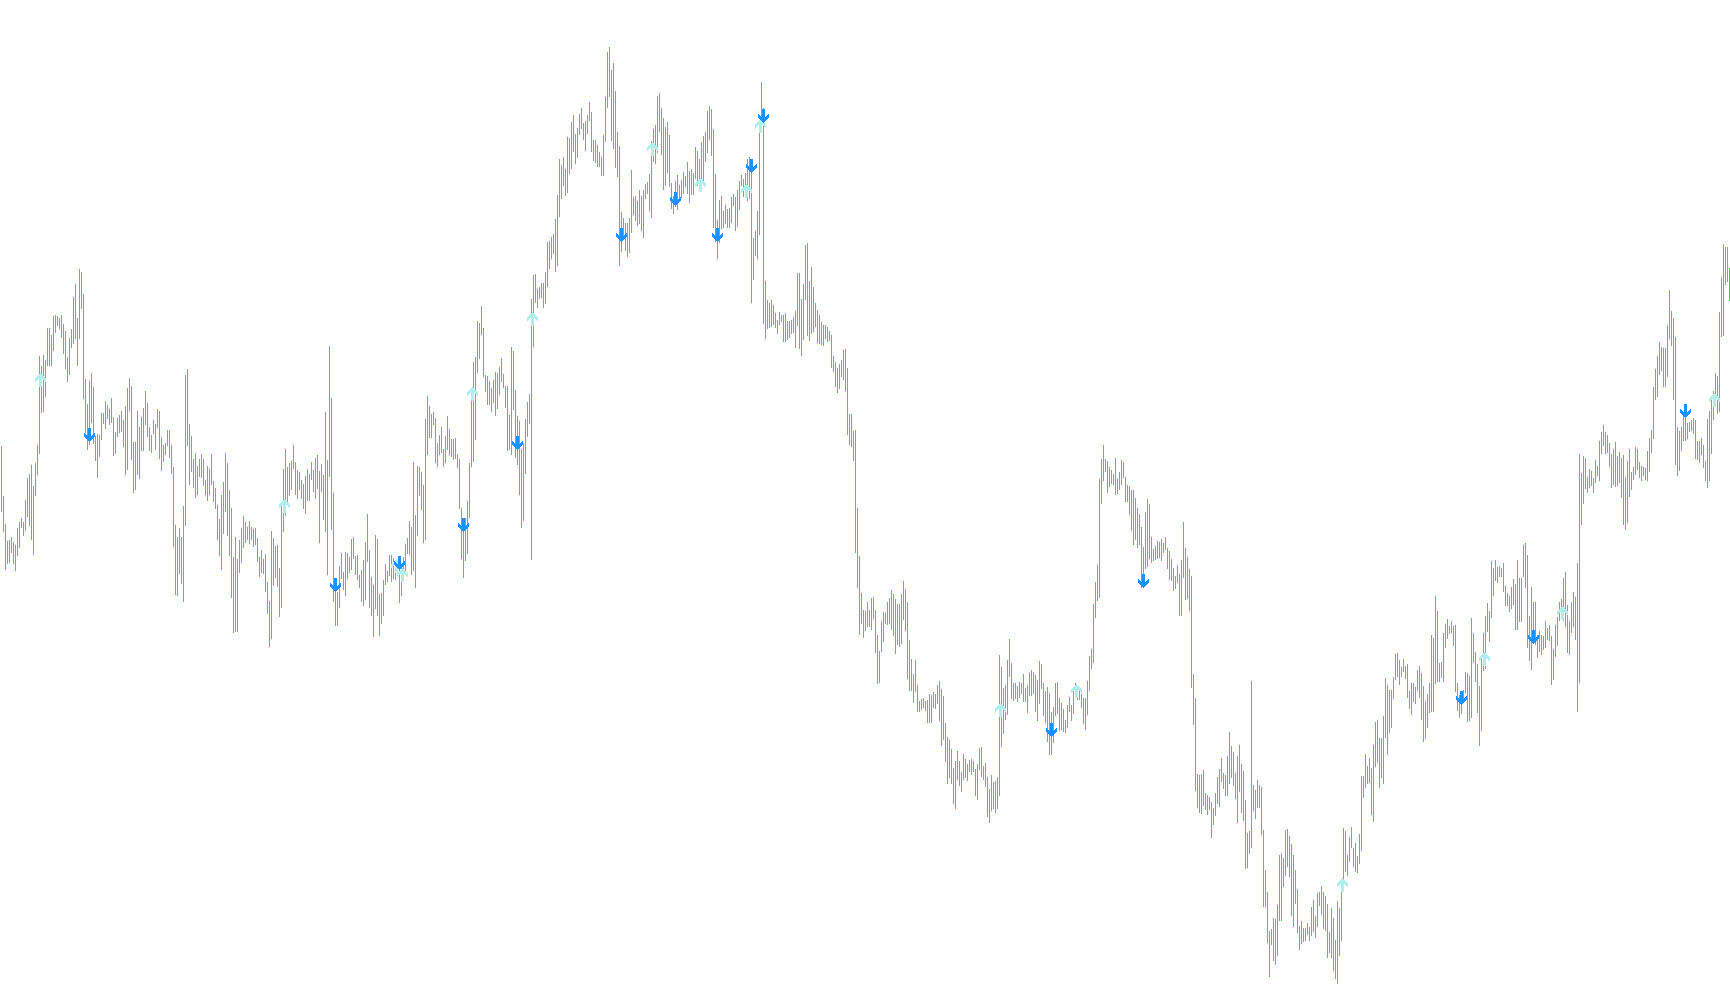
This tool is designed to analyze market momentum by identifying specific shifts in price trends. It simplifies complex price movements into visual signals, helping traders spot potential entry points based on the relationship between different moving averages.
How the Logic Works
1. Momentum Calculation The core of this script relies on calculating a "Histogram" value. It does this by measuring the distance between two different Exponential Moving Averages (EMAs). By comparing these averages, the tool determines the strength and direction of the current market trend.
To smooth out this data and filter out minor market "noise," the script applies a third moving average to that initial histogram calculation. This creates a refined trend line that represents the overall momentum of the asset.
2. Buy and Sell Signals (Alerts) The primary function of the script is to identify "crossovers" in this momentum trend:
- Long/Buy Signal: Triggered when the smoothed momentum line crosses from a negative value to a positive value. This indicates that upward momentum is gaining strength.
- Short/Sell Signal: Triggered when the smoothed momentum line crosses from a positive value to a negative value, suggesting that downward pressure is taking over.
When these specific shifts occur in real-time on the current candle, the script provides an immediate on-screen alert.
3. Optional Visual Enhancements The tool includes two optional features that can be toggled based on user preference:
- Highs and Valleys: This mode looks for specific turning points in the momentum histogram. It identifies areas where the momentum begins to pivot, marking potential local peaks or troughs.
- Momentum Crosses: This adds an extra layer of confirmation by tracking when the raw histogram crosses over its own smoothed average. This helps traders see the immediate interaction between short-term volatility and longer-term trends.
Summary for Traders
In essence, this script acts as a momentum filter. Instead of reacting to every small price tick, it waits for the underlying trend data to shift significantly. It identifies when the "weight" of the market shifts from one direction to another, providing clear visual markers and audio alerts to notify you of these transitions.
//+------------------------------------------------------------------+
//|                                                KI_signals_v1.mq4 |
//|                                                          Kalenzo |
//|                                      bartlomiej.gorski@gmail.com |
//+------------------------------------------------------------------+
#property copyright "Kalenzo"
#property link      "bartlomiej.gorski@gmail.com"

#property indicator_chart_window
#property indicator_buffers 6
#property indicator_color1 SteelBlue
#property indicator_color2 Orange
#property indicator_color3 DodgerBlue
#property indicator_color4 Magenta
#property indicator_color5 Blue
#property indicator_color6 Red

#property indicator_level1 0

extern int Length1 = 3;
extern int Length2 = 10;
extern int Length3 = 16;
extern bool showHL = false;
extern bool showCrosses = false;

double Histo[];
double MaHisto[];

double up[];
double dn[];

double high[];
double valley[];

double cUp[];
double cDn[];

int alertBar;
//+------------------------------------------------------------------+
//| Custom indicator initialization function                         |
//+------------------------------------------------------------------+
int init()
  {
//---- additional buffers are used for counting
   IndicatorBuffers(8);

   SetIndexStyle(0,DRAW_ARROW,EMPTY,0);
   SetIndexStyle(1,DRAW_ARROW,EMPTY,0);

   SetIndexStyle(2,DRAW_ARROW,EMPTY,1);
   SetIndexStyle(3,DRAW_ARROW,EMPTY,1);

   SetIndexStyle(4,DRAW_ARROW,EMPTY,0);
   SetIndexStyle(5,DRAW_ARROW,EMPTY,0);

   SetIndexArrow(0,217);
   SetIndexArrow(1,218);

   SetIndexArrow(2,233);
   SetIndexArrow(3,234);

   SetIndexArrow(4,108);
   SetIndexArrow(5,108);

   IndicatorDigits(6);

   SetIndexBuffer(0,high);
   SetIndexBuffer(1,valley);

   SetIndexBuffer(2,up);
   SetIndexBuffer(3,dn);

   SetIndexBuffer(4,cUp);
   SetIndexBuffer(5,cDn);

   SetIndexBuffer(6,Histo);
   SetIndexBuffer(7,MaHisto);

   IndicatorShortName("KI signals v1");

   SetIndexLabel(2,"UP SIGNAL");
   SetIndexLabel(3,"DN SIGNAL");


   return(0);
  }
//+------------------------------------------------------------------+
//| SignalIndicator                                                  |
//+------------------------------------------------------------------+
int start()
  {
   int limit;
   int counted_bars=IndicatorCounted();
   if(counted_bars<0) counted_bars=0;
   if(counted_bars>0) counted_bars--;
   limit=Bars-counted_bars;
//----

   for(int i = 0 ;i <= limit ;i++)Histo[i] = iMA(Symbol(),0,Length1,0,MODE_EMA,PRICE_CLOSE,i) - iMA(Symbol(),0,Length2,0,MODE_EMA,PRICE_CLOSE,i);

   for(int j = 0 ;j <= limit ;j++)MaHisto[j] = iMAOnArray(Histo,0,Length3,0,MODE_EMA,j);

   for(int m = 0 ;m <= limit ;m++)
   {
      if(MaHisto[m+1] <= 0 && MaHisto[m]>0)
      {
         up[m] = Open[m]-(5*Point);
         if(Bars > alertBar && m == 0)
         {
            Alert(Symbol()+" "+Period()+" KI LONG");
            alertBar = Bars;
         }
      }

      if(MaHisto[m+1] >= 0 && MaHisto[m]<0)
      {
         dn[m] = Open[m]+(5*Point);
         if(Bars > alertBar && m == 0)
         {
            Alert(Symbol()+" "+Period()+" KI SHORT");
            alertBar = Bars;
         }
      }


      if(showHL)
      {
         if(Histo[m]<= 0 && Histo[m+2]<= Histo[m+1] && Histo[m+1]>Histo[m])
         {
            high[m+1] = High[m+1]+(2*Point);
         }

         if(Histo[m]>= 0 && Histo[m+2]>= Histo[m+1] && Histo[m+1]<Histo[m])
         {
            valley[m+1] = Low[m+1]+(2*Point);
         }
      }

      if(showCrosses)
      {
         if(Histo[m+1] <= MaHisto[m+1] && Histo[m] > MaHisto[m])
         {
            cUp[m] = Open[m];
         }

         if(Histo[m+1] >= MaHisto[m+1] && Histo[m] < MaHisto[m])
         {
            cDn[m] = Open[m];
         }
      }


   }
//----
 return(0);
  }
//+------------------------------------------------------------------+
Comments