Keltner Channels_v2
Download script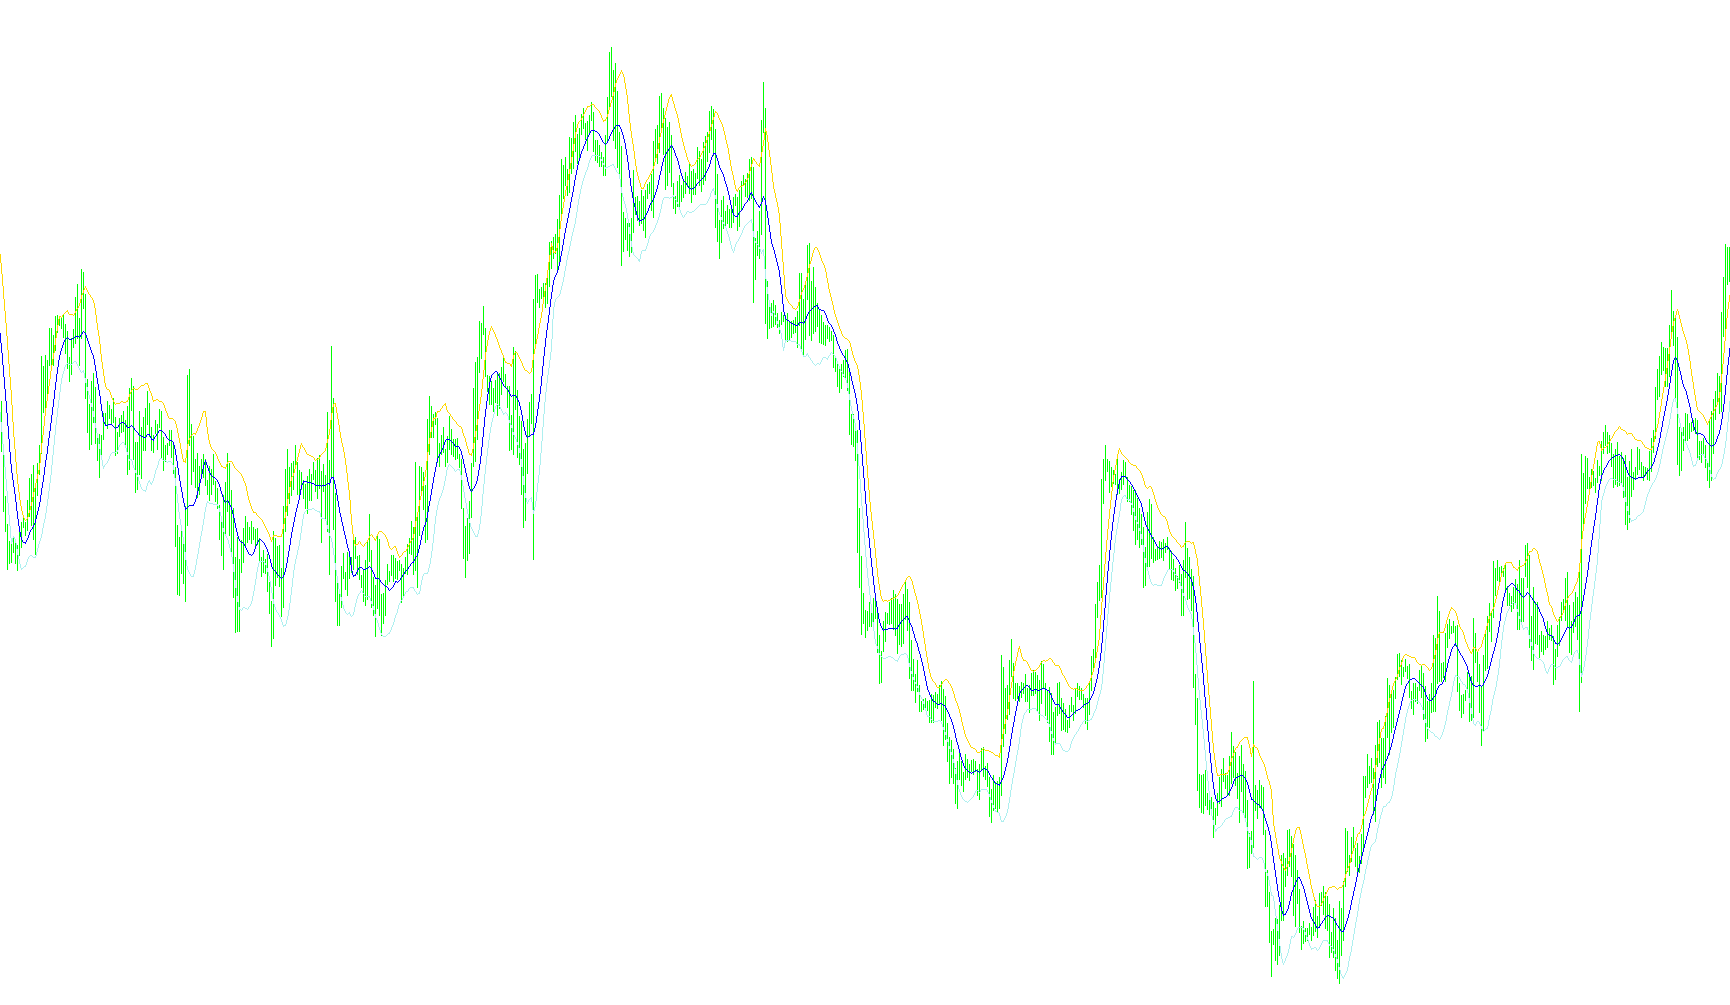
This script is designed as a visual trading tool that draws a specific type of trend indicator—known as Keltner Channels—directly onto your trading charts. Its primary purpose is to provide a visual "corridor" that helps traders understand the current price range and volatility of a market asset in real-time.
How the Logic Works
The tool identifies three distinct lines on your chart: an upper boundary, a middle line, and a lower boundary. Here is the step-by-step logic it uses to create them:
1. The Middle Line (The Baseline) The script first calculates a "Simple Moving Average" (SMA). It looks at a specific number of past price candles (defined by the user as the "period") and calculates the average typical price. This creates the center line of the channel, representing the general equilibrium or trend of the market.
2. The Volatility Measurement To determine how wide the channel should be, the script performs a secondary calculation. Instead of looking at just the price, it looks at the "range" of each candle—specifically the distance between the highest point (High) and the lowest point (Low) reached during that timeframe. It calculates the average of these ranges over the same period. This represents the current "noise" or volatility in the market.
3. Creating the Boundaries Once the script has the Middle Line (the trend) and the Volatility Measurement (the range), it combines them to create the boundaries:
- The Upper Channel: It adds the volatility measurement to the middle line. This shows the upper limit of normal price movement.
- The Lower Channel: It subtracts the volatility measurement from the middle line. This shows the lower limit of normal price movement.
Summary for the User
Essentially, this script builds a dynamic "envelope" around the price action. When the market is calm, the lines will tighten together; when the market becomes volatile, the lines will expand outward. By observing where the price sits in relation to these three lines, traders can get a clearer picture of whether the current price is moving within normal boundaries or if it is potentially overextended in either direction.
//+------------------------------------------------------------------+
//|                                             Keltner Channels.mq4 |
//|                                                  Coded by Gilani |
//|                      Copyright © 2005, MetaQuotes Software Corp. |
//|                                        http://www.metaquotes.net |
//+------------------------------------------------------------------+
#property copyright "Copyright © 2005, MetaQuotes Software Corp."
#property link      "http://www.metaquotes.net"
//+------------------------------------------------------------------+
//| Custom indicator initialization function                         |
//+------------------------------------------------------------------+
#property indicator_chart_window
#property indicator_buffers 3
#property indicator_color1 White
#property indicator_color2 White
#property indicator_color3 White


double upper[], middle[], lower[];
extern int period = 10;


int init()
  {
   SetIndexStyle(0,DRAW_LINE);
   SetIndexShift(0,0);
   SetIndexDrawBegin(0,0);
   SetIndexBuffer(0,upper);

   SetIndexStyle(1,DRAW_LINE);
   SetIndexShift(1,0);
   SetIndexDrawBegin(1,0);
   SetIndexBuffer(1,middle);

   SetIndexStyle(2,DRAW_LINE);
   SetIndexShift(2,0);
   SetIndexDrawBegin(2,0);
   SetIndexBuffer(2,lower);


//---- indicators
//----
   return(0);
  }
//+------------------------------------------------------------------+
//| Custor indicator deinitialization function                       |
//+------------------------------------------------------------------+
int deinit()
  {
//---- TODO: add your code here

//----
   return(0);
  }
//+------------------------------------------------------------------+
//| Custom indicator iteration function                              |
//+------------------------------------------------------------------+
int start() {
   int limit;
   int counted_bars=IndicatorCounted();
   if(counted_bars<0) return(-1);
   if(counted_bars>0) counted_bars--;
   limit=Bars-counted_bars;

   double avg;

   for(int x=0; x<limit; x++) {
      middle[x] = iMA(NULL, 0, period, 0, MODE_SMA, PRICE_TYPICAL, x);
      avg  = findAvg(period, x);
      upper[x] = middle[x] + avg;
      lower[x] = middle[x] - avg;
   }
   return(0);
  }
//+------------------------------------------------------------------+


   double findAvg(int period, int shift) {
      double sum=0;
      for (int x=shift;x<(shift+period);x++) {
         sum += High[x]-Low[x];
      }
      sum = sum/period;
      return (sum);
   }
Comments