KijunTenkan+
Download script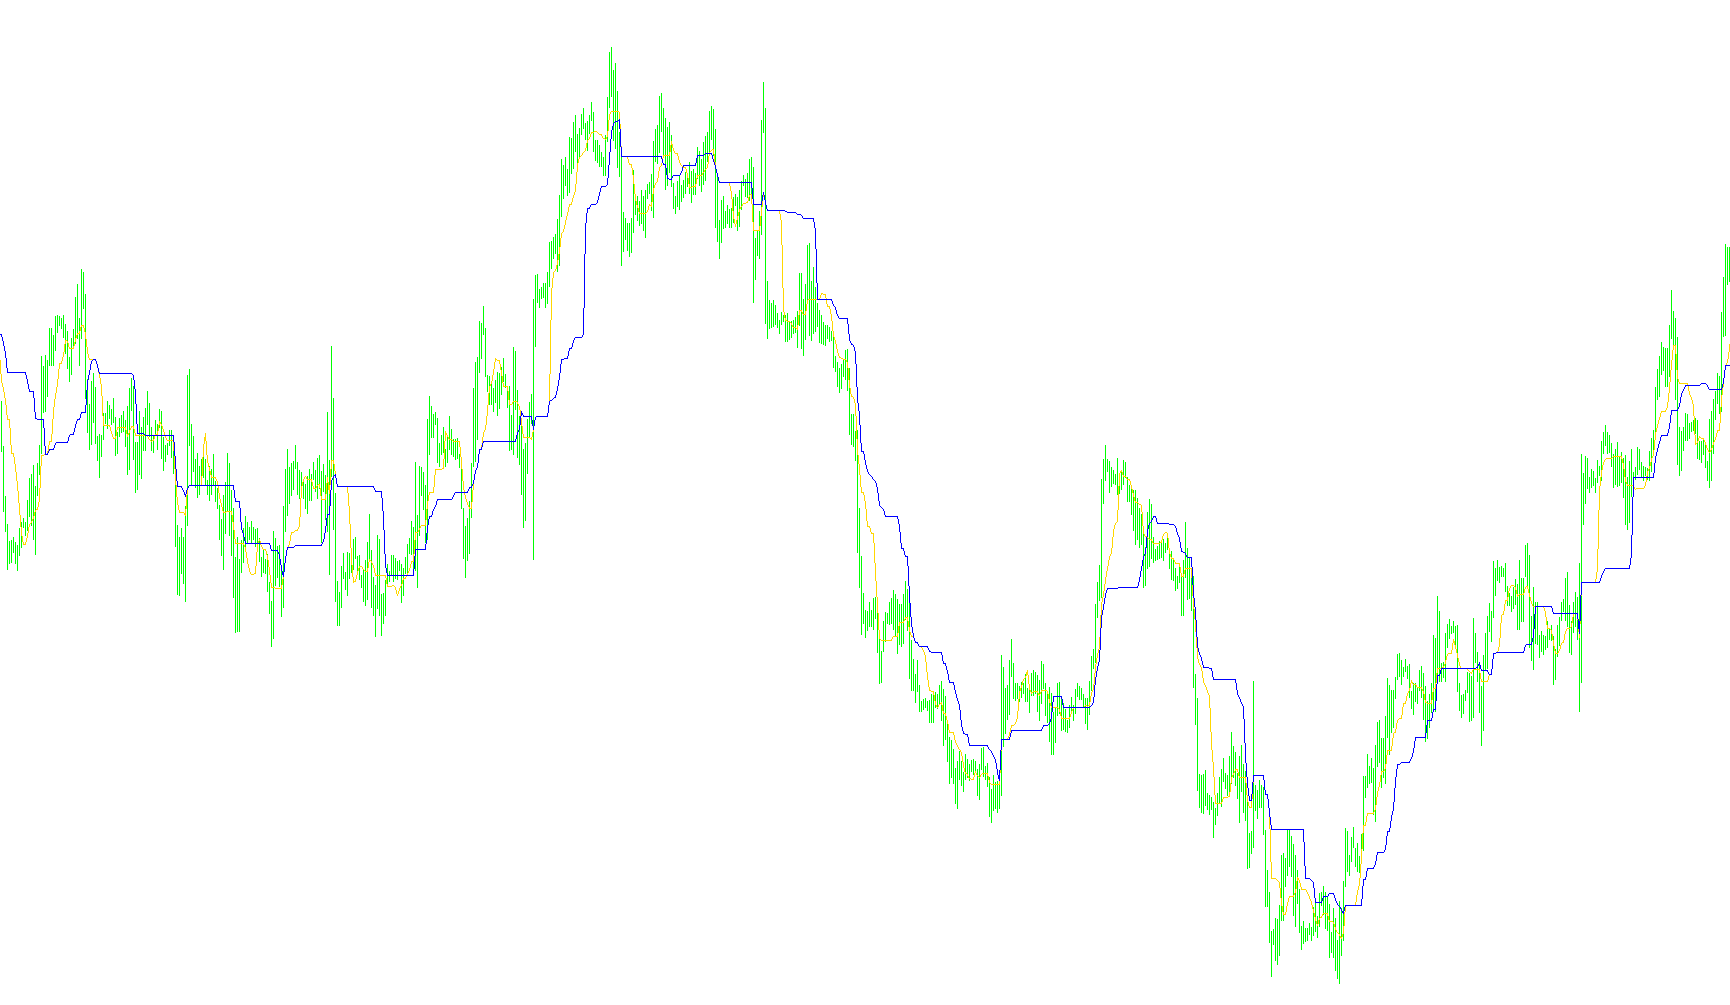
This script is designed to automate the visualization of two primary components of the Ichimoku Kinko Hyo technical analysis system on a trading chart. Specifically, it calculates and plots the Tenkan-sen (Conversion Line) and the Kijun-sen (Base Line), which are essential tools used by traders to identify momentum and trend direction.
Core Logic Overview
The script operates by analyzing historical price data—specifically the highest highs and lowest lows over defined periods—to determine the equilibrium points of a market's movement. Rather than following a standard moving average (which averages prices), this logic identifies "price boundaries" to create smoother, more responsive trend lines.
How the Calculations Work
The script processes two distinct layers of data:
1. The Tenkan-sen (Conversion Line)
- Purpose: This serves as a short-term indicator of momentum.
- Mechanism: The script looks back at a specific number of previous candles (defined by the "Tenkan" parameter). It identifies the highest price point and the lowest price point reached during that timeframe.
- Result: It calculates the midpoint between that high and low. By plotting this midpoint, the script shows where the "fair value" of the market is currently residing in the short term.
2. The Kijun-sen (Base Line)
- Purpose: This acts as a medium-term trend indicator and a primary support/resistance level.
- Mechanism: Similar to the conversion line, it identifies the highest high and lowest low, but it looks back over a much larger number of candles (defined by the "Kijun" parameter).
- Result: By calculating the midpoint of this longer duration, the script creates a more stable line that represents the broader market trend.
Visual Presentation and Offsets
To make the data more readable and useful for real-time analysis, the script includes two specific behaviors:
- Shifting: The script applies a "Shift" to both lines. This pushes the lines forward on the chart relative to current time. This displacement helps traders visualize where the trend is heading versus where it has already been, allowing for a clearer view of potential price interactions.
- Dynamic Updating: The logic ensures that as new candles form, the script constantly recalculates these boundaries. It effectively "slides" along the chart, updating the midpoint automatically so that the lines reflect the most recent market volatility.
Summary for Traders
In practical terms, this script filters out market "noise" by focusing on price extremes. By viewing these two lines together, you can see the relationship between short-term momentum (Tenkan-sen) and medium-term stability (Kijun-sen). When these lines move in harmony or cross one another, they provide visual cues regarding potential trend reversals or continuations.
//+------------------------------------------------------------------+
//|                                                     Ichimoku.mq4 |
//|                      Copyright © 2004, MetaQuotes Software Corp. |
//|                      Copyright © 2004, AlexSilver â ïëàíå +      |
//|                                       http://www.metaquotes.net/ |
//|                                       http://www.viac.ru/        |
//+------------------------------------------------------------------+
#property copyright "Copyright © 2004, AlexSilver â ïëàíå +"
#property link      "http://www.viac.ru/"

#property indicator_chart_window
#property indicator_buffers 2
#property indicator_color1 Red
#property indicator_color2 Blue
//---- input parameters
extern int Tenkan=9;
extern int Kijun=26;
extern int TenkanShift=3;
extern int KijunShift=9;
//---- buffers
double Tenkan_Buffer[];
double Kijun_Buffer[];
//----
//+------------------------------------------------------------------+
//| Custom indicator initialization function                         |
//+------------------------------------------------------------------+
int init()
  {
//---- Âûâîä Tenkan-sen
   SetIndexStyle(0,DRAW_LINE);
   SetIndexBuffer(0,Tenkan_Buffer);
   SetIndexDrawBegin(0,Tenkan+TenkanShift-1);
   SetIndexShift(0,TenkanShift);
   SetIndexLabel(0,"Tenkan Sen");
//---- Âûâîä Kijun-sen
   SetIndexStyle(1,DRAW_LINE);
   SetIndexBuffer(1,Kijun_Buffer);
   SetIndexDrawBegin(1,Kijun+KijunShift-1);
   SetIndexShift(1,KijunShift);
   SetIndexLabel(1,"Kijun Sen");
//----
   return(0);
  }
//+------------------------------------------------------------------+
//| Ichimoku Kinko Hyo                                               |
//+------------------------------------------------------------------+
int start()
  {
   int    i,k;
   int    counted_bars=IndicatorCounted();
   double high,low,price;
//----
   if(Bars<=Tenkan || Bars<=Kijun) return(0);
//---- initial zero
   if(counted_bars<1)
     {
      for(i=1;i<=Tenkan;i++)    Tenkan_Buffer[Bars-i]=0;
      for(i=1;i<=Kijun;i++)     Kijun_Buffer[Bars-i]=0;
     }
//---- Tenkan Sen
   i=Bars-Tenkan;
   if(counted_bars>Tenkan) i=Bars-counted_bars-1;
   while(i>=0)
     {
      high=High[i]; low=Low[i]; k=i-1+Tenkan;
      while(k>=i)
        {
         price=High[k];
         if(high<price) high=price;
         price=Low[k];
         if(low>price)  low=price;
         k--;
        }
      Tenkan_Buffer[i+TenkanShift]=(high+low)/2;
      i--;
     } i=TenkanShift-1;
   while(i>=0)
     {
      high=High[0]; low=Low[0]; k=Tenkan-TenkanShift+i;
      while(k>=0)
        {
         price=High[k];
         if(high<price) high=price;
         price=Low[k];
         if(low>price) low=price;
         k--;
        }
      Tenkan_Buffer[i]=(high+low)/2;
      i--;
     }
//---- Kijun Sen
   i=Bars-Kijun;
   if(counted_bars>Kijun) i=Bars-counted_bars-1;
   while(i>=0)
     {
      high=High[i]; low=Low[i]; k=i-1+Kijun;
      while(k>=i)
        {
         price=High[k];
         if(high<price) high=price;
         price=Low[k];
         if(low>price) low=price;
         k--;
        }
      Kijun_Buffer[i+KijunShift]=(high+low)/2;
      i--;
     } i=KijunShift-1;
   while(i>=0)
     {
      high=High[0]; low=Low[0]; k=Kijun-KijunShift+i;
      while(k>=0)
        {
         price=High[k];
         if(high<price) high=price;
         price=Low[k];
         if(low>price) low=price;
         k--;
        }
      Kijun_Buffer[i]=(high+low)/2;
      i--;
     }
//----
   return(0);
  }
//+------------------------------------------------------------------+
Comments