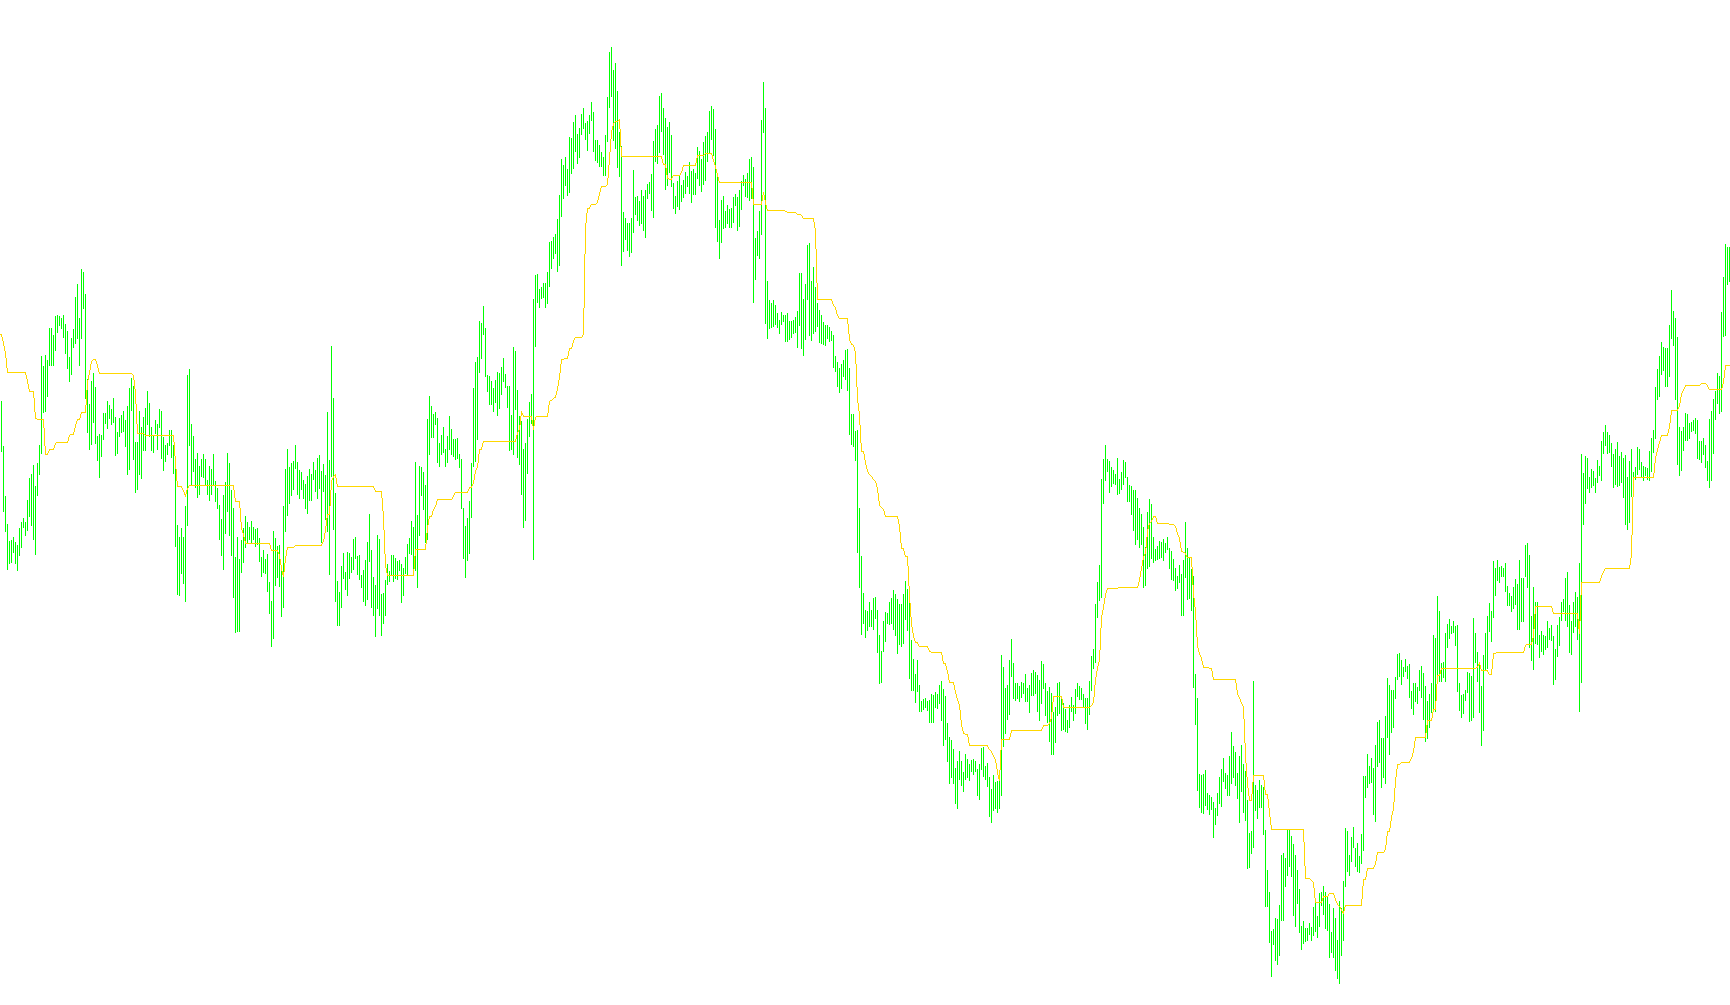
This technical indicator is designed to identify and visualize the Kijun-sen line, a core component of the Ichimoku Kinko Hyo charting system. Its primary purpose is to provide traders with a clear visual representation of the equilibrium point of price action over a specific period, helping to determine the medium-term trend direction.
Core Logic and Functionality
The script operates by calculating a moving average based on the highest highs and lowest lows reached within a defined timeframe (set by the "Kijun" parameter). Unlike a simple moving average that averages every closing price, this indicator looks for the extremes of price movement:
- Range Identification: The tool scans a historical window of price bars to find the single highest point and the single lowest point.
- Midpoint Calculation: It then calculates the exact middle point between that high and low. This "midpoint" represents the average price level for that specific period.
- Visual Smoothing: By plotting these midpoints sequentially, the indicator creates a continuous line on your chart.
Key Features for Traders
Trend Identification The line acts as a dynamic baseline. When the price is consistently trading above this line, it often suggests an upward trend; when trading below, it suggests a downward trend. It helps traders distinguish between active market momentum and periods of consolidation.
Dynamic Shifting The script includes a "Shift" parameter. This allows the indicator to be projected slightly forward or backward on the chart. This is useful for aligning the visual data with specific technical analysis techniques, ensuring that the line appears exactly where it is needed for decision-making.
Real-Time Responsiveness The logic is built to update automatically as new price data arrives. It ensures that the most recent calculation is always accurate based on the very latest market highs and lows, providing a current "fair value" perspective of the market's behavior.
//+------------------------------------------------------------------+
//|                                                    Kijun-sen.mq4 |
//|                                     Copyright © 2004, AlexSilver |
//|                                                  http://viac.ru/ |
//+------------------------------------------------------------------+
#property copyright "Copyright © 2004, AlexSilver"
#property link      "http://viac.ru/"

#property indicator_chart_window
#property indicator_buffers 1
#property indicator_color1 DeepSkyBlue
//---- input parameters
extern int Kijun=26;
extern int ShiftKijun=3;
//---- buffers
double Kijun_Buffer[];
//----
int a_begin;
//+------------------------------------------------------------------+
//| Custom indicator initialization function                         |
//+------------------------------------------------------------------+
int init()
  {
//----
   SetIndexStyle(0,DRAW_LINE);
   SetIndexBuffer(0,Kijun_Buffer);
   SetIndexDrawBegin(0,Kijun+ShiftKijun-1);
   SetIndexShift(0,ShiftKijun);
   SetIndexLabel(0,"Kijun Sen+");
//----
   return(0);
  }
//+------------------------------------------------------------------+
//| Ichimoku Kinko Hyo Kijun-sen Only                                |
//+------------------------------------------------------------------+
int start()
  {
   int    i,k;
   int    counted_bars=IndicatorCounted();
   double high,low,price;
//----
   if(Bars<=Kijun) return(0);
//---- initial zero
   if(counted_bars<1)
     {
      for(i=1;i<=Kijun;i++)     Kijun_Buffer[Bars-i]=0;
     }
//---- Kijun Sen
   i=Bars-Kijun;
   if(counted_bars>Kijun) i=Bars-counted_bars-1;
   while(i>=0)
     {
      high=High[i]; low=Low[i]; k=i-1+Kijun;
      while(k>=i)
        {
         price=High[k];
         if(high<price) high=price;
         price=Low[k];
         if(low>price) low=price;
         k--;
        }
      Kijun_Buffer[i+ShiftKijun]=(high+low)/2;
      i--;
     } i=ShiftKijun-1;
   while(i>=0)
     {
      high=High[0]; low=Low[0]; k=Kijun-ShiftKijun+i;
      while(k>=0)
        {
         price=High[k];
         if(high<price) high=price;
         price=Low[k];
         if(low>price) low=price;
         k--;
        }
      Kijun_Buffer[i]=(high+low)/2;
      i--;
     }
   }
//+------------------------------------------------------------------+
Comments