Kijun-Sen
Download script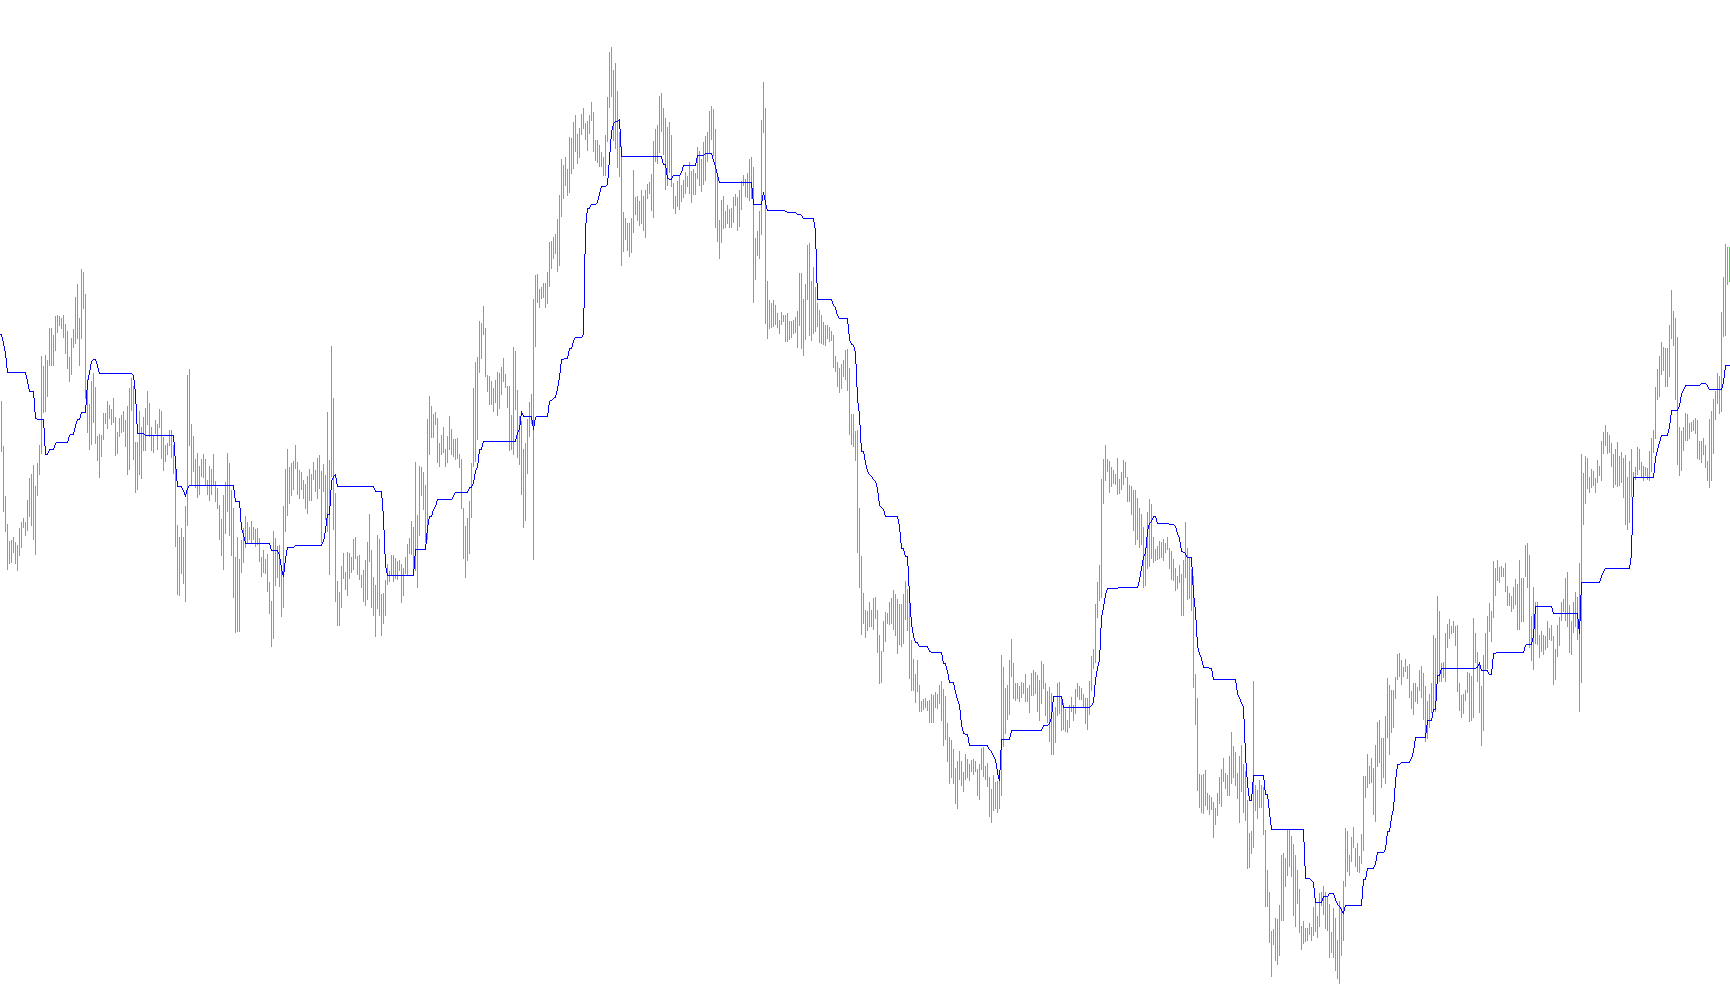
This script is designed to act as a specialized visual tool for traders, specifically by calculating and plotting a key component of the "Ichimoku Kinko Hyo" technical analysis system. Rather than showing every complex line of the full Ichimoku indicator, this specific logic focuses exclusively on identifying and displaying the Kijun-sen, which is often interpreted as the "base line."
How the Logic Works
The script operates by analyzing historical price data to determine the equilibrium point of the market over a specific period. Here is the step-by-step breakdown of how it processes that information:
- Data Collection Window: The script looks back at a defined set of recent price candles (based on the "Kijun" parameter). It essentially creates a "look-back" window to see what happened during that specific timeframe.
- Finding Extremes: For every point on the chart, the logic scans through those previous candles to find two critical values: the highest price reached (the peak) and the lowest price reached (the valley) within that timeframe.
- Calculating the Midpoint: Once it identifies the highest high and the lowest low of the period, it calculates the mathematical average of those two numbers. This resulting value represents the "midpoint" or the fair price for that window of time.
- Projecting the Line: The script then takes this midpoint and plots it onto your chart. It includes a "Shift" feature, which allows the line to be moved forward in time. This helps traders see the current equilibrium relative to where the price is heading now, rather than just where it has already been.
Purpose for the Trader
The goal of this logic is to provide a visual representation of market balance. By identifying the midpoint of recent price action, the script helps users see where the "average" price sits. In technical analysis, when the market price moves significantly above or below this line, it often signals a change in momentum or a potential trend reversal, allowing you to see the "baseline" of the market's behavior at a glance.
//+------------------------------------------------------------------+
//|                                                     Ichimoku.mq4 |
//|                      Copyright © 2004, MetaQuotes Software Corp. |
//|                      Copyright © 2004, AlexSilver â ïëàíå +      |
//|                                       http://www.metaquotes.net/ |
//|                                       http://www.viac.ru/        |
//+------------------------------------------------------------------+
#property copyright "Copyright © 2004, AlexSilver â ïëàíå +"
#property link      "http://www.viac.ru/"

#property indicator_chart_window
#property indicator_buffers 2
#property indicator_color1 Red
#property indicator_color2 Blue
//---- input parameters
extern int Kijun=26;
extern int KijunShift=9;
//---- buffers
double Kijun_Buffer[];
//----
//+------------------------------------------------------------------+
//| Custom indicator initialization function                         |
//+------------------------------------------------------------------+
int init()
  {
//---- Âûâîä Kijun-sen
   SetIndexStyle(1,DRAW_LINE);
   SetIndexBuffer(1,Kijun_Buffer);
   SetIndexDrawBegin(1,Kijun+KijunShift-1);
   SetIndexShift(1,KijunShift);
   SetIndexLabel(1,"Kijun Sen");
//----
   return(0);
  }
//+------------------------------------------------------------------+
//| Ichimoku Kinko Hyo                                               |
//+------------------------------------------------------------------+
int start()
  {
   int    i,k;
   double u=0;
   int    counted_bars=IndicatorCounted();
   double high,low,price;
//----
   if(Bars<=Kijun) return(0);
//---- initial zero
   if(counted_bars<1)
     {
      for(i=1;i<=Kijun;i++)     Kijun_Buffer[Bars-i]=0;
     }

//---- Kijun Sen
   i=Bars-Kijun;
   if(counted_bars>Kijun) i=Bars-counted_bars-1;
   while(i>=0)
     {
      high=High[i]; low=Low[i]; k=i-1+Kijun;
      while(k>=i)
        {
         price=High[k];
         if(high<price) high=price;
         price=Low[k];
         if(low>price) low=price;
         k--;
        }
      Kijun_Buffer[i+KijunShift]=(high+low)/2;
      i--;
     } i=KijunShift-1;
   while(i>=0)
     {
      high=High[0]; low=Low[0]; k=Kijun-KijunShift+i;
      while(k>=0)
        {
         price=High[k];
         if(high<price) high=price;
         price=Low[k];
         if(low>price) low=price;
         k--;
        }
      Kijun_Buffer[i]=(high+low)/2;

      i--;
     }
//----
   return(0);
  }
//+------------------------------------------------------------------+
Comments