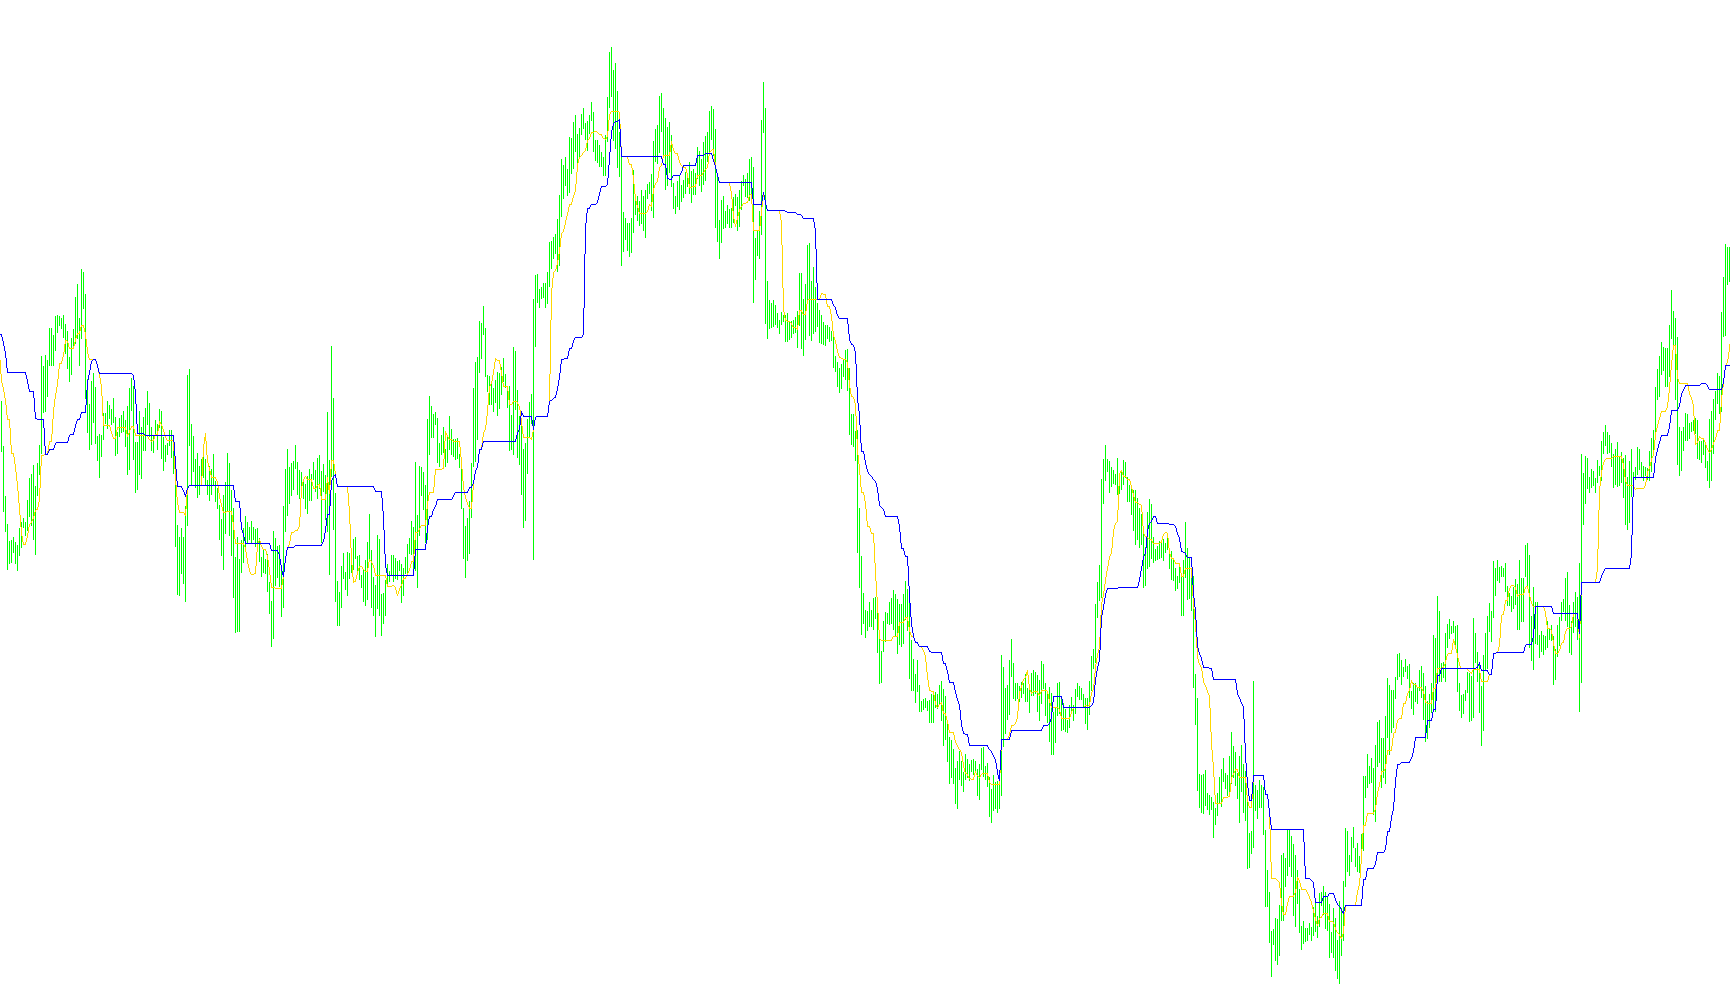
This script is designed to automatically calculate and visualize two primary components of the Ichimoku Kinko Hyo technical analysis system on a trading chart. Its purpose is to help traders identify momentum and potential price trends by plotting two specific moving lines: the Tenkan-sen (Conversion Line) and the Kijun-sen (Base Line).
Core Logic and Functionality
The script operates by analyzing historical price data—specifically the highest highs and lowest lows over fixed periods—to determine where the "equilibrium" of the market lies. Here is a breakdown of how it processes this information:
1. Data Processing and Timeframes The tool looks back at specific windows of time (defined by the Tenkan and Kijun parameters). Instead of using a simple average of all closing prices, it focuses on the extremes of the price movement within those windows. It identifies the highest point reached and the lowest point dropped during those periods to find the midpoint.
2. The Tenkan-sen (Conversion Line) This is the faster-moving component of the indicator. The script calculates this line by finding the midpoint between the highest high and the lowest low over a short, defined period (defaulting to 9 units). It is designed to react quickly to recent price changes, making it useful for identifying short-term momentum.
3. The Kijun-sen (Base Line) This is the slower-moving, more stable component. The script calculates this by finding the midpoint of the highest high and lowest low over a much longer period (defaulting to 26 units). Because it covers a larger timeframe, it provides a clearer picture of the broader market trend and acts as a primary "base" for price action.
4. Visual Offsets (Shifting) One unique feature of this script's logic is the "Shift" mechanism. It doesn't just plot the calculated midpoints exactly where they occur; it pushes the lines forward on the chart (by 3 units for Tenkan and 9 units for Kijun). This visual displacement is a standard part of the Ichimoku methodology, intended to align the indicator data more accurately with current market movements.
Summary for the User
In simple terms, this script eliminates the need for manual calculation by scanning your chart's history. It identifies the "middle ground" of price swings over both short and long durations and draws two lines on your screen. Traders typically use these two lines to see if the price is accelerating (momentum) or stabilizing (trend), with the relationship between the red and blue lines providing clues on whether the market is trending up, down, or moving sideways.
//+------------------------------------------------------------------+
//|                                                     Ichimoku.mq4 |
//|                      Copyright © 2004, MetaQuotes Software Corp. |
//|                      Copyright © 2004, AlexSilver â ïëàíå +      |
//|                                       http://www.metaquotes.net/ |
//|                                       http://www.viac.ru/        |
//+------------------------------------------------------------------+
#property copyright "Copyright © 2004, AlexSilver â ïëàíå +"
#property link      "http://www.viac.ru/"

#property indicator_chart_window
#property indicator_buffers 2
#property indicator_color1 Red
#property indicator_color2 Blue
//---- input parameters
extern int Tenkan=9;
extern int Kijun=26;
extern int TenkanShift=3;
extern int KijunShift=9;
//---- buffers
double Tenkan_Buffer[];
double Kijun_Buffer[];
//----
//+------------------------------------------------------------------+
//| Custom indicator initialization function                         |
//+------------------------------------------------------------------+
int init()
  {
//---- Âûâîä Tenkan-sen
   SetIndexStyle(0,DRAW_LINE);
   SetIndexBuffer(0,Tenkan_Buffer);
   SetIndexDrawBegin(0,Tenkan+TenkanShift-1);
   SetIndexShift(0,TenkanShift);
   SetIndexLabel(0,"Tenkan Sen");
//---- Âûâîä Kijun-sen
   SetIndexStyle(1,DRAW_LINE);
   SetIndexBuffer(1,Kijun_Buffer);
   SetIndexDrawBegin(1,Kijun+KijunShift-1);
   SetIndexShift(1,KijunShift);
   SetIndexLabel(1,"Kijun Sen");
//----
   return(0);
  }
//+------------------------------------------------------------------+
//| Ichimoku Kinko Hyo                                               |
//+------------------------------------------------------------------+
int start()
  {
   int    i,k;
   int    counted_bars=IndicatorCounted();
   double high,low,price;
//----
   if(Bars<=Tenkan || Bars<=Kijun) return(0);
//---- initial zero
   if(counted_bars<1)
     {
      for(i=1;i<=Tenkan;i++)    Tenkan_Buffer[Bars-i]=0;
      for(i=1;i<=Kijun;i++)     Kijun_Buffer[Bars-i]=0;
     }
//---- Tenkan Sen
   i=Bars-Tenkan;
   if(counted_bars>Tenkan) i=Bars-counted_bars-1;
   while(i>=0)
     {
      high=High[i]; low=Low[i]; k=i-1+Tenkan;
      while(k>=i)
        {
         price=High[k];
         if(high<price) high=price;
         price=Low[k];
         if(low>price)  low=price;
         k--;
        }
      Tenkan_Buffer[i+TenkanShift]=(high+low)/2;
      i--;
     } i=TenkanShift-1;
   while(i>=0)
     {
      high=High[0]; low=Low[0]; k=Tenkan-TenkanShift-1+i;
      while(k>=0)
        {
         price=High[k];
         if(high<price) high=price;
         price=Low[k];
         if(low>price) low=price;
         k--;
        }
      Tenkan_Buffer[i]=(high+low)/2;
      i--;
     }
//---- Kijun Sen
   i=Bars-Kijun;
   if(counted_bars>Kijun) i=Bars-counted_bars-1;
   while(i>=0)
     {
      high=High[i]; low=Low[i]; k=i-1+Kijun;
      while(k>=i)
        {
         price=High[k];
         if(high<price) high=price;
         price=Low[k];
         if(low>price) low=price;
         k--;
        }
      Kijun_Buffer[i+KijunShift]=(high+low)/2;
      i--;
     } i=KijunShift-1;
   while(i>=0)
     {
      high=High[0]; low=Low[0]; k=Kijun-KijunShift-1+i;
      while(k>=0)
        {
         price=High[k];
         if(high<price) high=price;
         price=Low[k];
         if(low>price) low=price;
         k--;
        }
      Kijun_Buffer[i]=(high+low)/2;
      i--;
     }
//----
   return(0);
  }
//+------------------------------------------------------------------+
Comments