KiS_Avg_v2
Download script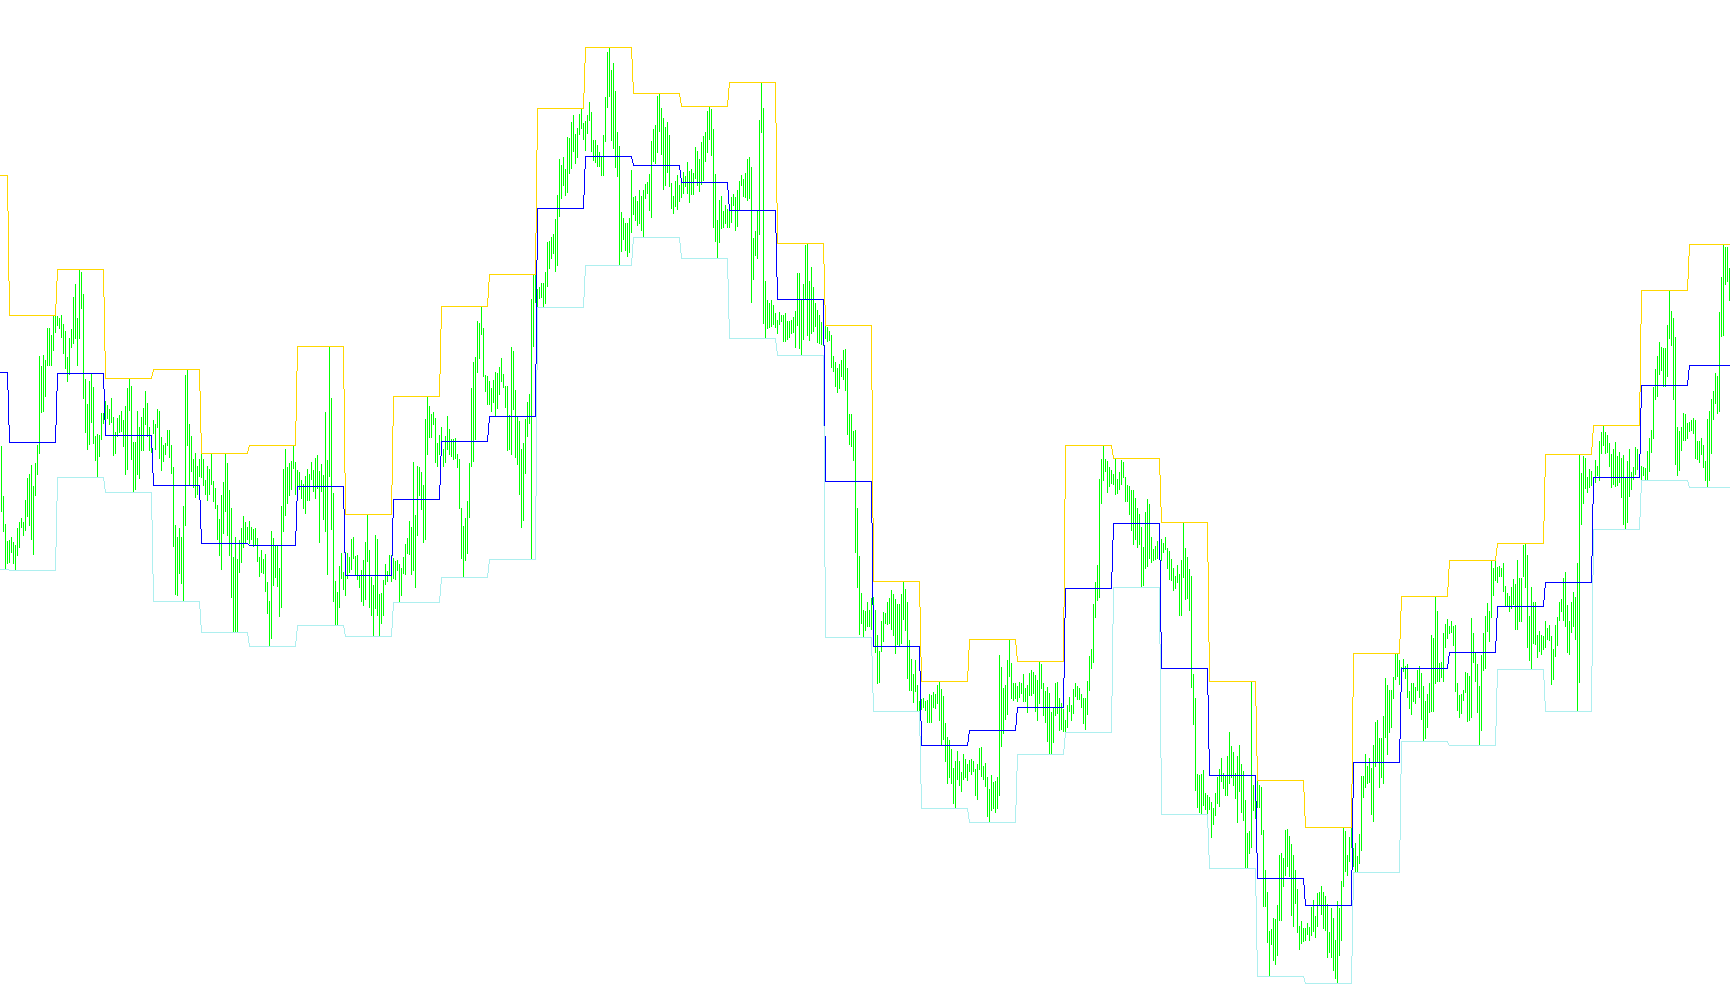
This script is designed to analyze daily price movements on a trading chart by identifying and visualizing three key data points: the highest high, the lowest low, and the mathematical average of those two extremes. By processing these values, it provides a clearer picture of the overall range and "center" of price action for any given day.
How the Logic Works
The script scans through your historical price data and organizes it based on calendar days. Here is the step-by-step breakdown of what it does:
1. Daily Range Detection The script monitors every price candle as it passes. It looks specifically for the highest point reached (Maximum) and the lowest point reached (Minimum) within each specific day. This allows you to see the total "swing" of the market from its peak to its trough.
2. Midpoint Calculation Once the high and low for a day are established, the script calculates the midpoint—the exact halfway mark between those two prices. This serves as a visual anchor for the "average" level of that day's volatility.
3. Visual Mapping The results are plotted back onto your chart as three distinct lines:
- Top Line: Represents the maximum price reached during the day.
- Middle Line: Represents the calculated average (the midpoint).
- Bottom Line: Represents the minimum price reached during the day.
4. Real-Time Data Display In addition to drawing these lines on your chart, the script provides a live text summary in the corner of your screen. This real-time dashboard displays:
- The exact Maximum and Minimum prices for the current day.
- The calculated Average price.
- The Width (the total distance between the high and low in points).
- The Distance from Open: It tells you how far the current average is from where the day started (the opening price).
- The Distance from Close: It shows how far the current average is from the most recent closing price.
Summary for Traders
Essentially, this tool removes the "noise" of minor price fluctuations and highlights the core boundaries of the day's trading session. It helps you quickly identify where the heaviest action occurred and provides a mathematical reference point to see if the current price is trading significantly above or below the daily average.
//+------------------------------------------------------------------+
//| KiS_max_min_Avg.mq4                                              |
//+------------------------------------------------------------------+
/*
Name := KiS_max_min_Avg
Author := KCBT
Link := http://www.kcbt.ru/forum/index.php?
*/
#property indicator_chart_window
#property indicator_buffers 3
#property indicator_color1 MediumOrchid
#property indicator_color2 Aqua
#property indicator_color3 MediumOrchid
//---- indicator buffers
double ExtMapBuffer1[];
double ExtMapBuffer2[];
double ExtMapBuffer3[];
//+------------------------------------------------------------------+
//| Custom indicator initialization function                         |
//+------------------------------------------------------------------+
int init()
  {
   SetIndexBuffer(0, ExtMapBuffer1);
   SetIndexStyle(0, DRAW_LINE);
   SetIndexBuffer(1, ExtMapBuffer2);
   SetIndexStyle(1, DRAW_LINE);
   SetIndexBuffer(2, ExtMapBuffer3);
   SetIndexStyle(2, DRAW_LINE);
   return(0);
  }
//+------------------------------------------------------------------+
//| Custom indicator deinitialization function                       |
//+------------------------------------------------------------------+
int deinit()
  {
   Comment("");
   return(0);
  }
//+------------------------------------------------------------------+
//| Custom indicator iteration function                              |
//+------------------------------------------------------------------+
int start()
  {
   int shift, i, CurDay, BarCount;
   double DayMax, DayMin;
   double DayOpen, DayClose, Avg;
//----
     for(shift=Bars-1; shift>=0; shift--)
     {
        if (CurDay!=TimeDay(Time[shift]))
        {
           for(i=BarCount; i>=0; i--)
           {
            ExtMapBuffer1[shift+i]=DayMax;
            ExtMapBuffer2[shift+i]=(DayMax+DayMin)/2;
            ExtMapBuffer3[shift+i]=DayMin;
           }
         CurDay=TimeDay(Time[shift]);
         BarCount=0;
         DayMax=0;
         DayMin=1000; //Çàðàíåå áîëüøå, ÷òîá óìåíüøèëñÿ â ïðîöåññå
         DayOpen=Open[shift];
        }
      if (DayMax < High[shift]) {DayMax=High[shift];}
      if (DayMin > Low[shift]) {DayMin=Low[shift];}
      BarCount=BarCount + 1;
     }
   // ýòî äîðèñîâêà ïîñëåäíåãî, íåçàâåðøåííîãî åùå, äíÿ
     for(i=BarCount; i>=0; i--)
     {
      ExtMapBuffer1[shift+i]=DayMax;
      ExtMapBuffer2[shift+i]=(DayMax+DayMin)/2;
      ExtMapBuffer3[shift+i]=DayMin;
     }
   DayClose=Close[0];
   Avg=(DayMax+DayMin)/2; //ñðåäíÿÿ çà òåêóùèé äåíü
//----
   Comment("Max:", DayMax," Min:", DayMin, "\n", "Avg:", Avg, " Width:", (DayMax-DayMin)/Point,"\n","Îò Avg äî Open:",MathRound(MathAbs(Avg-DayOpen)/Point),"\n","Îò Avg äî Close:",MathRound(MathAbs(Avg-DayClose)/Point));
   return(0);
  }
//+------------------------------------------------------------------+
Comments