Keltner_ChannelsAlert
Download script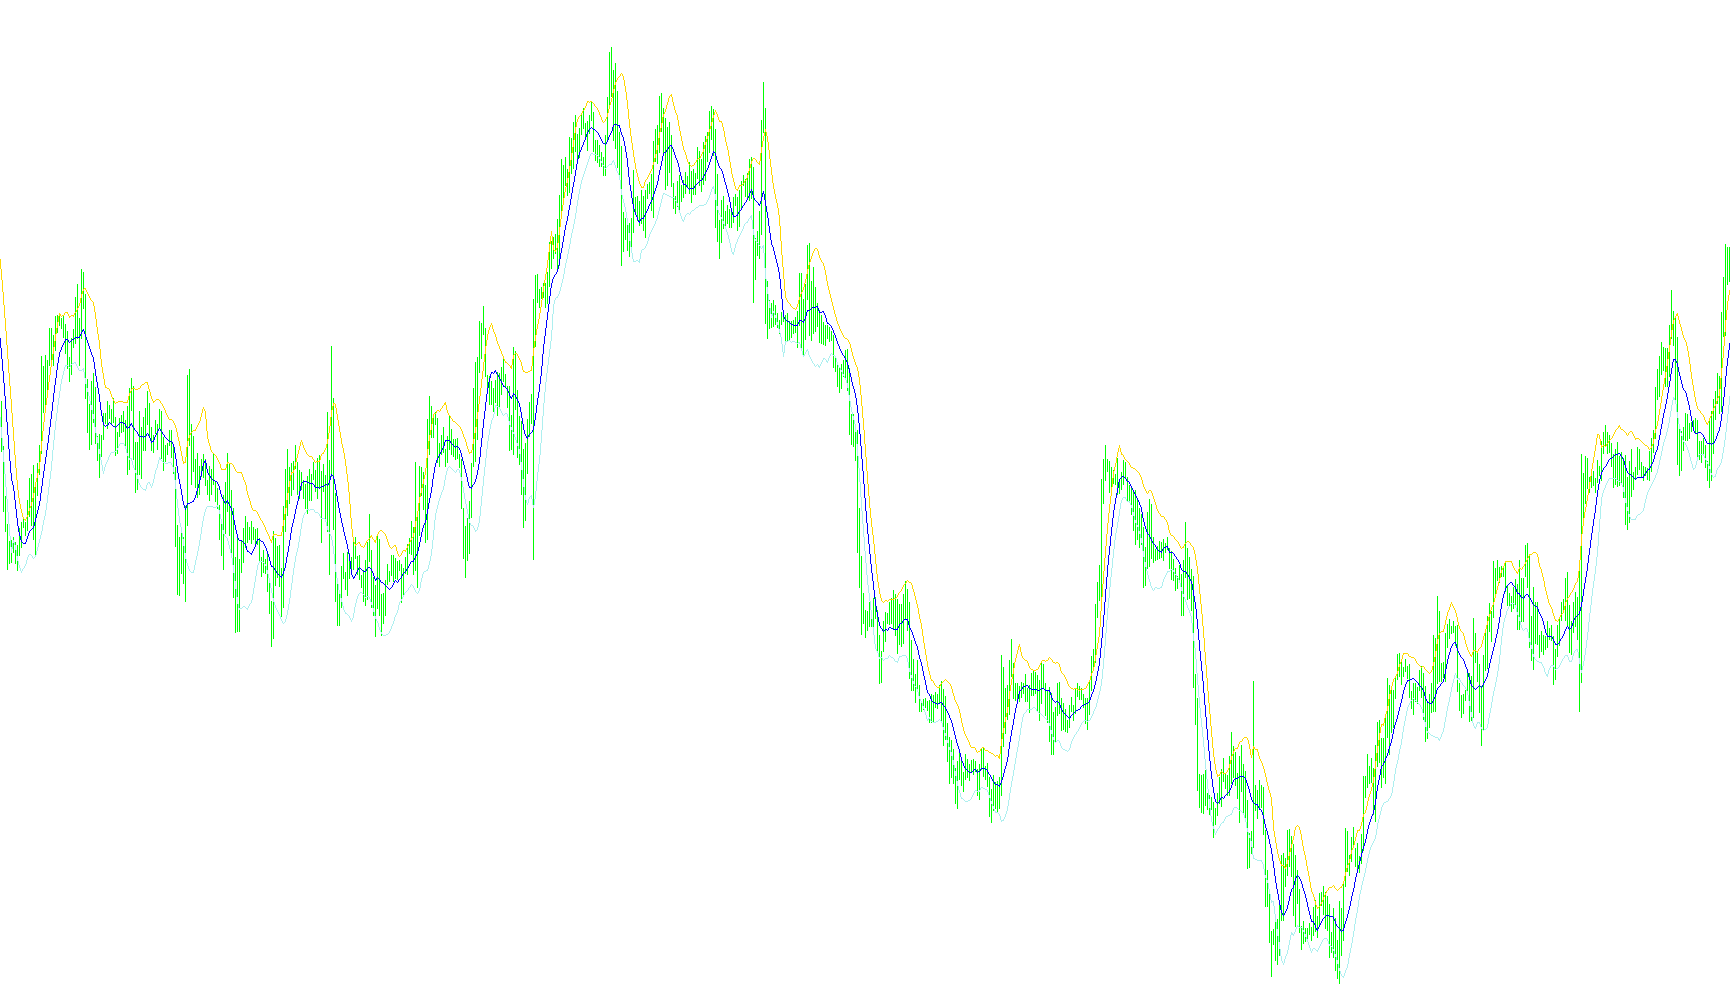
This script is designed to function as a visual and auditory trading assistant that monitors price movement by using a technical analysis tool known as the Keltner Channels. Its primary goal is to identify when the market price moves outside of its "normal" expected range, signaling potential breakouts or trend shifts.
How the Indicator Works
The script works by drawing three distinct lines on your trading chart:
- The Middle Line: This represents the average price over a specific period (which you can customize). It acts as the "baseline" for the market's current movement.
- The Upper and Lower Channels: These lines are calculated by taking the middle baseline and adding or subtracting a value based on the market's recent volatility (the distance between the highest and lowest prices reached during a set timeframe).
Essentially, these three lines create a "tunnel" on your chart. When the price stays inside this tunnel, the market is considered to be moving within its standard range.
Automated Monitoring and Alerts
Beyond just drawing lines on your screen, this script acts as an active monitor. It constantly watches the current market price in real-time. If the price breaks through the boundaries of the "tunnel," the script triggers a series of notifications based on the following logic:
1. Breakout Above (Potential Buy Signal) If the current market price climbs above the Upper Channel, the script recognizes a potential upward breakout. It is programmed to alert you immediately via three different methods (depending on your settings):
- A specific sound file will play on your computer.
- A pop-up window will appear on your trading platform.
- An automated email will be sent to your registered address providing the symbol name and the exact time of the breakout.
2. Breakout Below (Potential Sell Signal) Conversely, if the current market price drops below the Lower Channel, the script identifies a potential downward breakout. It will trigger its own set of alerts—using different sounds and specific messaging—to notify you that the price has moved significantly lower than expected.
Key Features for the User
- Real-Time Tracking: The logic ensures that alerts are only sent once per candle (time step) to prevent your notifications from being flooded during a single price movement.
- Customizable Sensitivity: You can adjust the "period" setting to make the tunnel wider or narrower, allowing you to filter out minor market noise and focus on more significant price movements.
- Multi-Channel Notifications: It provides flexibility by allowing you to toggle sounds, pop-ups, and emails on or off based on your personal trading style.
//+------------------------------------------------------------------+
//|                                             Keltner Channels.mq4 |
//|                                                  Coded by Gilani |
//|                      Copyright © 2005, MetaQuotes Software Corp. |
//|                                        http://www.metaquotes.net |
//+------------------------------------------------------------------+
#property copyright "Copyright © 2005, MetaQuotes Software Corp."
#property link      "http://www.metaquotes.net"
//+------------------------------------------------------------------+
//| Custom indicator initialization function                         |
//+------------------------------------------------------------------+
#property indicator_chart_window
#property indicator_buffers 3
#property indicator_color1 White
#property indicator_color2 White
#property indicator_color3 White


double upper[], middle[], lower[];
extern int period = 10;

extern int SoundAlert  =    1; // 0 = disabled
extern int PopUpAlert = 1;
extern string BuySoundFile = "alert.wav";
extern string SellSoundFile = "alert2.wav";
extern int EmailAlert  =    1;
datetime prevtime = 0;


int init()
  {
   SetIndexStyle(0,DRAW_LINE);
   SetIndexShift(0,0);
   SetIndexDrawBegin(0,0);
   SetIndexBuffer(0,upper);

   SetIndexStyle(1,DRAW_LINE);
   SetIndexShift(1,0);
   SetIndexDrawBegin(1,0);
   SetIndexBuffer(1,middle);

   SetIndexStyle(2,DRAW_LINE);
   SetIndexShift(2,0);
   SetIndexDrawBegin(2,0);
   SetIndexBuffer(2,lower);

return(0);
}
int deinit(){return(0);}
int start() {
   int limit;
   int counted_bars=IndicatorCounted();
   if(counted_bars<0) return(-1);
   if(counted_bars>0) counted_bars--;
   limit=Bars-counted_bars;

   double avg;

   for(int x=0; x<limit; x++) {
      middle[x] = iMA(NULL, 0, period, 0, MODE_SMA, PRICE_CLOSE, x);
      avg  = findAvg(period, x);
      upper[x] = middle[x] + avg;
      lower[x] = middle[x] - avg;
   }
      if ((Bid >= lower[0]) && (Bid <= upper[0])) { prevtime = 0; }

      if ((Bid > upper[0]) && (prevtime != Time[0]))
       {
         prevtime = Time[0];
         if (SoundAlert != 0)PlaySound(BuySoundFile);
         if (EmailAlert != 0) SendMail("Keltner breakout above Alert for " + Symbol(), " @  Hour " + Hour() + "  Minute " + Minute());
         if (PopUpAlert != 0)Alert(Symbol(),"Keltner breakout above @  Hour ",Hour(),"  Minute ",Minute());
       }

      if ((Bid < lower[0]) && (prevtime != Time[0]))
       {
         prevtime = Time[0];
         if (SoundAlert != 0)PlaySound(SellSoundFile);
         if (EmailAlert != 0) SendMail("Keltner breakout below Alert for " + Symbol(), " @  Hour " + Hour() + "  Minute " + Minute());
         if (PopUpAlert != 0)Alert(Symbol(),"Keltner breakout below @  Hour ",Hour(),"  Minute ",Minute());
       }
   return(0);
  }
//+------------------------------------------------------------------+


   double findAvg(int period, int shift) {
      double sum=0;
      for (int x=shift;x<(shift+period);x++) {
         sum += High[x]-Low[x];
      }
      sum = sum/period;
      return (sum);
   }
Comments