Currency_Loader
Indicator

Currency_Loader

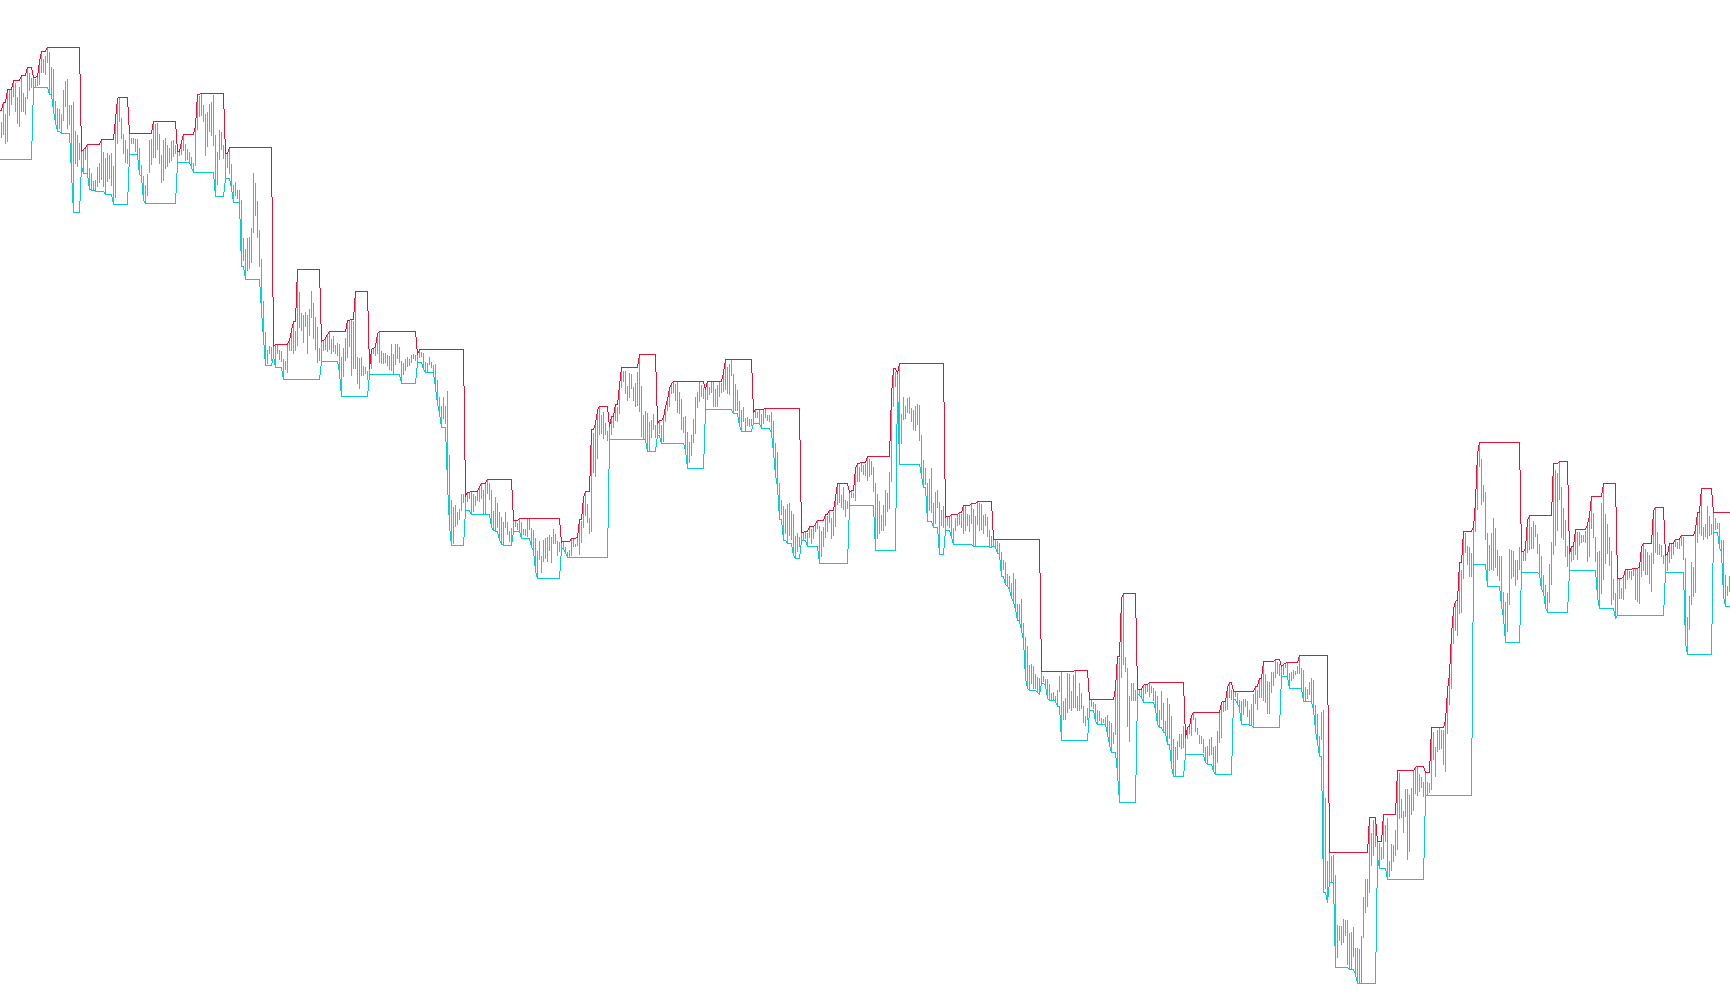
This script automatically captures and exports historical price data from various timeframes into organized CSV files for external analysis.

Indicator

currency_strenght_fast.

iMA
currency_strenght_fast[1].

Indicator

currency_strenght_fast[1].

iMA

This indicator calculates a composite weighted average of moving average differentials across multiple currency pairs to determine the synthetic strength and relative momentum of specific underlying fiat currencies.

CurrentInfo
Indicator

CurrentInfo

iATR

This indicator calculates multi-day average price ranges, current volatility metrics, and real-time account performance statistics based on daily candle data.

CustomCandle
Indicator

CustomCandle

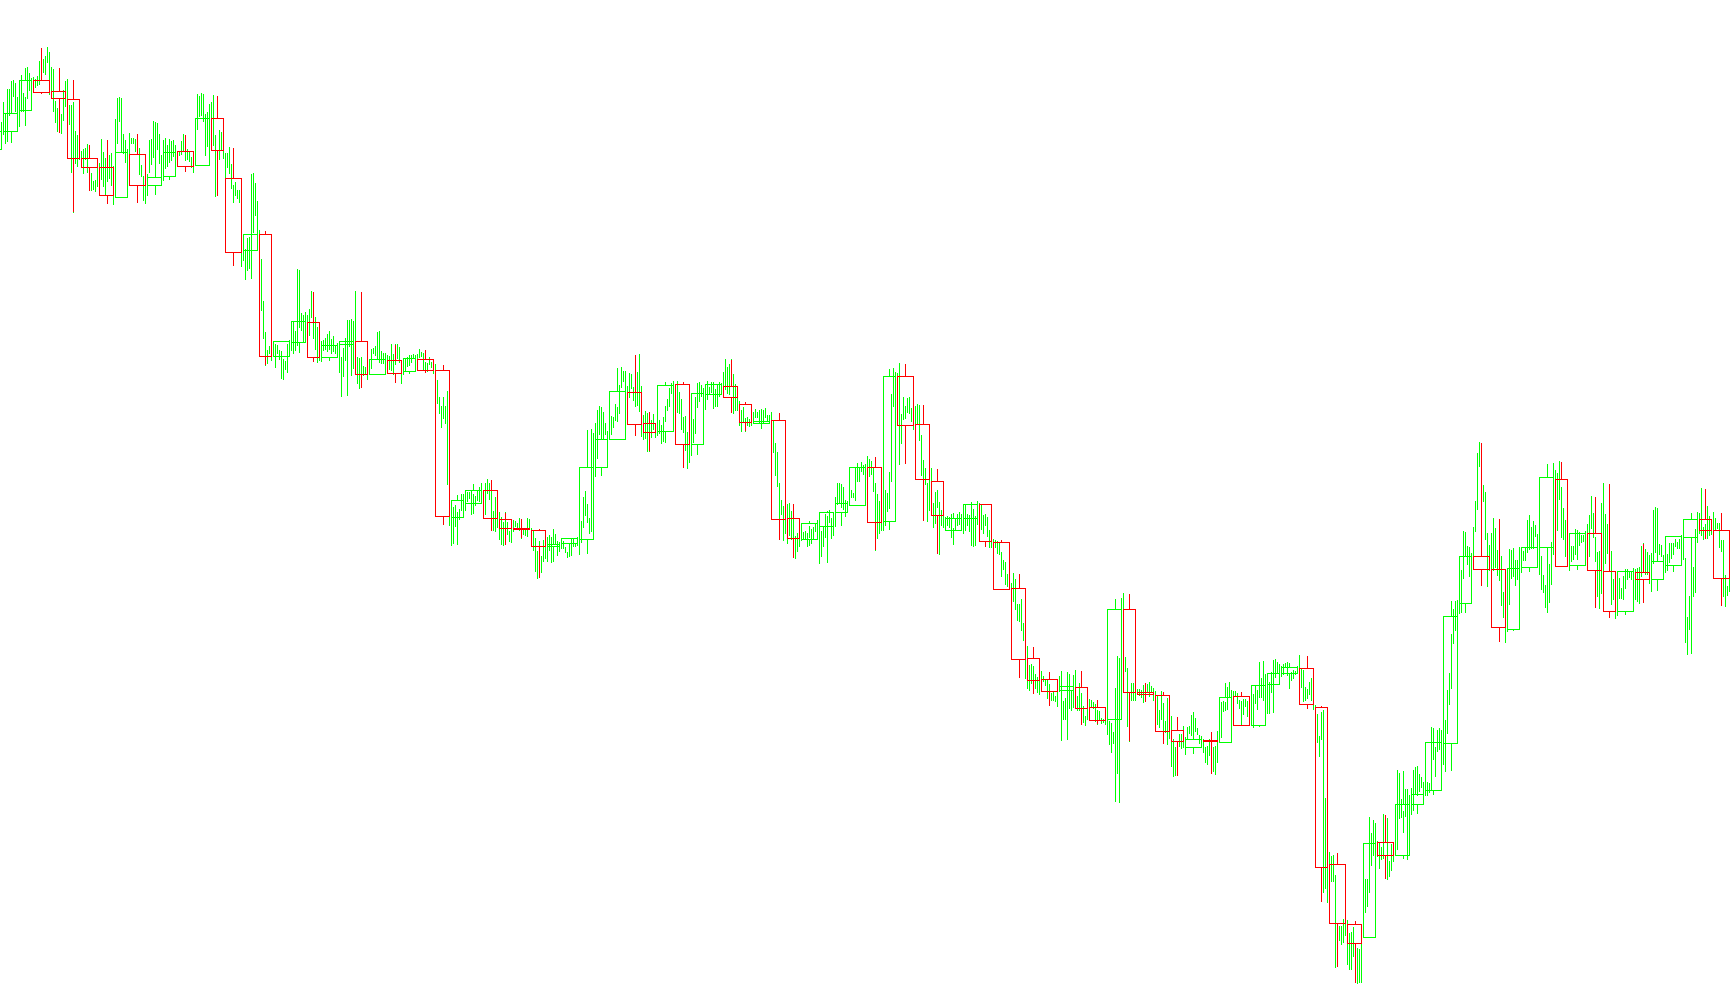
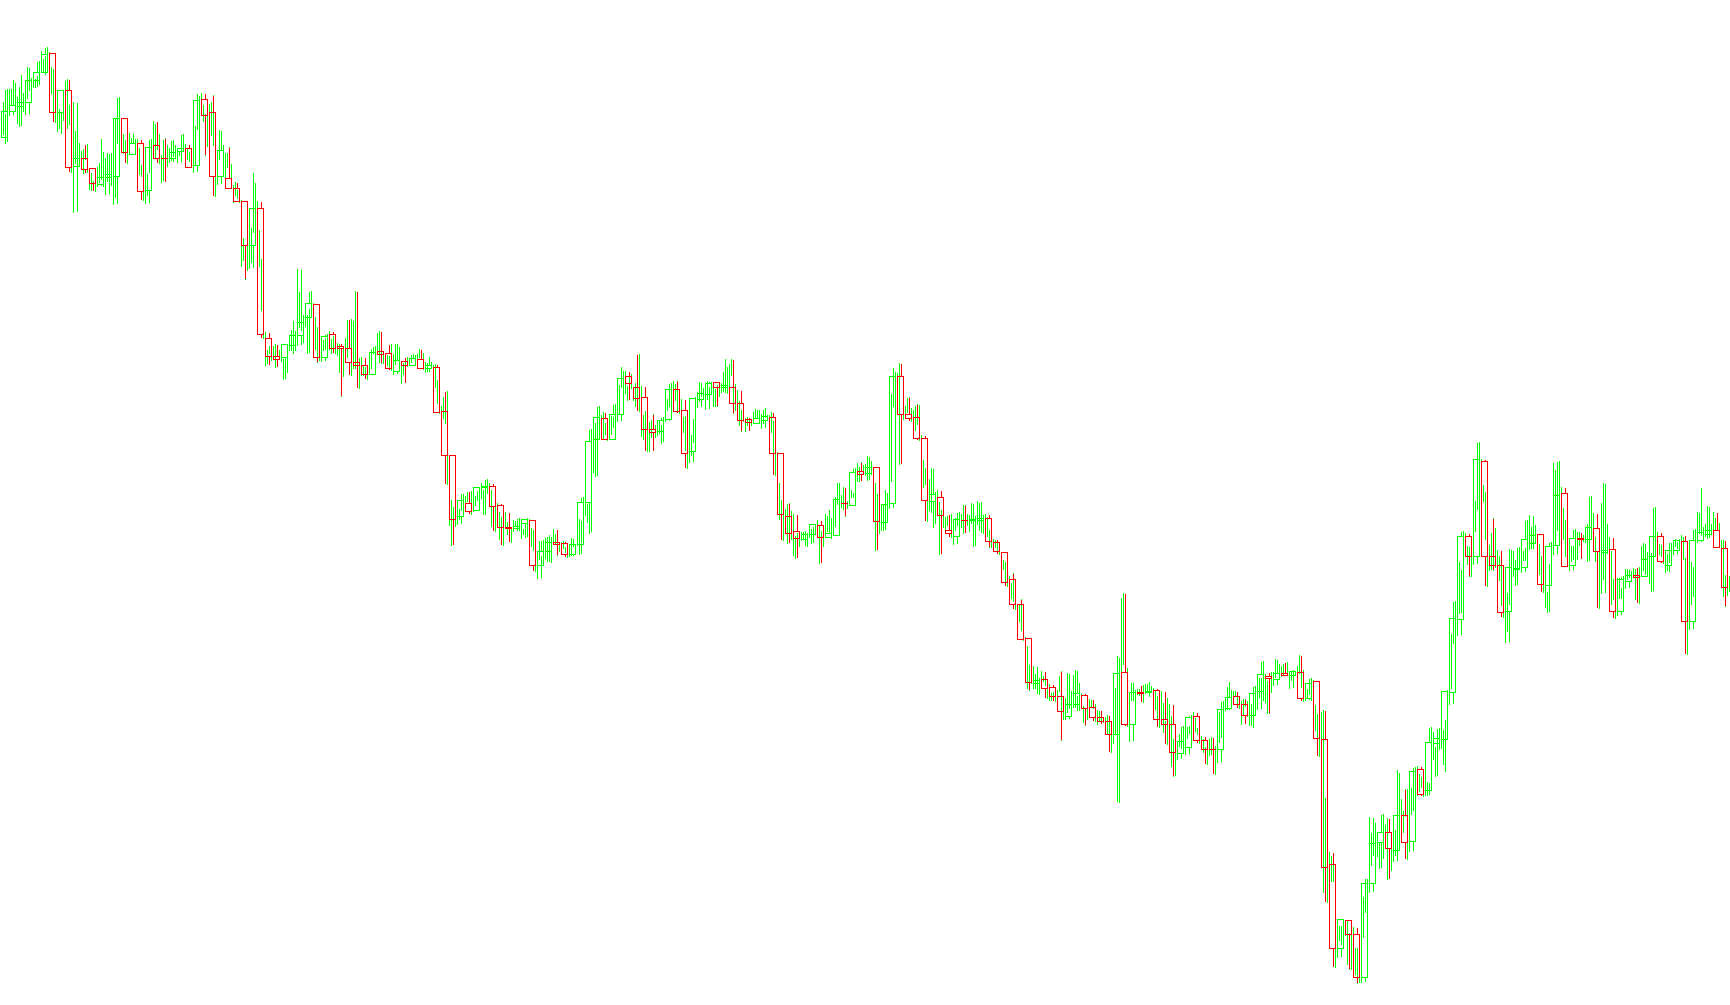
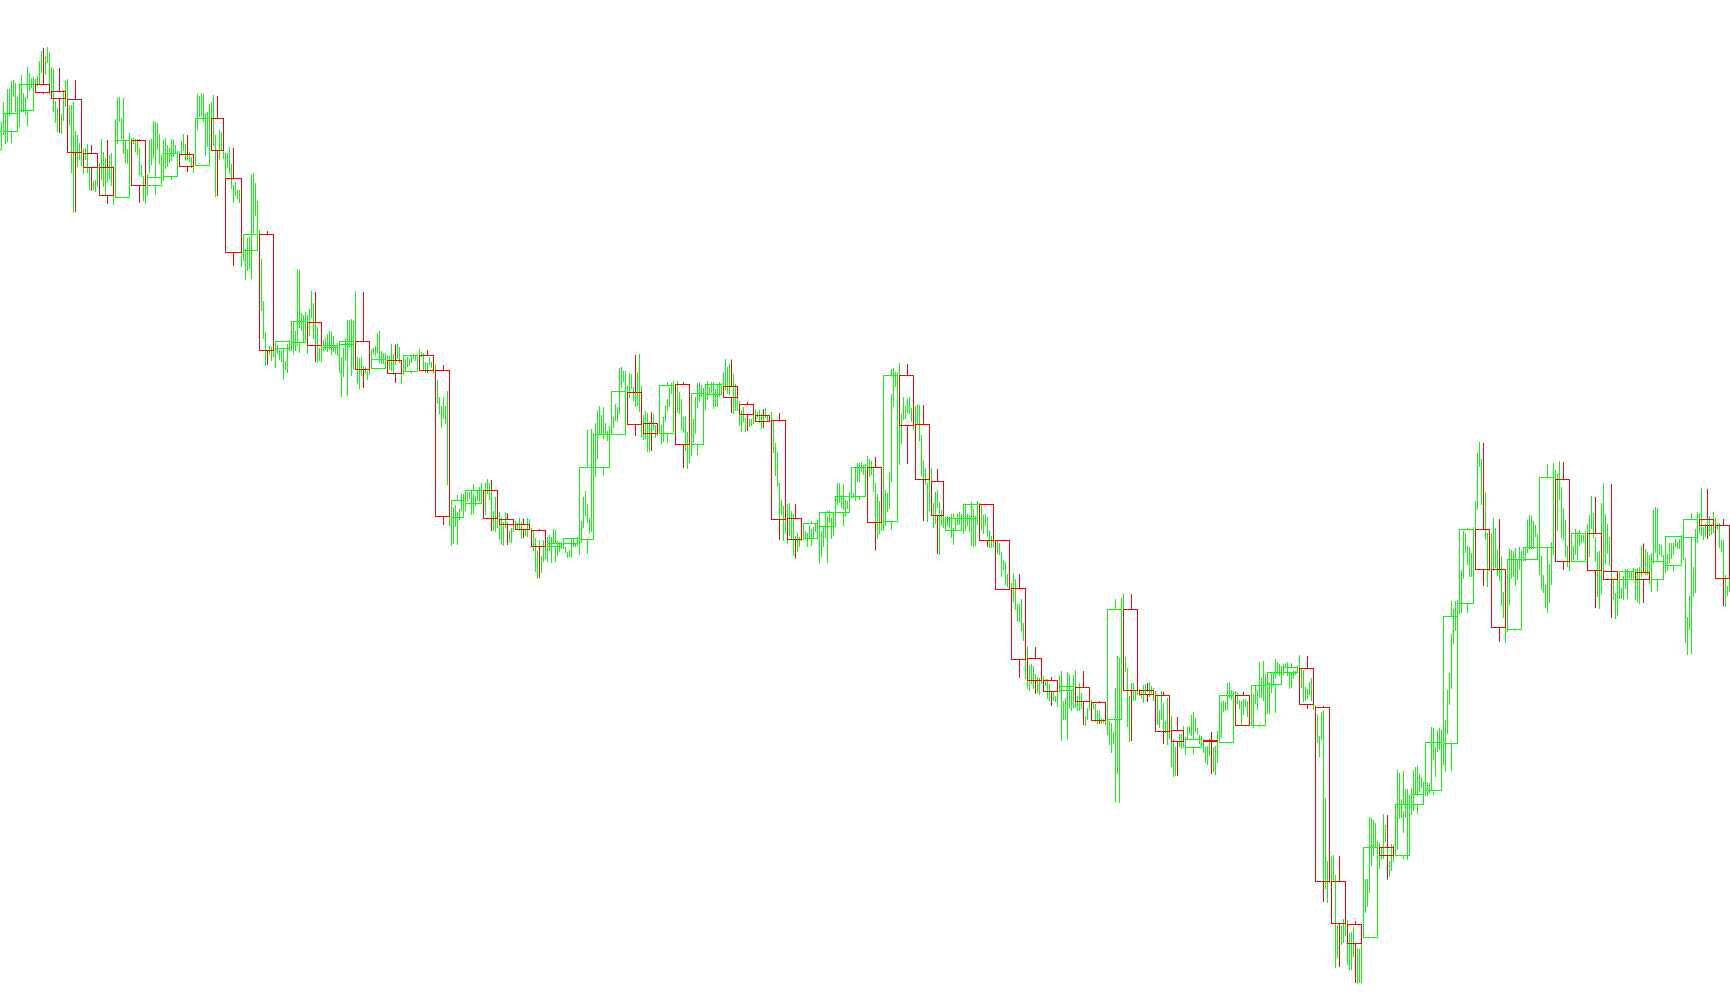
This indicator projects higher timeframe price action and candle geometries onto a lower timeframe chart by dynamically rendering historical and real-time OHLC data as geometric objects.

CustomCandleCC_Shift
Indicator

CustomCandleCC_Shift

This indicator dynamically projects higher timeframe OHLC data and price shadows onto the current chart using geometric objects to provide a multi-layered structural perspective.

CustomCandle_MTF
Indicator

CustomCandle_MTF

This indicator projects higher timeframe OHLC structures and price shadows onto the current chart to facilitate multi-temporal spatial awareness.

CustomCandle_Shift
Indicator

CustomCandle_Shift

This indicator visualizes higher timeframe price action by projecting synthetic candles and shadow extremes onto a lower timeframe chart to facilitate structural analysis.

Indicator

CustomCandle_v1

CustomCandle_v2
Indicator

CustomCandle_v2

This indicator projects visual candle structures from a higher custom timeframe onto the current chart by synthesizing OHLC data and drawing geometric wicks.

CustomRectangle
Indicator

CustomRectangle

The indicator draws a dynamic rectangle spanning from a historical candle's specific price point to the current price, with color shifts reflecting bullish or bearish momentum changes.

Cutoff
Indicator

Cutoff

Iterates through all active market positions to execute immediate closures while simultaneously purging all outstanding pending orders.

cutz_trend
Indicator

cutz_trend

iMA

This indicator identifies trend reversals by synchronizing squared price action volatility with overlapping multi-period moving average crossovers.

Cyber Cycle Oscillator
Indicator

Cyber Cycle Oscillator

This indicator utilizes a weighted median-price sequence to calculate a multi-stage smoothed second-order difference, providing a filtered view of momentum cycles.

CyberCycle
Indicator

CyberCycle

A recursive digital signal processing filter that extracts cyclic components from price midpoints by applying a smoothed autoregressive model.

CycleIdentifier
Indicator

CycleIdentifier

iMAiRSI

This indicator detects nested market fluctuations by identifying concurrent minor and major trend reversals using price action filters, zero-lag smoothing, and dynamic sweep thresholds.

CycleIdentifier2
Indicator

CycleIdentifier2

iMAiRSI

This indicator identifies nested market structural rotations by detecting multi-frequency price deviations and verifying trend persistence through Zero-Lag SMA/RSI smoothing filters.

CycleIdentifier2[LW]
Indicator

CycleIdentifier2[LW]

iMAiRSI

This indicator identifies nested market structures by detecting multi-scale price oscillations and momentum shifts through zero-lag filtering and weighted moving average sweeps.

CycleIdentifier_001
Indicator

CycleIdentifier_001

iMAiRSI

This indicator identifies nested market structures by detecting major and minor price oscillations through smoothed moving averages, zero-lag filtering, and dynamic range-based sweep thresholds.

CyclePeriod
Indicator

CyclePeriod

This algorithm utilizes digital signal processing to extract dominant oscillation frequencies from price action by calculating median phase deltas and smoothing the resulting instantaneous period.

CyclePeriod_001
Indicator

CyclePeriod_001

This indicator utilizes a sophisticated phase-difference algorithm to extract the underlying periodicity of price fluctuations by calculating median delta phases from smoothed cycles.

Cycle_KROUFR_version
Indicator

Cycle_KROUFR_version

iMA

This indicator calculates a self-adjusting stochastic value based on an adaptive time period derived from the historical frequency of moving average crossovers.

Cycle_KROUFR_version_
Indicator

Cycle_KROUFR_version_

iMA

This indicator identifies cyclical price rhythms by calculating a stochastic oscillator derived from the MACD, using a dynamic period determined by the average frequency of moving average crossovers.

Cycle_KROUFR_version_001
Indicator

Cycle_KROUFR_version_001

iMA

This indicator calculates a dynamic cycle period based on historical moving average crossover frequencies to derive a stochastic momentum value for trend identification.

Cycle_KROUFR_version_MTF
Indicator

Cycle_KROUFR_version_MTF

This indicator synchronizes and overlays three distinct timeframes of KROUFR cycle data into a single unified oscillator to visualize multi-layered market rhythm.

Indicator

D-Open Graphics

iMA
Daily FiboPivots
Indicator

Daily FiboPivots

This indicator dynamically calculates daily pivot points, support levels, and resistance zones using high-low price ranges adjusted by Fibonacci retracement ratios.

Daily Forex Signal
Indicator

Daily Forex Signal

iMACDiMAiRSIiStochastic

This indicator identifies high-probability entries by synchronizing exponential moving average trends across M30, H1, H4, and D1 timeframes with RSI and MACD momentum filters.

Indicator

daily HiLo 01

Indicator

daily HiLo 01_v1

Daily HL
Indicator

Daily HL

This indicator projects the previous trading day's peak and trough levels onto the current chart to identify historical volatility boundaries.

Daily M LEVELS
Indicator

Daily M LEVELS

This indicator calculates and plots daily pivot points along with five distinct support and resistance levels based on previous period price extremes and closing values.

Daily Open
Indicator

Daily Open

This indicator identifies and projects the specific opening price levels for both the standard daily session and the European market start time across the chart.

Daily PIVOT LEVELS
Indicator

Daily PIVOT LEVELS

This indicator calculates and plots daily support and resistance levels by deriving key price pivots from the previous day's high, low, and closing prices.

Daily Pivot
Indicator

Daily Pivot

This indicator dynamically calculates and plots standard floor pivots, extended support/resistance levels, and intermediate midpoint boundaries based on previous daily price action.

Daily Range Calculator
Indicator

Daily Range Calculator

iMA

This indicator calculates multi-period historical volatility to project potential price movement limits and determine risk-adjusted stop-loss levels based on custom reward ratios.

Daily Range Calculator_v1
Indicator

Daily Range Calculator_v1

iMA

This tool calculates multi-period daily volatility to determine dynamic price 'rooms' and projects optimal stop-loss levels based on a user-defined risk-to-reward ratio.

Daily range
Indicator

Daily range

This indicator calculates and plots daily support and resistance levels by analyzing historical price action averages from the D1 timeframe relative to current intraday volatility.

Daily-Fibo
Indicator

Daily-Fibo

This indicator automatically plots dual-directional Fibonacci retracements based on the previous day's high and low price extremes to identify key liquidity zones and reversal levels.

Daily-Weekly Open
Indicator

Daily-Weekly Open

This indicator dynamically identifies and projects horizontal price levels corresponding to the commencement of daily and weekly trading sessions.

dailybreak.
Indicator

dailybreak.

This indicator identifies the extreme price boundaries by dynamically plotting the highest highs and lowest lows over a rolling five-day period to signal potential breakout zones.

dailybreak1h
Indicator

dailybreak1h

Identifies and plots the highest price peak and lowest price trough over a rolling five-day historical window to visualize immediate support and resistance.

dailybreak4h
Indicator

dailybreak4h

Identifies the extreme price boundaries by calculating the highest highs and lowest lows over a specific historical window to pinpoint potential breakout zones.

dailybreakm1
Indicator

dailybreakm1

Identifies and plots the extreme price boundaries by calculating the highest highs and lowest lows across a user-defined rolling period of daily candles.

dailybreakm15
Indicator

dailybreakm15

Identifies and plots the extreme price boundaries established over a rolling five-day period to detect potential breakout momentum.

dailybreakm30
Indicator

dailybreakm30

Identifies and plots the extreme price levels by calculating the highest peak and lowest trough over a specific trailing timeframe.

dailybreakm5
Indicator

dailybreakm5

This indicator identifies and plots the highest peak and lowest trough across a rolling five-day historical window to pinpoint potential price breakout levels.

DailyBreakout
Indicator

DailyBreakout

This indicator identifies the previous day's high and low extremes to plot horizontal support and resistance levels with automated proximity alerts.

DailyData
Indicator

DailyData

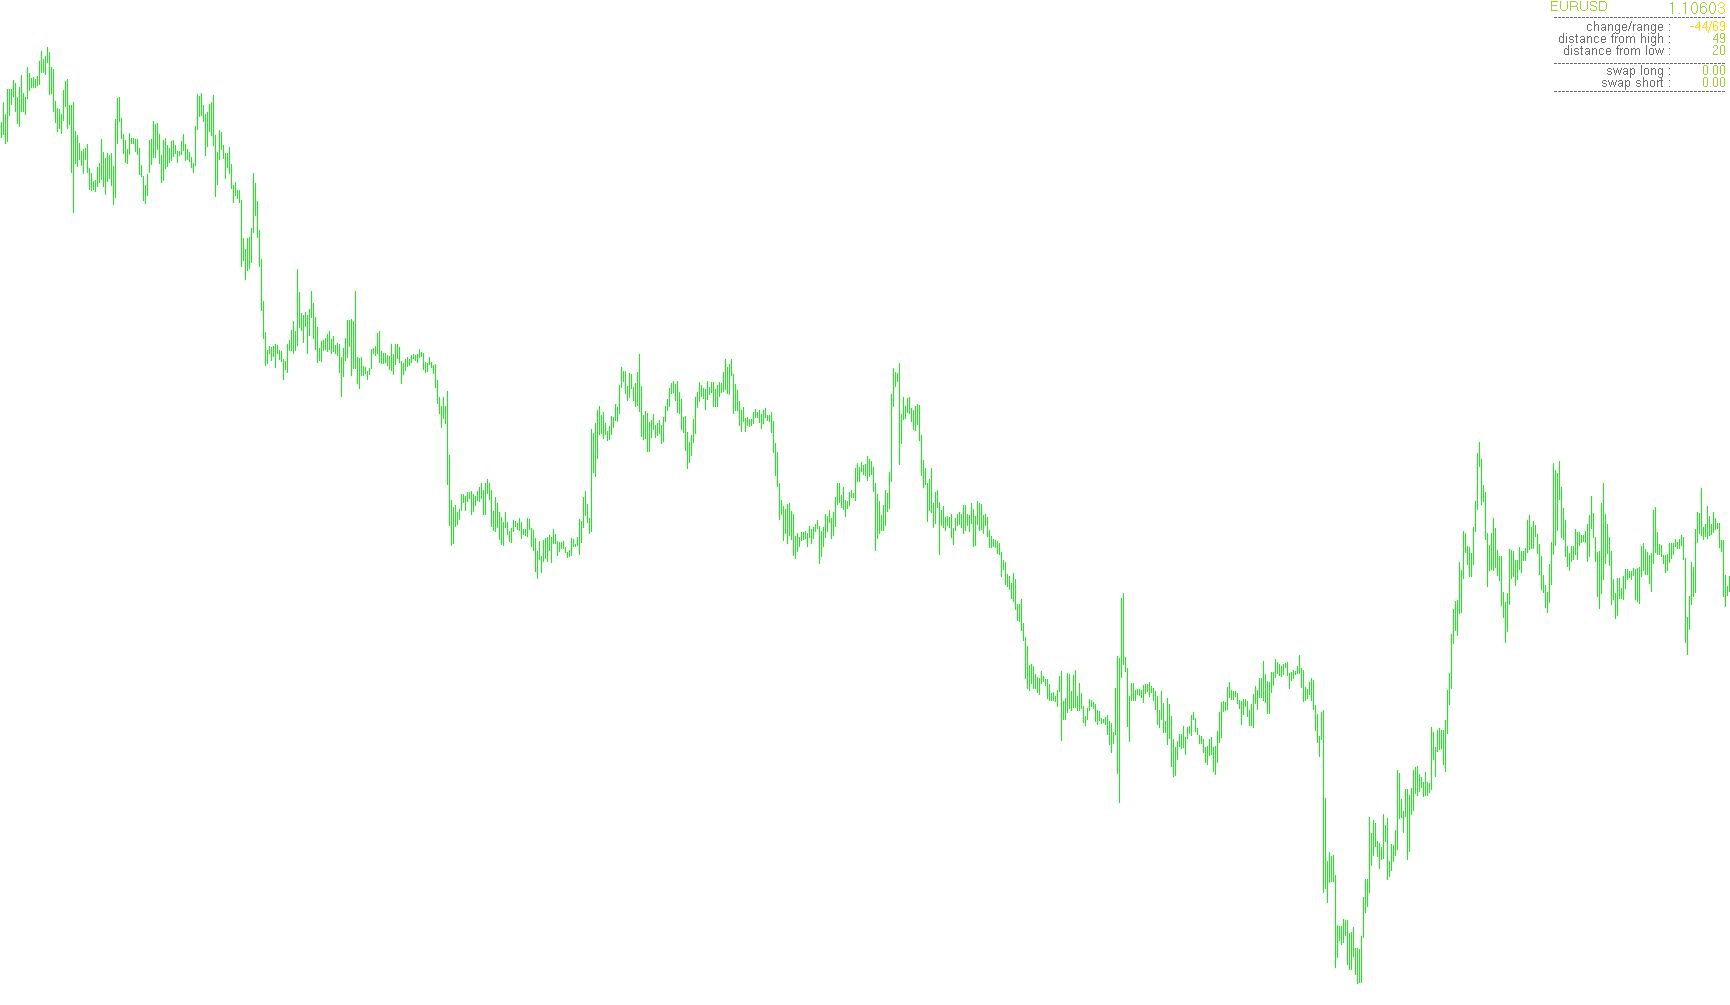
Visualizes daily price range dynamics and real-time distance metrics from high/low extremes onto sub-minute charts.

DailyHighLow
Indicator

DailyHighLow

This indicator dynamically plots the rolling session extremes by identifying and projecting the highest peak and lowest trough prices recorded within each calendar day.