dailybreak1h
Download script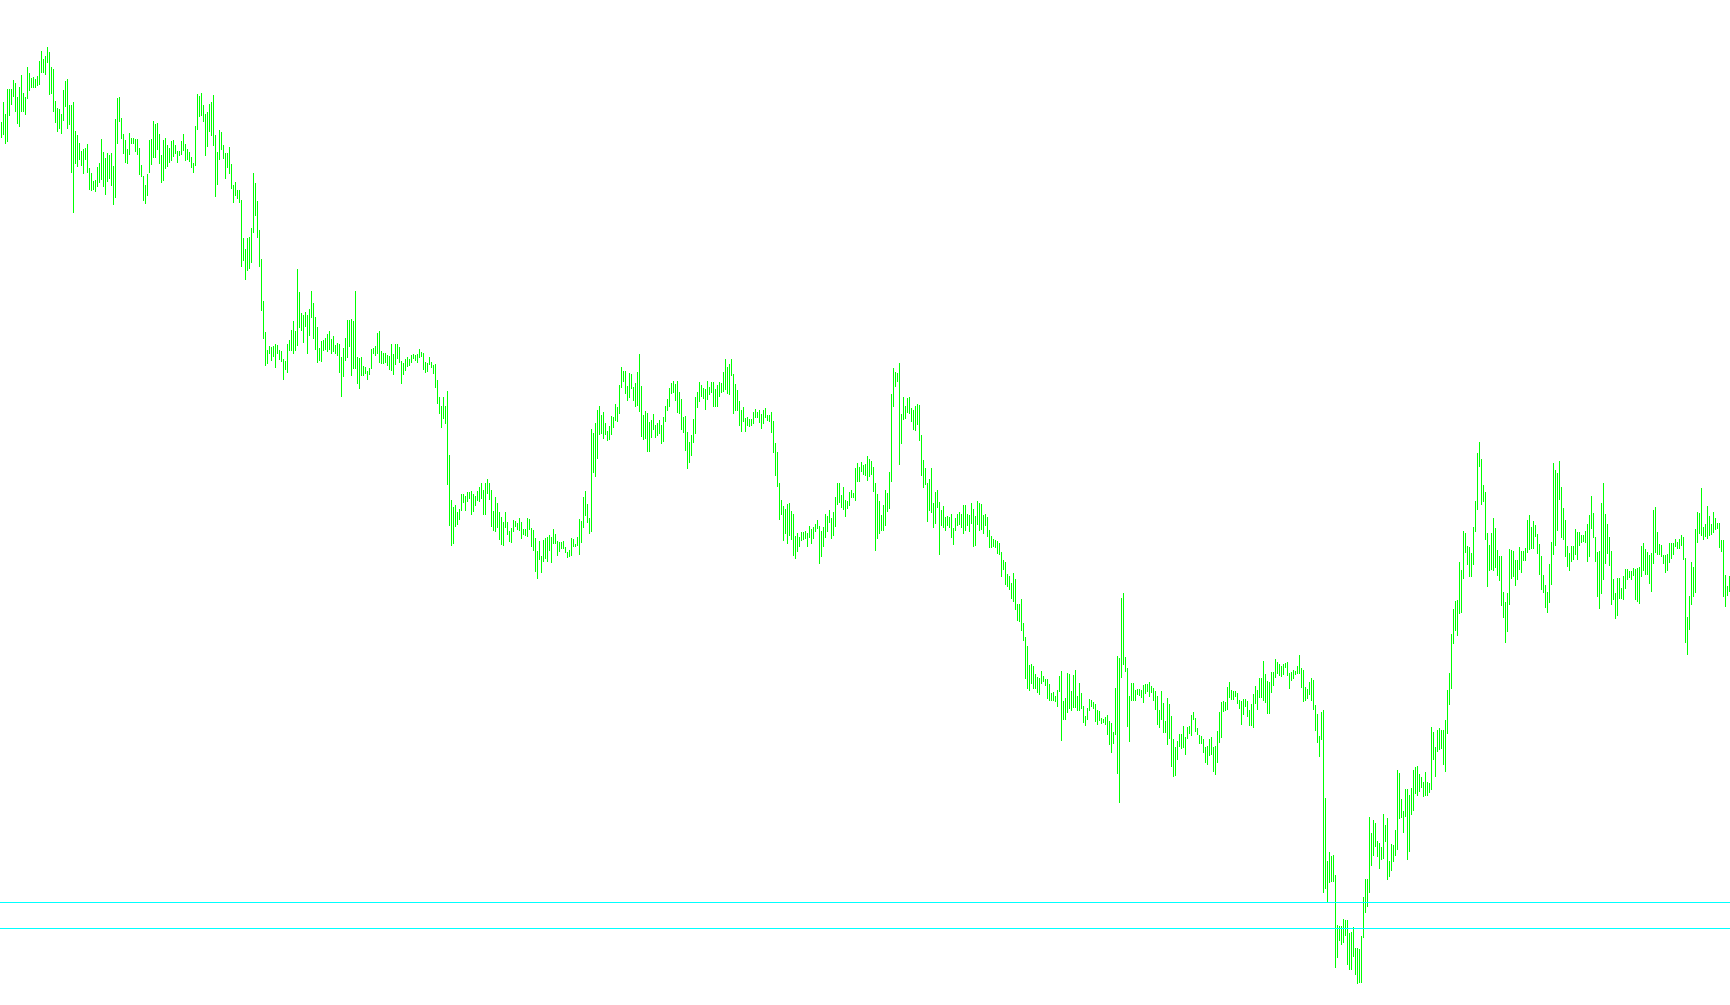
This script is designed to help traders identify key price levels by automatically calculating and displaying the highest and lowest price points reached over a specific period. By visualizing these boundaries, it provides a clear sense of the current market "range," helping users understand where significant breakouts might occur.
How the Logic Works
1. Data Collection The script begins by looking back at the market history specifically on an hourly timeframe. It gathers the high and low prices for each hour to build a comprehensive picture of recent price movement.
2. Establishing the Timeframe By default, the script is configured to analyze the last 5 days of trading activity. This timeframe allows traders to see the boundaries established by recent market trends while filtering out minor, short-term "noise."
3. Identifying Extremes The core logic performs a two-step scan:
- Lowest Point: It scans through the collected data to find the absolute lowest price reached during the specified period.
- Highest Point: It simultaneously scans to identify the absolute highest price reached during that same timeframe.
4. Visualizing the Breakout Levels Once these two critical price points are identified, the script automatically draws two horizontal lines directly on your trading chart:
- The High Line: Representing the ceiling of the recent 5-day range.
- The Low Line: Representing the floor of the recent 5-day range.
Key Features for the User
- Automatic Updating: The script constantly refreshes these lines as new price data comes in, ensuring that the boundaries are always current.
- Clear Visibility: The boundaries are rendered as solid Aqua-colored lines, making them easy to distinguish from other chart elements.
- On-Screen Data: In addition to the visual lines, the script displays the exact numerical values of the 5-day high and low in a comment box on the screen for quick reference.
By using this tool, you can easily see whether the current market price is trading within a consolidated range or if it has broken out above the 5-day high or below the 5-day low, which are often significant signals for new trend directions.
//+------------------------------------------------------------------+
//|                                                 5dayBreakout.mq4 |
//|                                                        Bill Sica |
//|                                         http://www.tetsuyama.com |
//+------------------------------------------------------------------+
#property copyright "Bill Sica"
#property link      "http://www.tetsuyama.com"

#property indicator_chart_window
//---- input parameters
extern int       DAYS=5;
//+------------------------------------------------------------------+
//| Custom indicator initialization function                         |
//+------------------------------------------------------------------+

int init()
  {
//---- indicators

//---- indicators


//----
   return(0);
  }

//+------------------------------------------------------------------+
//| Custom indicator iteration function                              |
//+------------------------------------------------------------------+
int start()
  {
   double daily_high[20];
   double daily_low[20];
   double yesterday_close;
   double phigh,plow;
   int i=1;

//---- TODO: add your code here
ArrayResize(daily_high,DAYS);
ArrayResize(daily_low,DAYS);
ArrayInitialize(daily_high,0);
ArrayInitialize(daily_low,0);

ArrayCopySeries(daily_low, MODE_LOW, Symbol(), PERIOD_H1);
ArrayCopySeries(daily_high, MODE_HIGH, Symbol(), PERIOD_H1);

/* initialise */
plow=daily_low[1];
phigh=daily_high[1];

for(i=1;i<DAYS;i++)
{
   if(plow>daily_low[i])
   {
      plow =daily_low[i];
   }
}

for(i=1;i<DAYS;i++)
{
   if(phigh<daily_high[i])
   {
      phigh =daily_high[i];
   }
}

Comment("\n5dayH ",phigh,"\n5dayL ",plow);

ObjectDelete("5dayHigh");
ObjectDelete("5dayLow");

ObjectCreate("5dayHigh", OBJ_HLINE,0, CurTime(),phigh);
ObjectSet("5dayHigh",OBJPROP_COLOR,Aqua);
ObjectSet("5dayHigh",OBJPROP_STYLE,STYLE_SOLID);

ObjectCreate("5dayLow", OBJ_HLINE,0, CurTime(),plow);
ObjectSet("5dayLow",OBJPROP_COLOR,Aqua);
ObjectSet("5dayLow",OBJPROP_STYLE,STYLE_SOLID);

ObjectsRedraw();

   return(0);
  }
//+------------------------------------------------------------------
Comments