DayImpulseOverlay_v1
Indicator

DayImpulseOverlay_v1

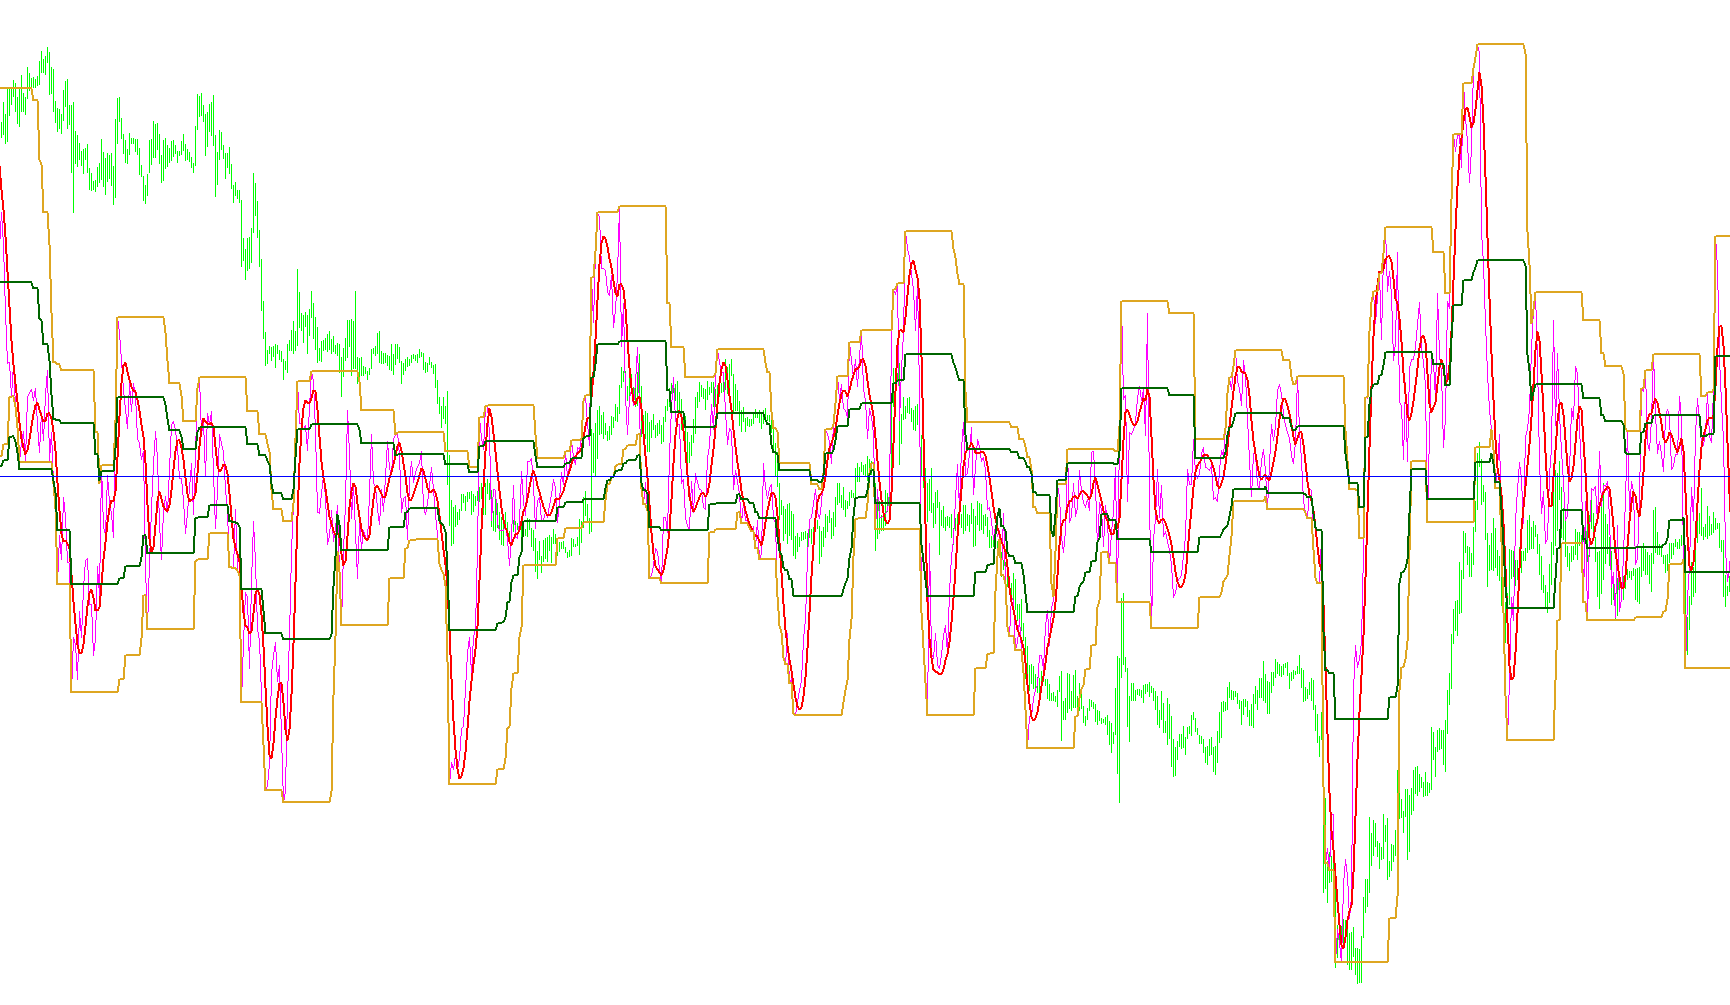
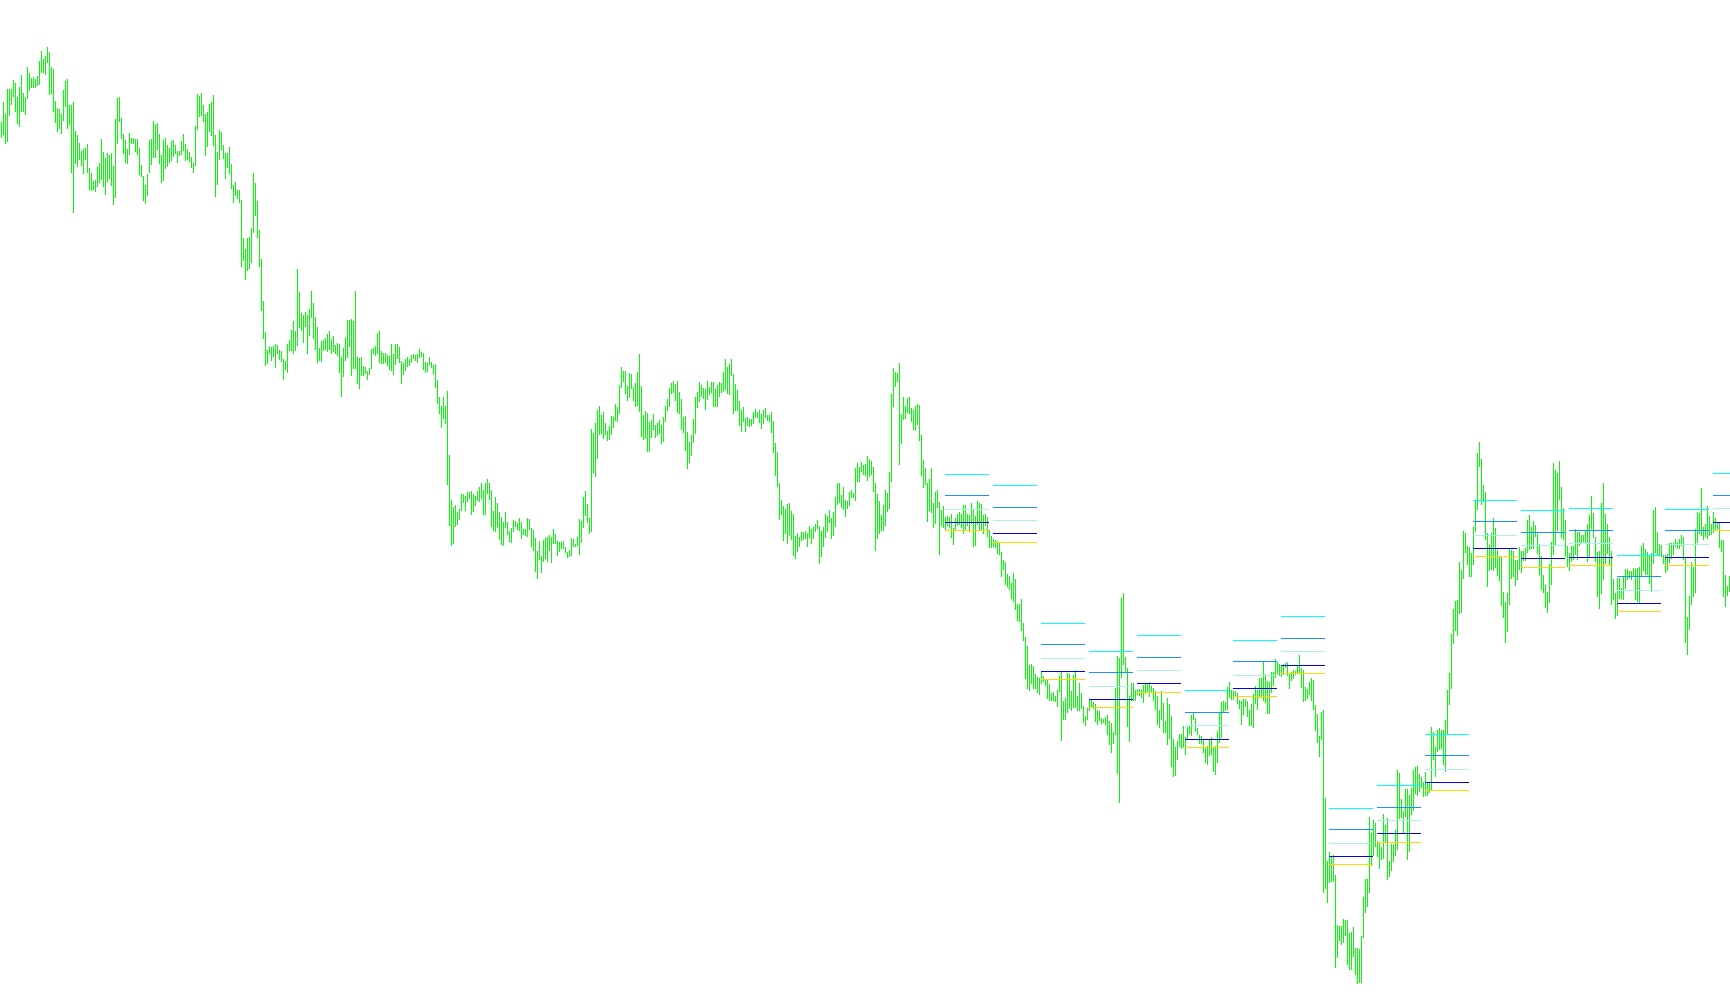
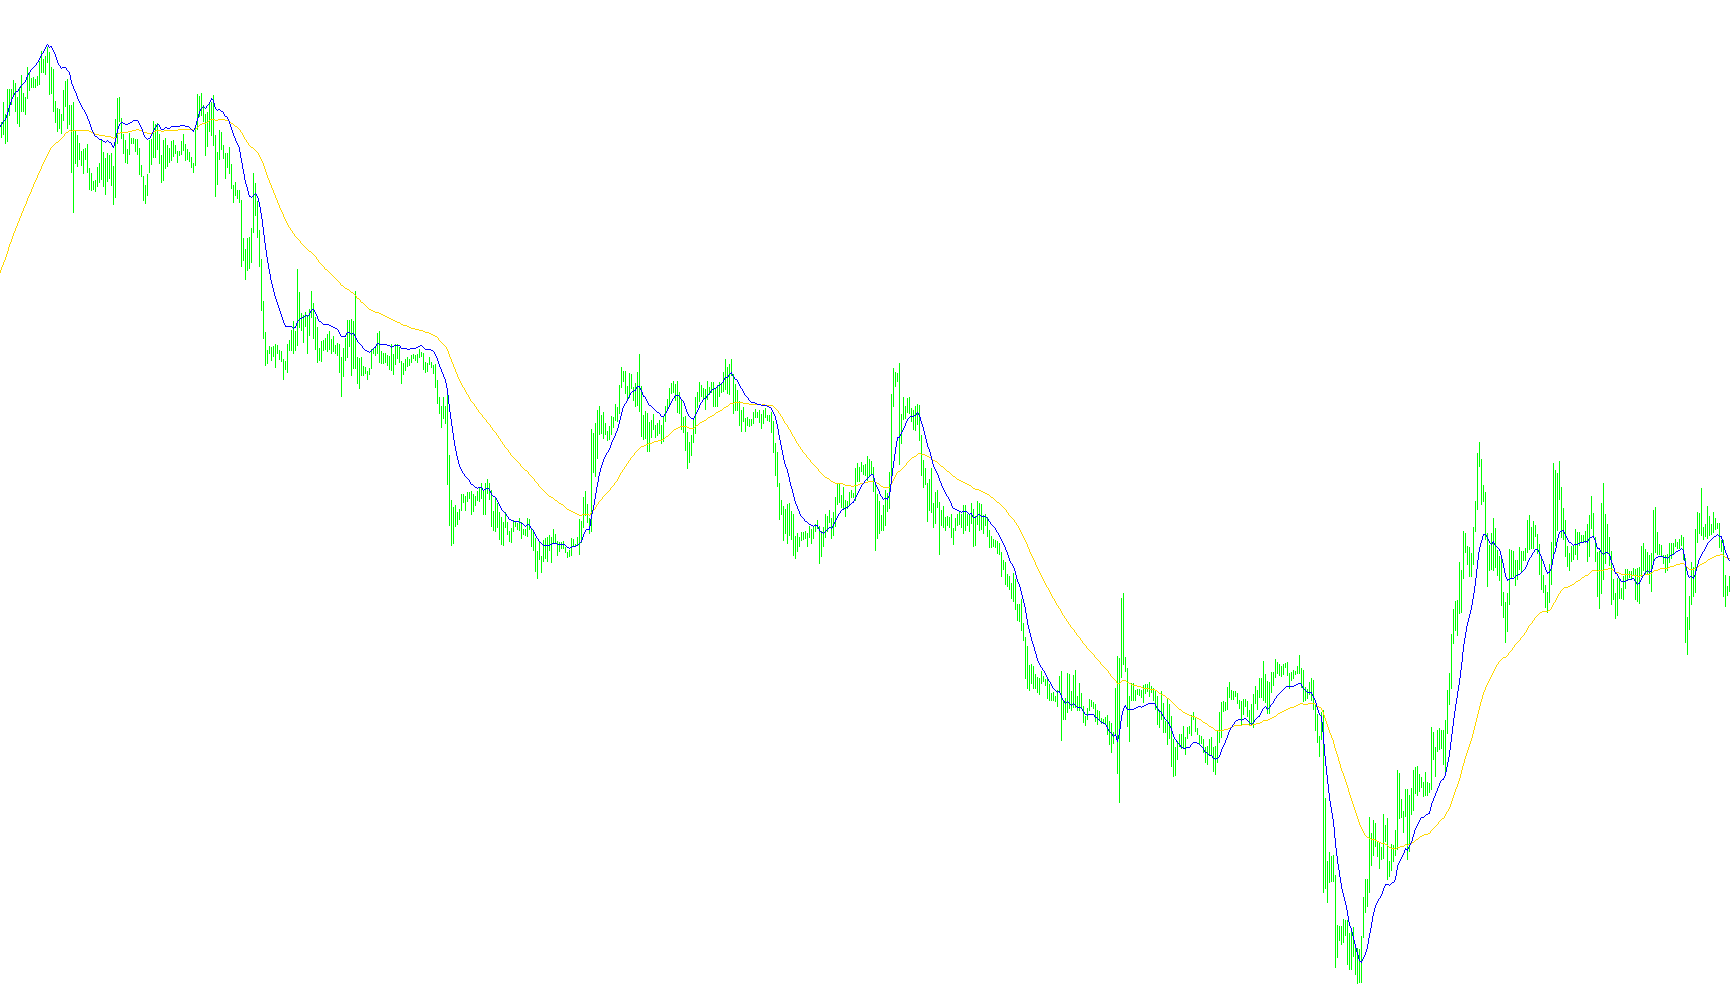
Calculates the aggregate price movement of a specific bar range to project shifted volatility trends and current directional momentum.
DayImpulseOverlay_v2
Indicator

DayImpulseOverlay_v2

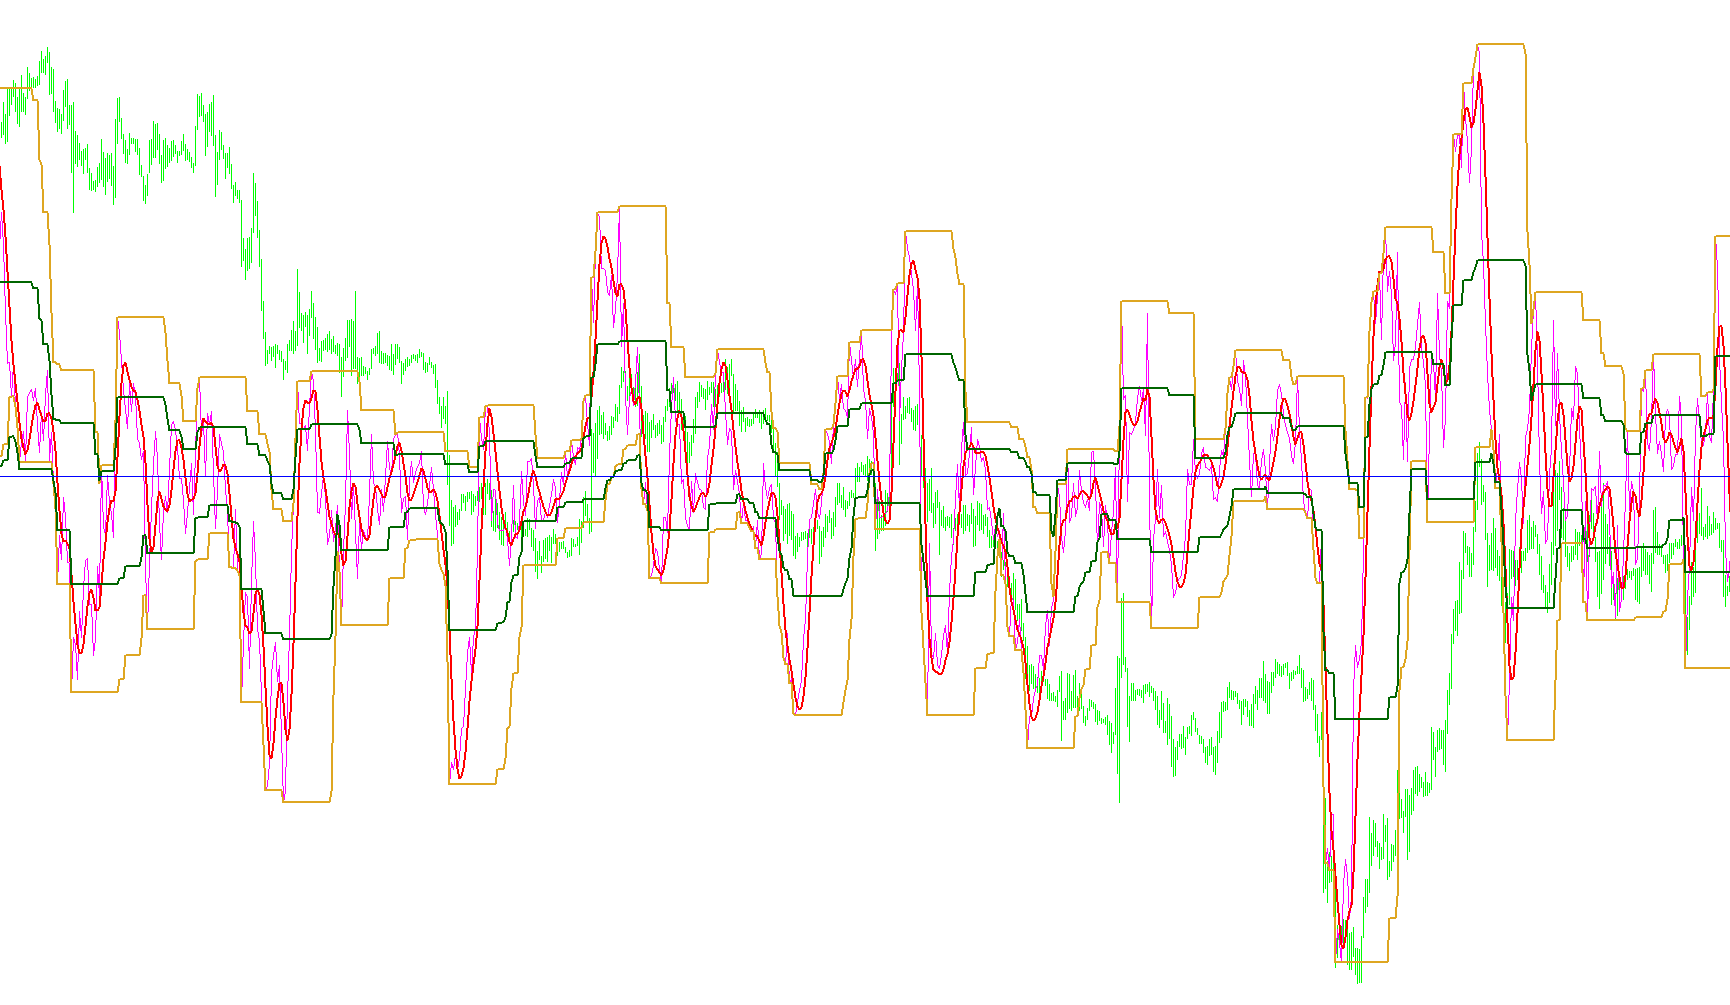
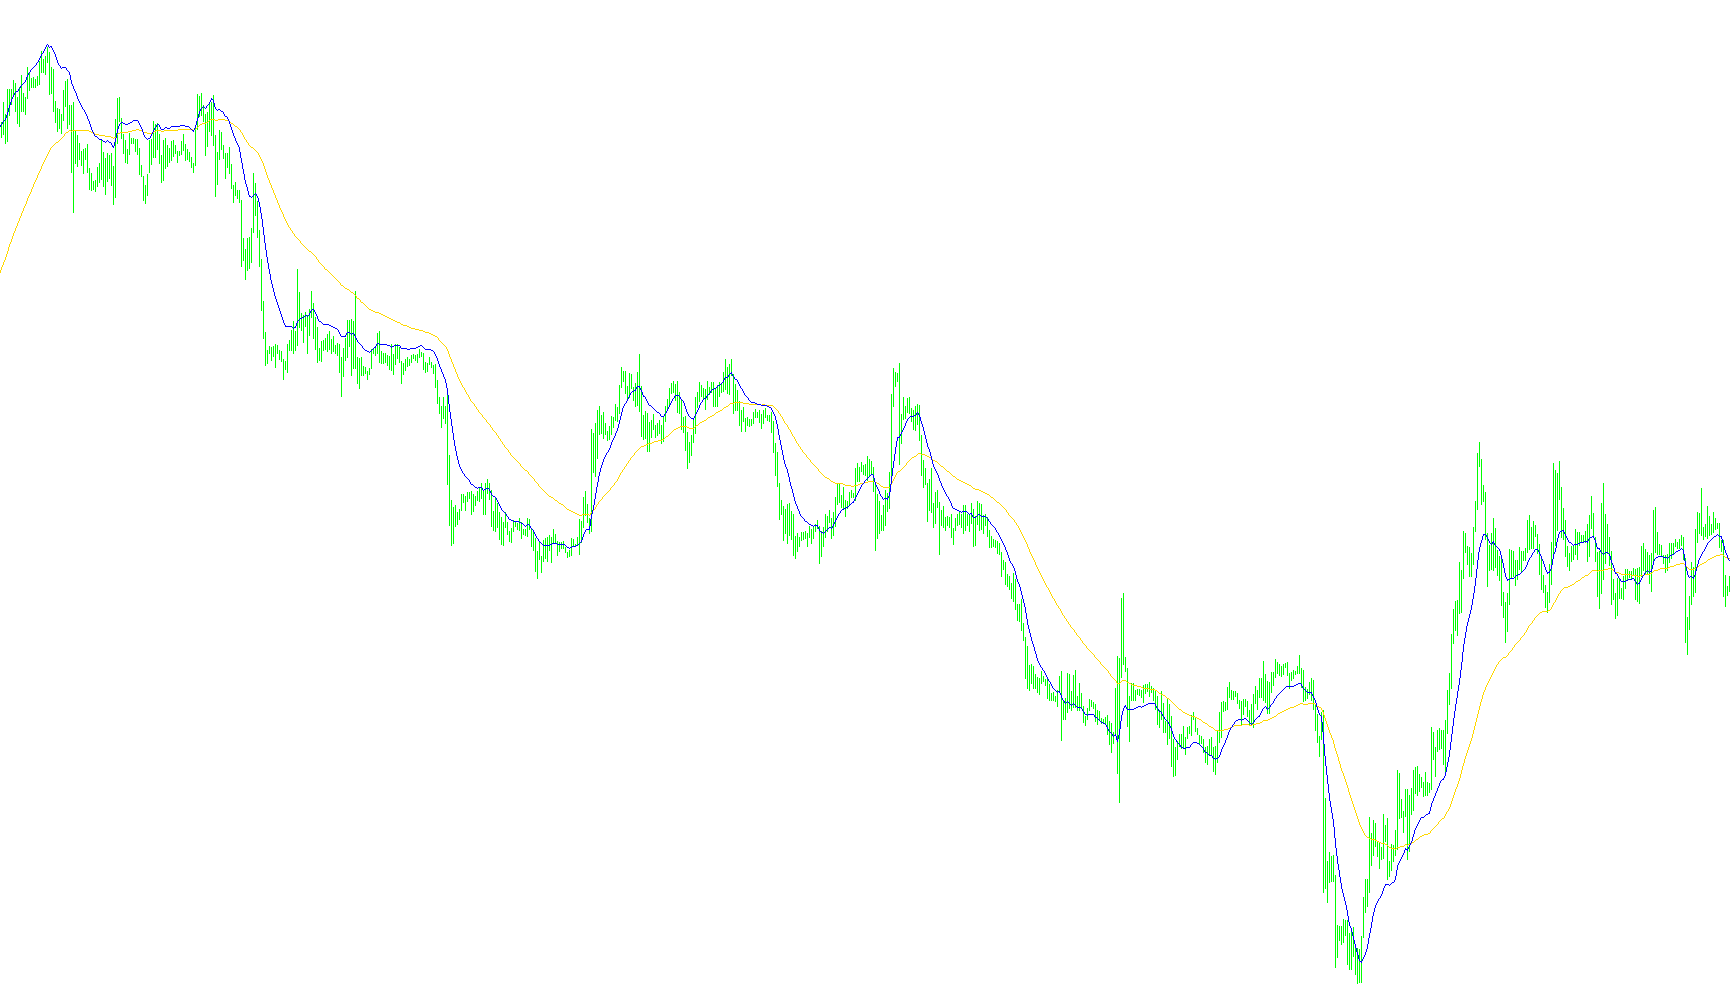
The algorithm aggregates historical price velocity over a defined period and projects the resulting cumulative impulse forward to forecast potential trend trajectories.

DayImpuls_T3_v3 BigJoe
Indicator

DayImpuls_T3_v3 BigJoe

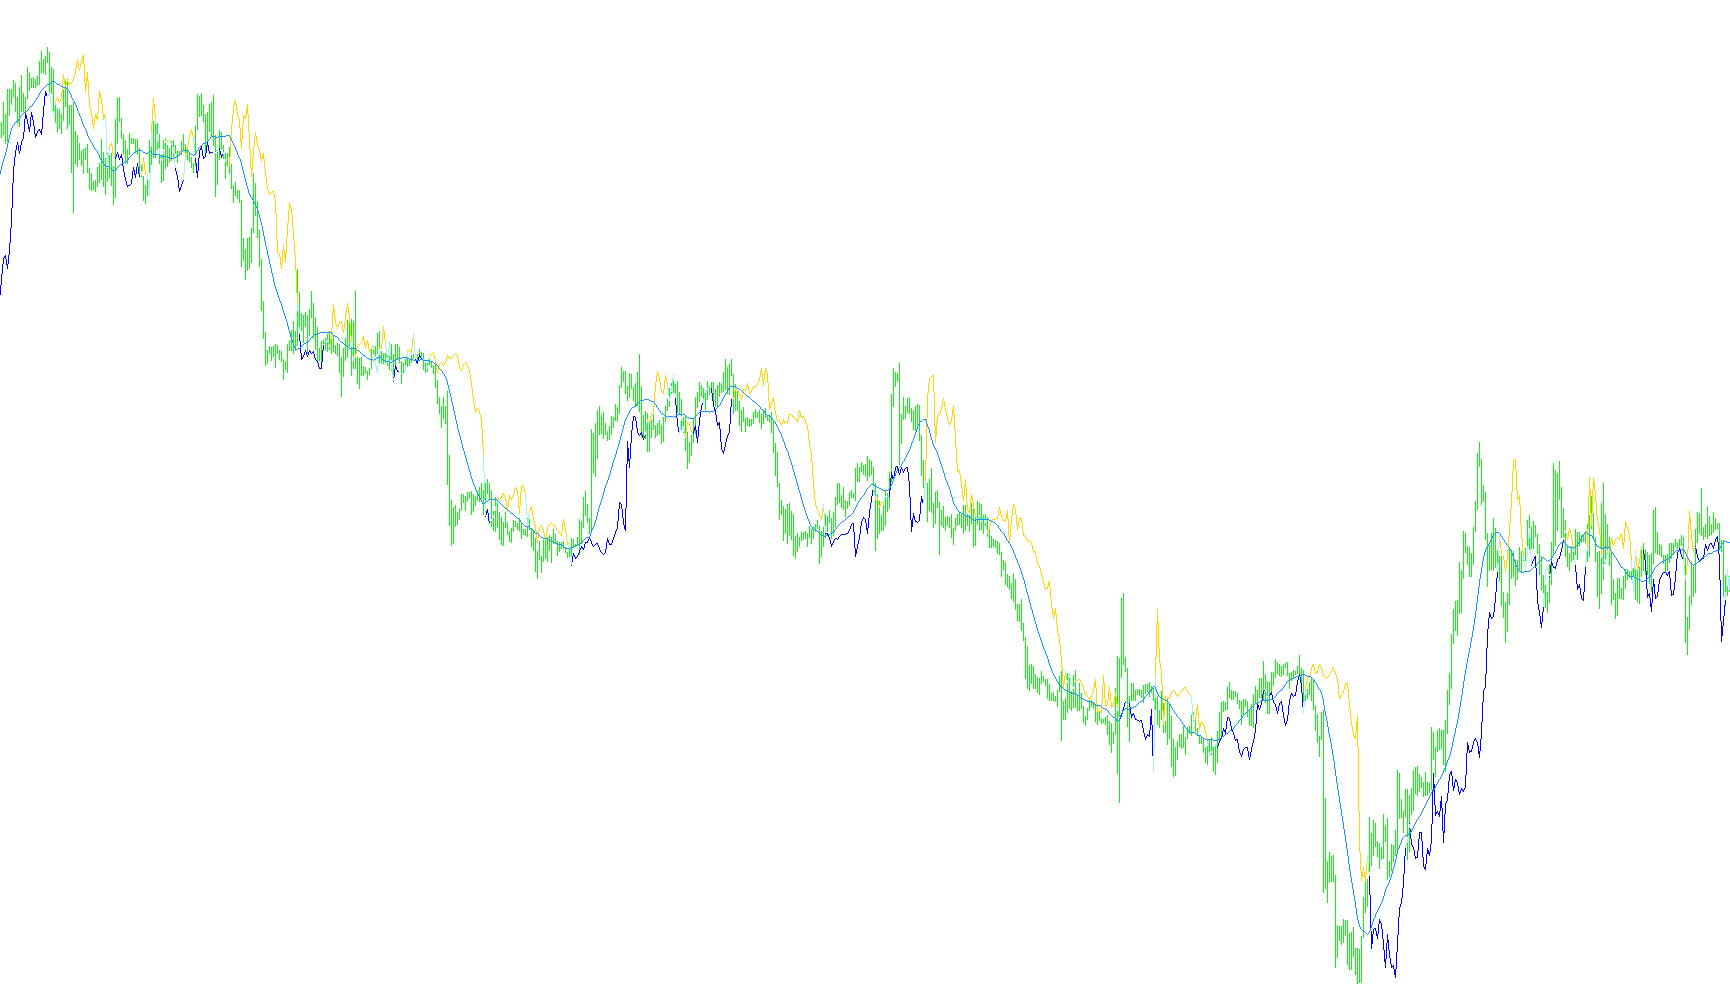
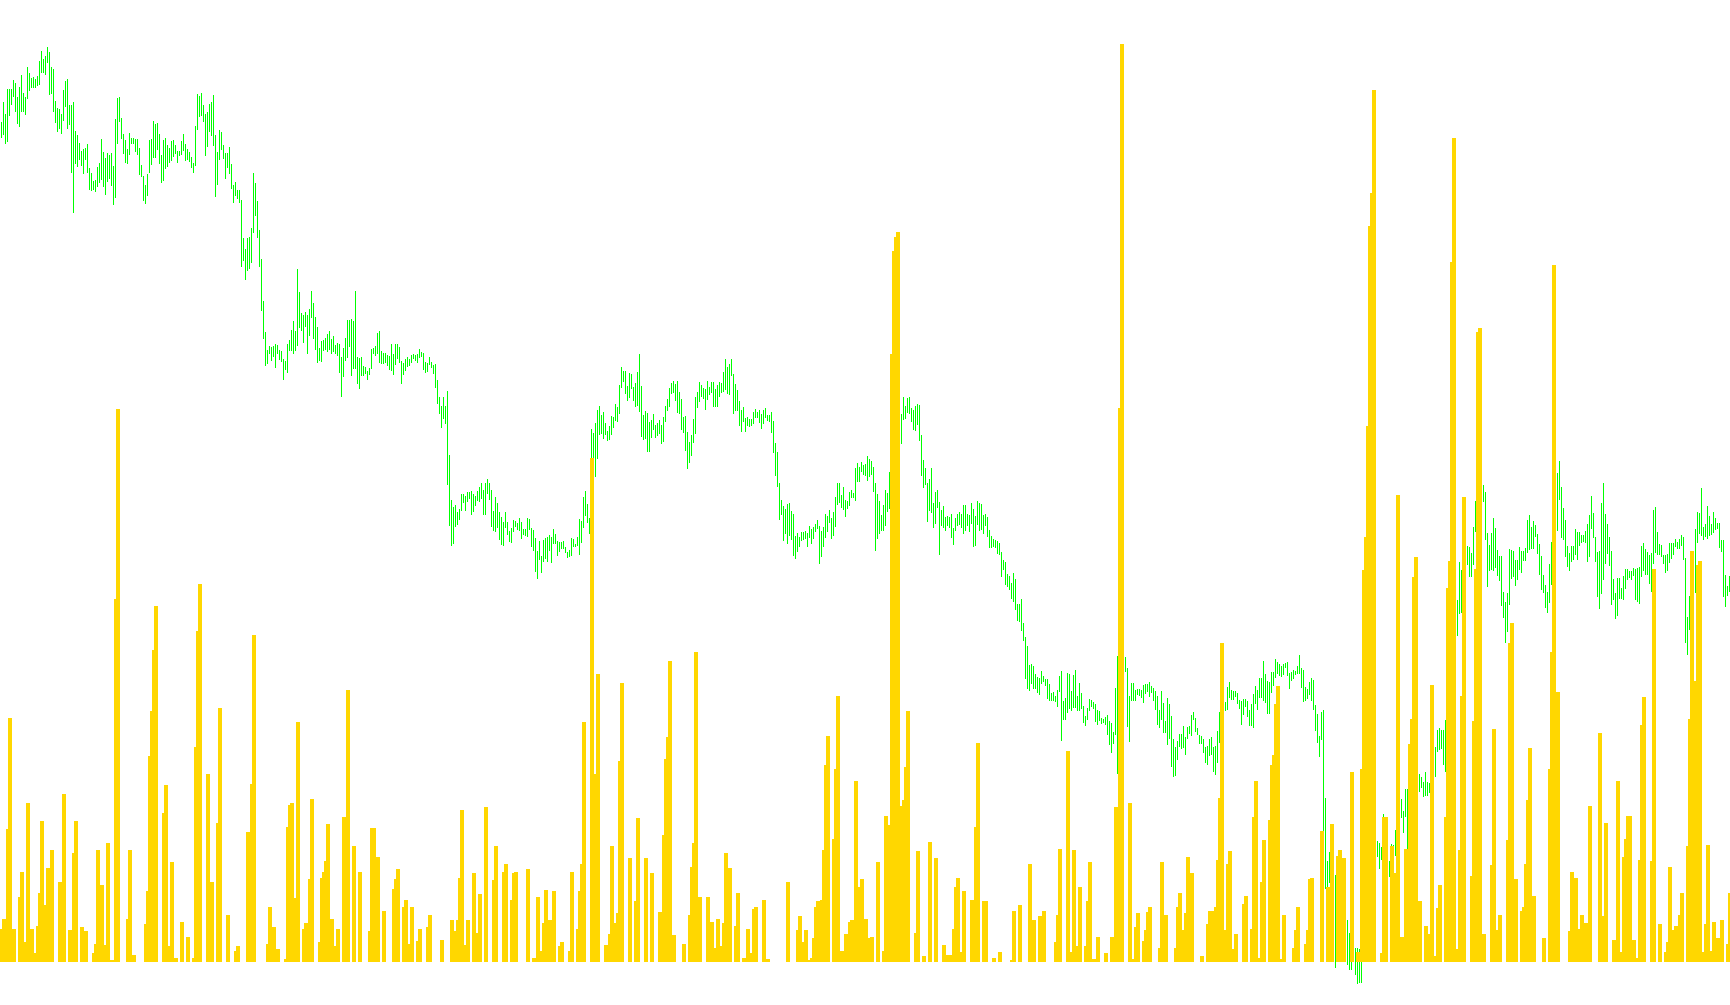
This indicator calculates price momentum by measuring the difference between open and close prices over a specific period, then smoothes the resulting impulse using a triple-smoothed moving average (T3) algorithm.

DayImpuls_T3_v3
Indicator

DayImpuls_T3_v3

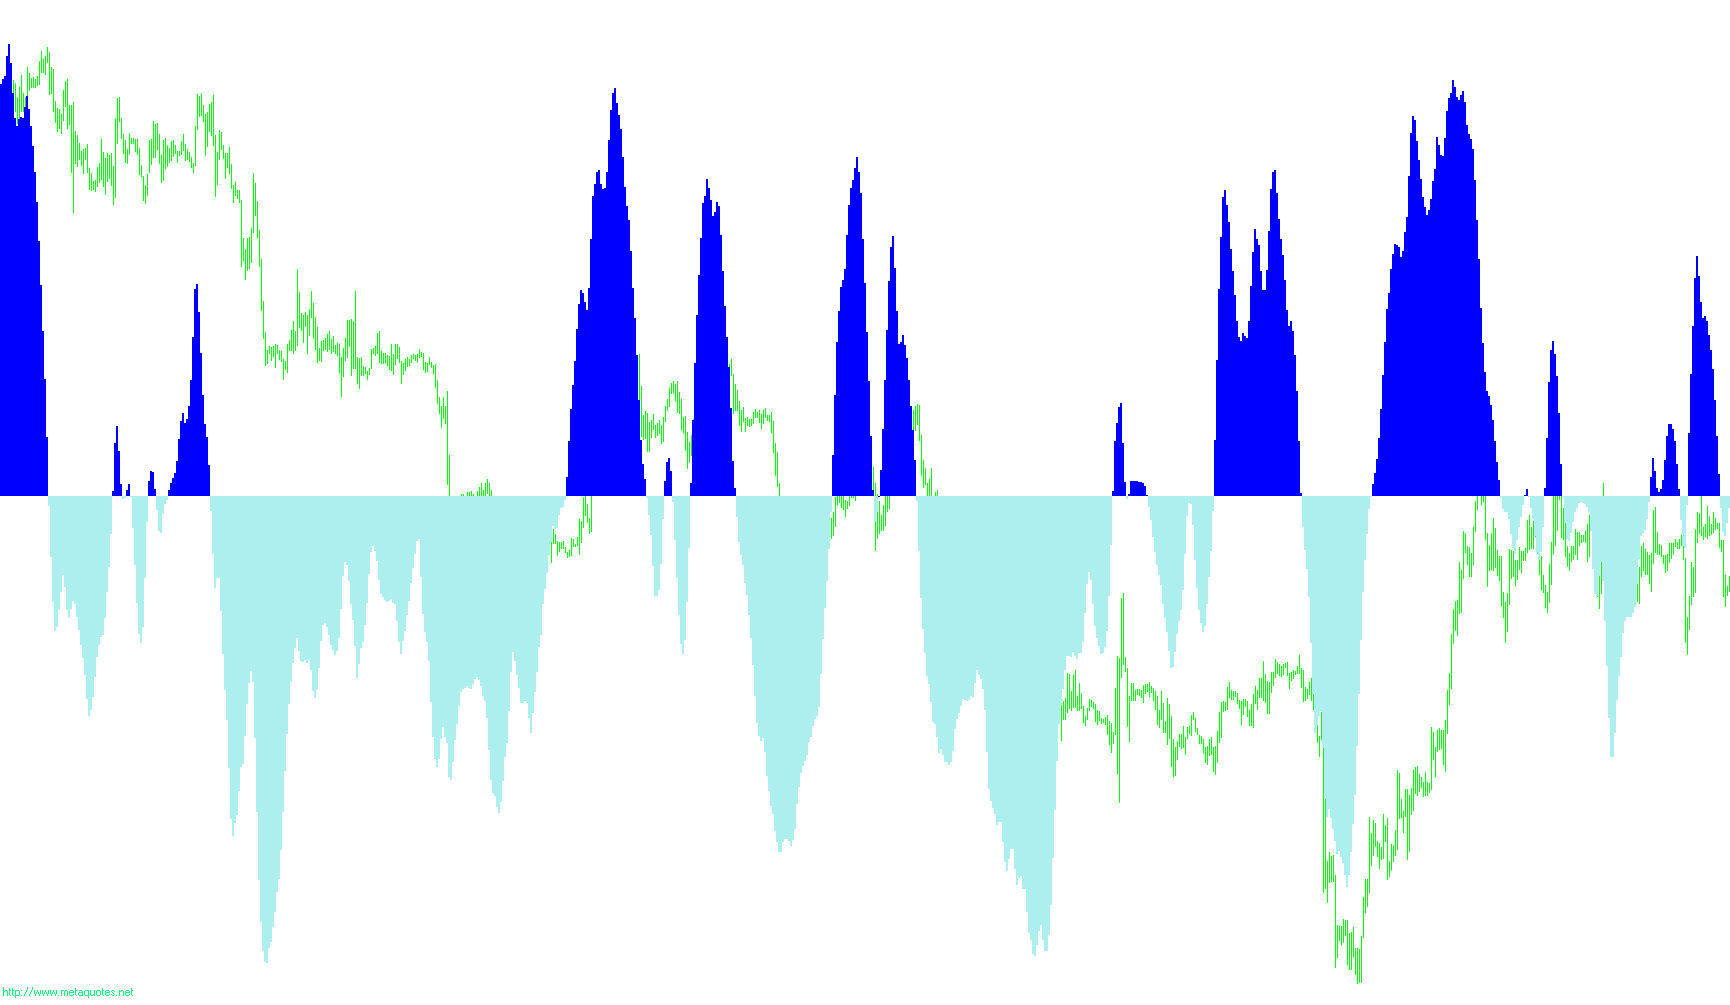
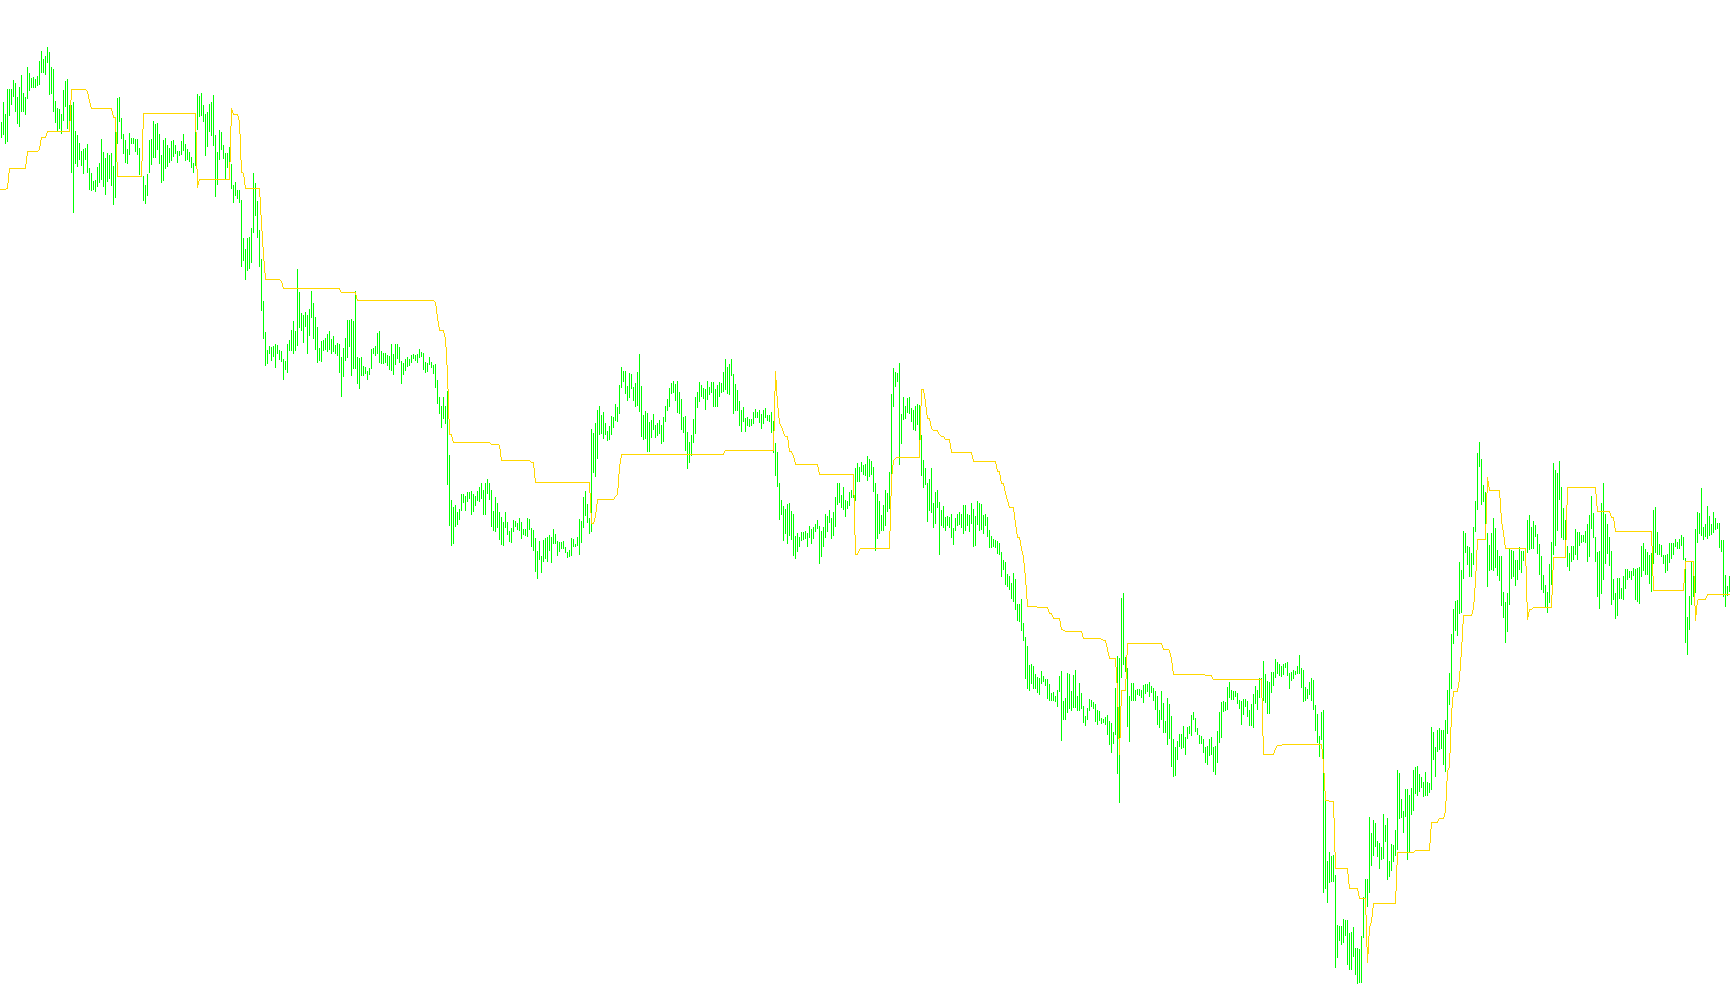
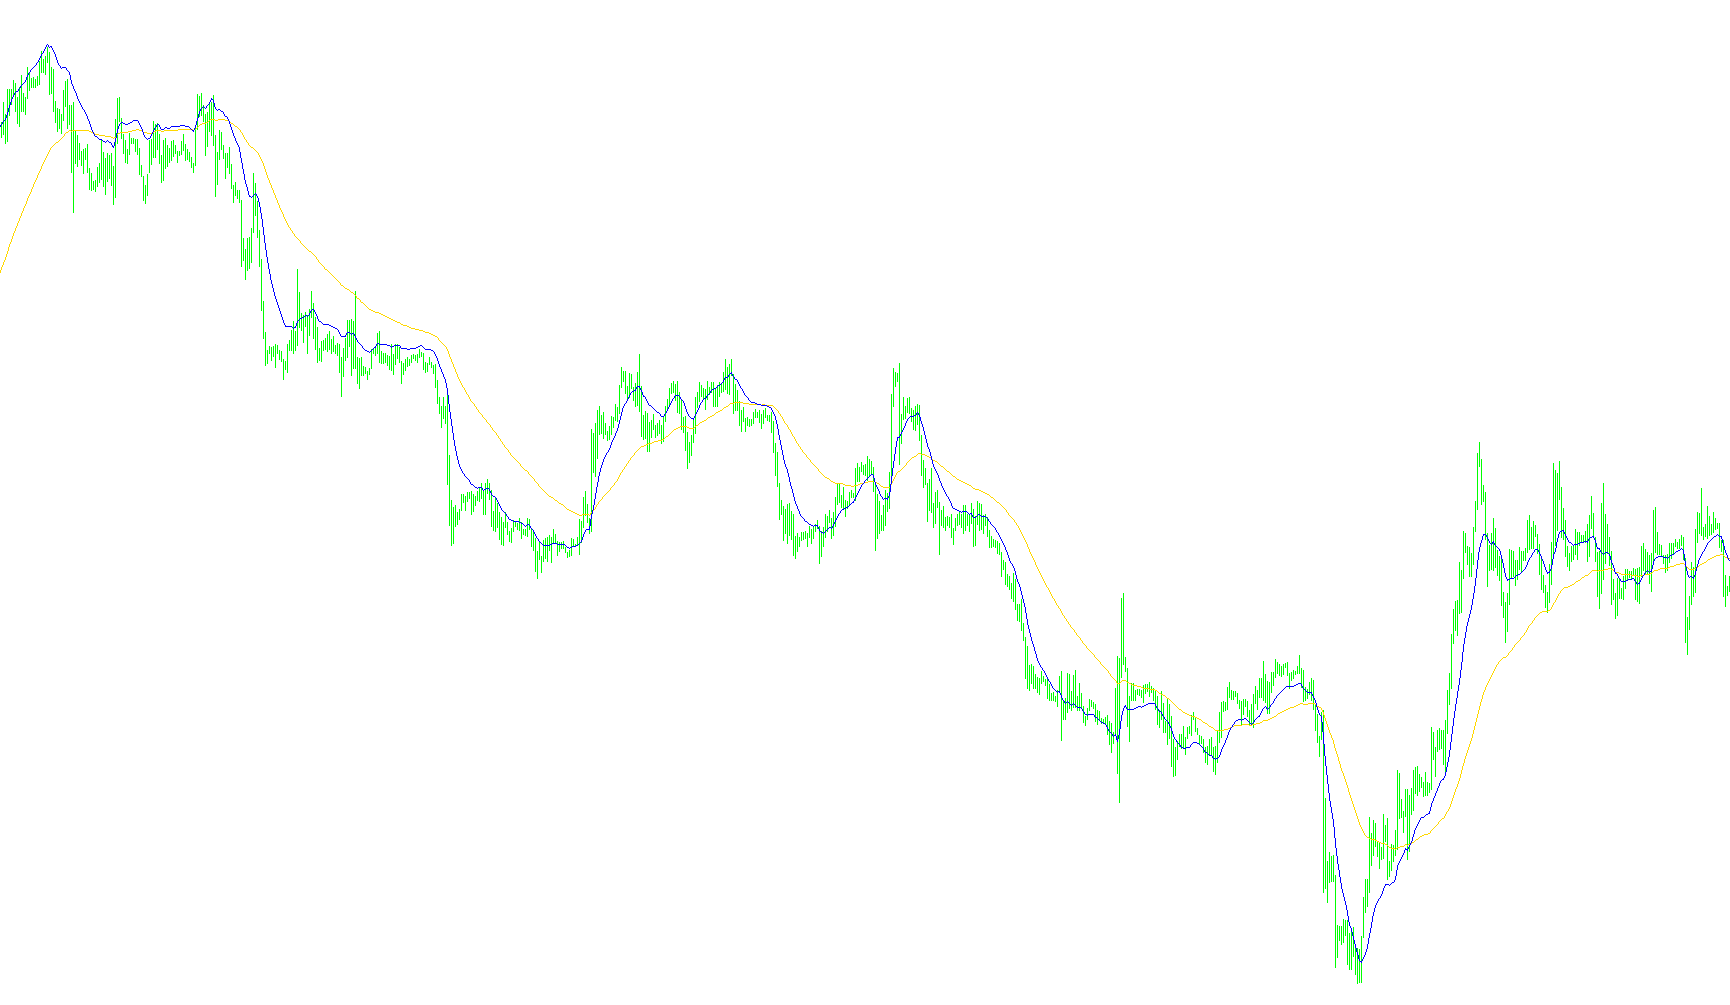
This indicator calculates the cumulative price discrepancy over a fixed period and applies a triple-smoothed T3 moving average to identify trend velocity and dynamic price channels.

DayImpuls_T3_v3_001
Indicator

DayImpuls_T3_v3_001

This indicator calculates momentum by aggregating price differentials over a specific period and applying the T3 moving average smoothing algorithm to filter noise and identify directional trends.

DayImpuls_T3_v3_v1
Indicator

DayImpuls_T3_v3_v1

This indicator calculates a price-action momentum impulse derived from open-close price differentials, processed through a weighted T3 smoothing algorithm to identify trends and historical volatility channels.

DayImpuls_T3_v3_v2
Indicator

DayImpuls_T3_v3_v2

This indicator calculates a smoothed momentum value derived from the sum of price spreads, processed through a triple exponential smoothing (T3) filter and integrated with dynamic range channels.

DayImpuls_T3_v3_v3
Indicator

DayImpuls_T3_v3_v3

This indicator quantifies price momentum by calculating the cumulative difference between opening and closing prices across a rolling window, smoothed through a specialized T3 polynomial filter to identify trend velocity.

DayImpuls_v1
Indicator

DayImpuls_v1

This indicator quantifies cumulative price gaps by aggregating the difference between opening and closing prices over a rolling window to identify trend momentum.

DayImpuls_v2
Indicator

DayImpuls_v2

This indicator quantifies and visualizes the net price variance by aggregating the difference between opening and closing prices across a multi-period sliding window.

DayImpuls_v3
Indicator

DayImpuls_v3

This indicator calculates the cumulative difference between opening and closing prices over a specific period to visualize directional price pressure as an inverted impulse value.

DaylyPivot
Indicator

DaylyPivot

This indicator dynamically projects historical high, low, and closing price data to calculate multi-layered daily pivot points and volatility-based support/resistance boundaries.

DaylyWoodPivot
Indicator

DaylyWoodPivot

Calculates intra-day price equilibrium and structural boundaries by deriving multi-layered support and resistance levels from the previous day's high, low, and opening values.

DayOfWeek
Indicator

DayOfWeek

This indicator identifies and marks specific trading sessions by plotting visual markers on bars that correspond to a user-defined day of the weekly cycle.

DayOfWeek_v1
Indicator

DayOfWeek_v1

This indicator visually identifies and plots markers above the high price bars on a user-defined day of the week.

DayOpen
Indicator

DayOpen

This indicator identifies and projects a horizontal reference line marking the opening price of each new trading day to visualize institutional price levels.

DayOpenFib-down
Indicator

DayOpenFib-down

This indicator maps daily opening prices and projects specific Fibonacci-based price levels across historical bars to identify potential support and resistance zones.

DayOpenFib-up
Indicator

DayOpenFib-up

This indicator projects price levels based on the daily opening price using specific Fibonacci-based point offsets to identify potential expansion zones.

DayOpenFib
Indicator

DayOpenFib

This indicator plots historical daily opening prices alongside fixed-point expansion levels based on Fibonacci sequence increments to identify potential price zones.

DayTrend-T01
Indicator

DayTrend-T01

This indicator calculates a multi-stage smoothed price velocity using a Triple Exponential Moving Average logic to identify directional momentum and dynamically plot the median price range.

DC
Indicator

DC

This indicator identifies price boundaries by calculating high and low extremes over a rolling period, featuring customizable median-point calculations and margin offsets for breakout detection.

DDFX 1 B-clock_v3
Indicator

DDFX 1 B-clock_v3

The indicator calculates and displays a dynamic visual countdown on the chart showing the exact minutes and seconds remaining until the current candlestick expires.

DDFX 2 Neuro Trade v3
Indicator

DDFX 2 Neuro Trade v3

This indicator identifies bullish and bearish momentum shifts by detecting price breakouts from high-low volatility boundaries across nested lookback periods.

DDFX 3 BBStop v3
Indicator

DDFX 3 BBStop v3

iBands

This indicator identifies trend reversals by calculating trailing stop levels based on Bollinger Band extremes and price momentum relative to risk parameters.

DDFX 4 SDX-TzPivots v3
Indicator

DDFX 4 SDX-TzPivots v3

This indicator dynamically projects structural support and resistance levels by synthesizing daily price action, Fibonacci retracement ratios, Camarilla breakouts, and mid-point equilibrium zones.

DDFX 5 Fast Trend v3
Indicator

DDFX 5 Fast Trend v3

iSAR

This indicator visualizes the Parabolic SAR values as distinct histogram channels, bifurcating into upper and lower zones based on their position relative to the high price points.

DDFX 6 Medium Trend v3
Indicator

DDFX 6 Medium Trend v3

iBands

This indicator identifies structural shifts by monitoring price breakouts against dynamically adjusted Bollinger Bands and tracking trailing trend extremes to generate entry signals.

DDFX 7 Major Trend v3
Indicator

DDFX 7 Major Trend v3

iBands

This indicator identifies structural momentum shifts by calculating dynamic volatility boundaries and detecting price breakouts to signal major trend reversals.

DDFX 8 Sentiment v3
Indicator

DDFX 8 Sentiment v3

iCCIiMA

This indicator identifies market bias by synchronizing Commodity Channel Index polarity with the directional slope of dual exponential moving average spreads.

DDFX 9 Xtra Sig v3
Indicator

DDFX 9 Xtra Sig v3

iBands

This indicator identifies trend reversals by monitoring Bollinger Band breaches and calculating trailing stop levels based on dynamic price risk parameters.

DDFX BullBear89
Indicator

DDFX BullBear89

This indicator calculates the relative position of current price within a rolling high-low range to generate a logarithmic momentum shift that identifies dominant bullish or bearish sentiments.

DecBinHex
Indicator

DecBinHex

A utility library providing bidirectional conversion protocols between decimal, binary, and hexadecimal numerical formats.

DECEMA-a
Indicator

DECEMA-a

iMAiMAOnArray

The logic calculates a multi-layered smoothing effect by nesting exponential moving averages five levels deep and applying a weighted polynomial coefficient to generate an oscillator signal.

DECEMA
Indicator

DECEMA

iMAOnArray

The indicator calculates a complex weighted sum of nested exponential moving averages derived from an underlying custom signal to identify momentum shifts.

DECEMA_v1
Indicator

DECEMA_v1

iMA

The indicator calculates a high-order polynomial smoothing of an Exponential Moving Average to reduce noise and identify trend momentum.

DECEMA_v1_v1
Indicator

DECEMA_v1_v1

iMA

This indicator calculates a multi-stage recursive exponential moving average sequence and applies a specific weighted polynomial coefficients to generate a smoothed trend line.

DECEMA_v2
Indicator

DECEMA_v2

iMAOnArray

This indicator calculates a complex weighted harmonic signal by applying nested exponential moving averages to external custom data points.

DecodeTesterHistory
Indicator

DecodeTesterHistory

This script parses binary .fxt and .quo files from the MT4 strategy tester to reconstruct human-readable .hdr and .quo CSV datasets for offline analysis.

Decorator_Ron_v01
Indicator

Decorator_Ron_v01

This script dynamically annotates active trade entries on the chart by rendering visual 'B' and 'S' markers at the specific opening price of each position.

DeleteByName
Indicator

DeleteByName

Iterates through all chart elements and removes every object whose identifier begins with a user-defined string.

delete_pending
Indicator

delete_pending

Automates the immediate removal of the first non-market pending order detected in the trading terminal.

Delta MA
Indicator

Delta MA

iMA

The indicator identifies price reversals by mapping historical closing prices from the lookback period onto current trend slopes to highlight structural pivot points.

delta-stop
Indicator

delta-stop

iATRiMAOnArray

The indicator calculates a dynamic price floor or ceiling by applying a multiplier to smoothed Average True Range volatility to track structural price shifts.

Delta
Indicator

Delta

iMA

This indicator calculates and visualizes the real-time point distance between current market prices and two distinct exponential moving averages of varying periods.

DeltaAlert
Indicator

DeltaAlert

iMA

This indicator identifies trend reversals by monitoring the relative price displacement between two distinct exponential moving average distances.

DeltaAlert_001
Indicator

DeltaAlert_001

iMA

This indicator calculates the absolute point distance between the current market price and two distinct exponential moving averages to identify trend reversals based on relative divergence.

Indicator

Deltaforce

Deltaforce_v1
Indicator

Deltaforce_v1

This indicator tracks the cumulative price displacement of consecutive directional movements to visualize active trend strength and momentum shifts.

Indicator

Deltaforce_v2

Delta_v1
Indicator

Delta_v1

iMA

This indicator quantifies the point-based spatial distance between current market prices and two distinct Exponential Moving Averages to visualize momentum divergence.