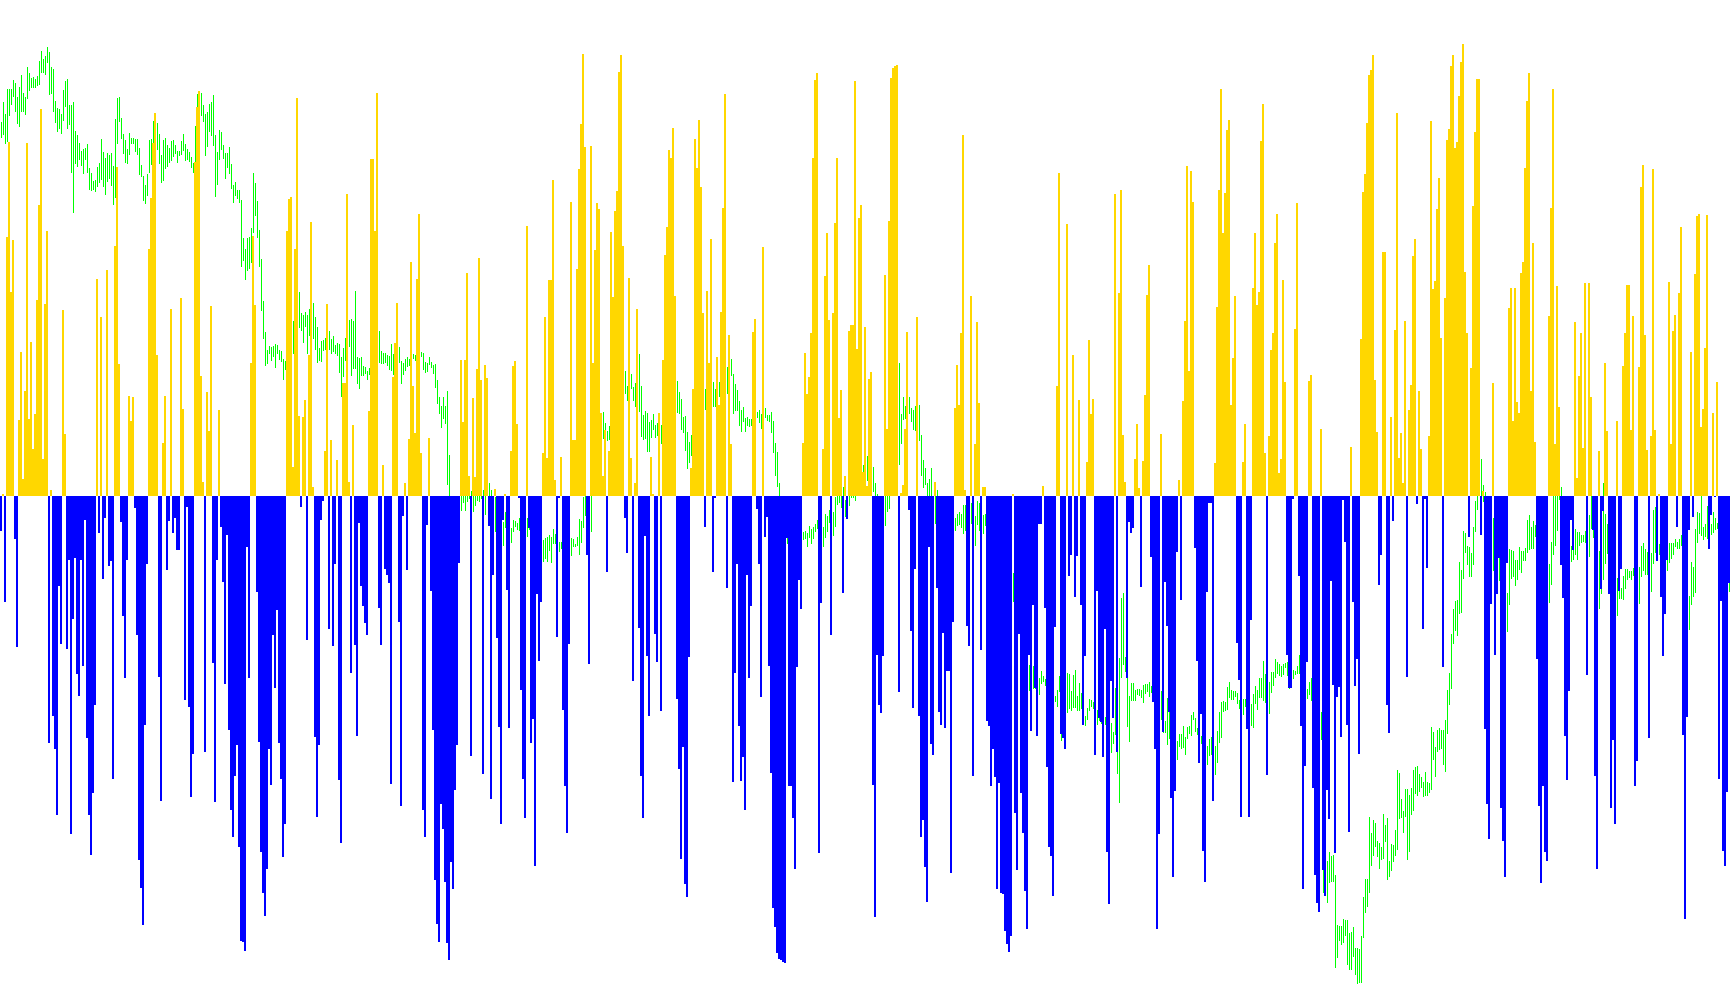
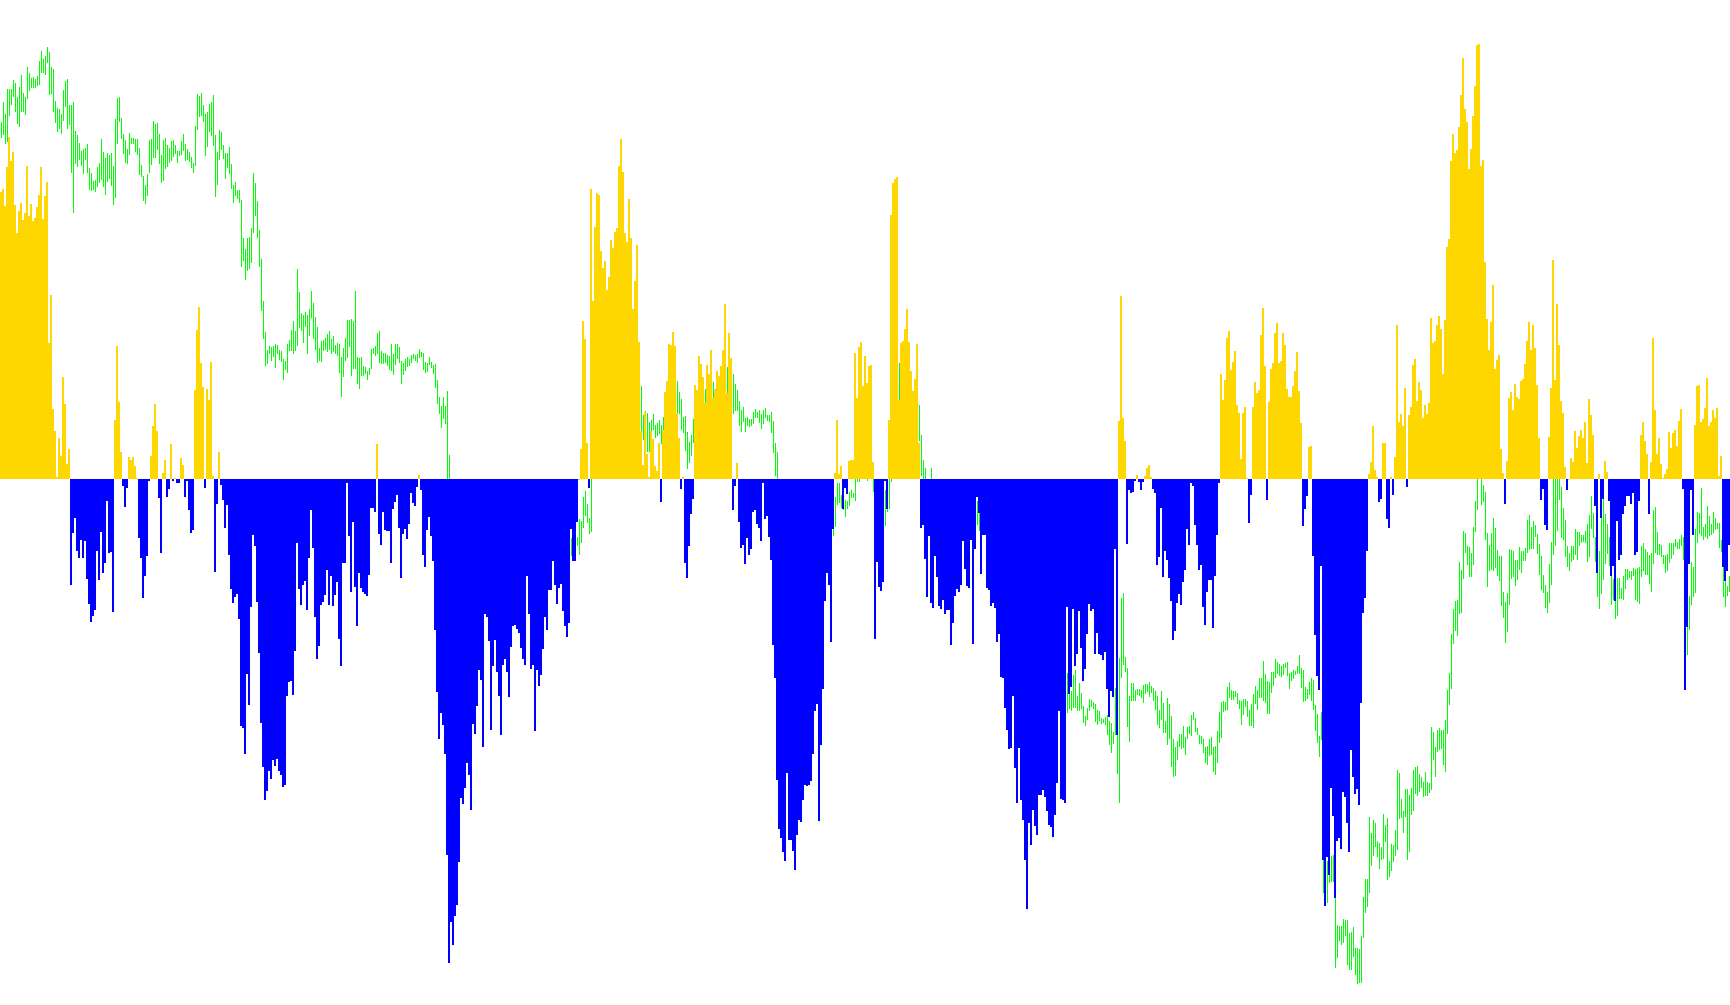
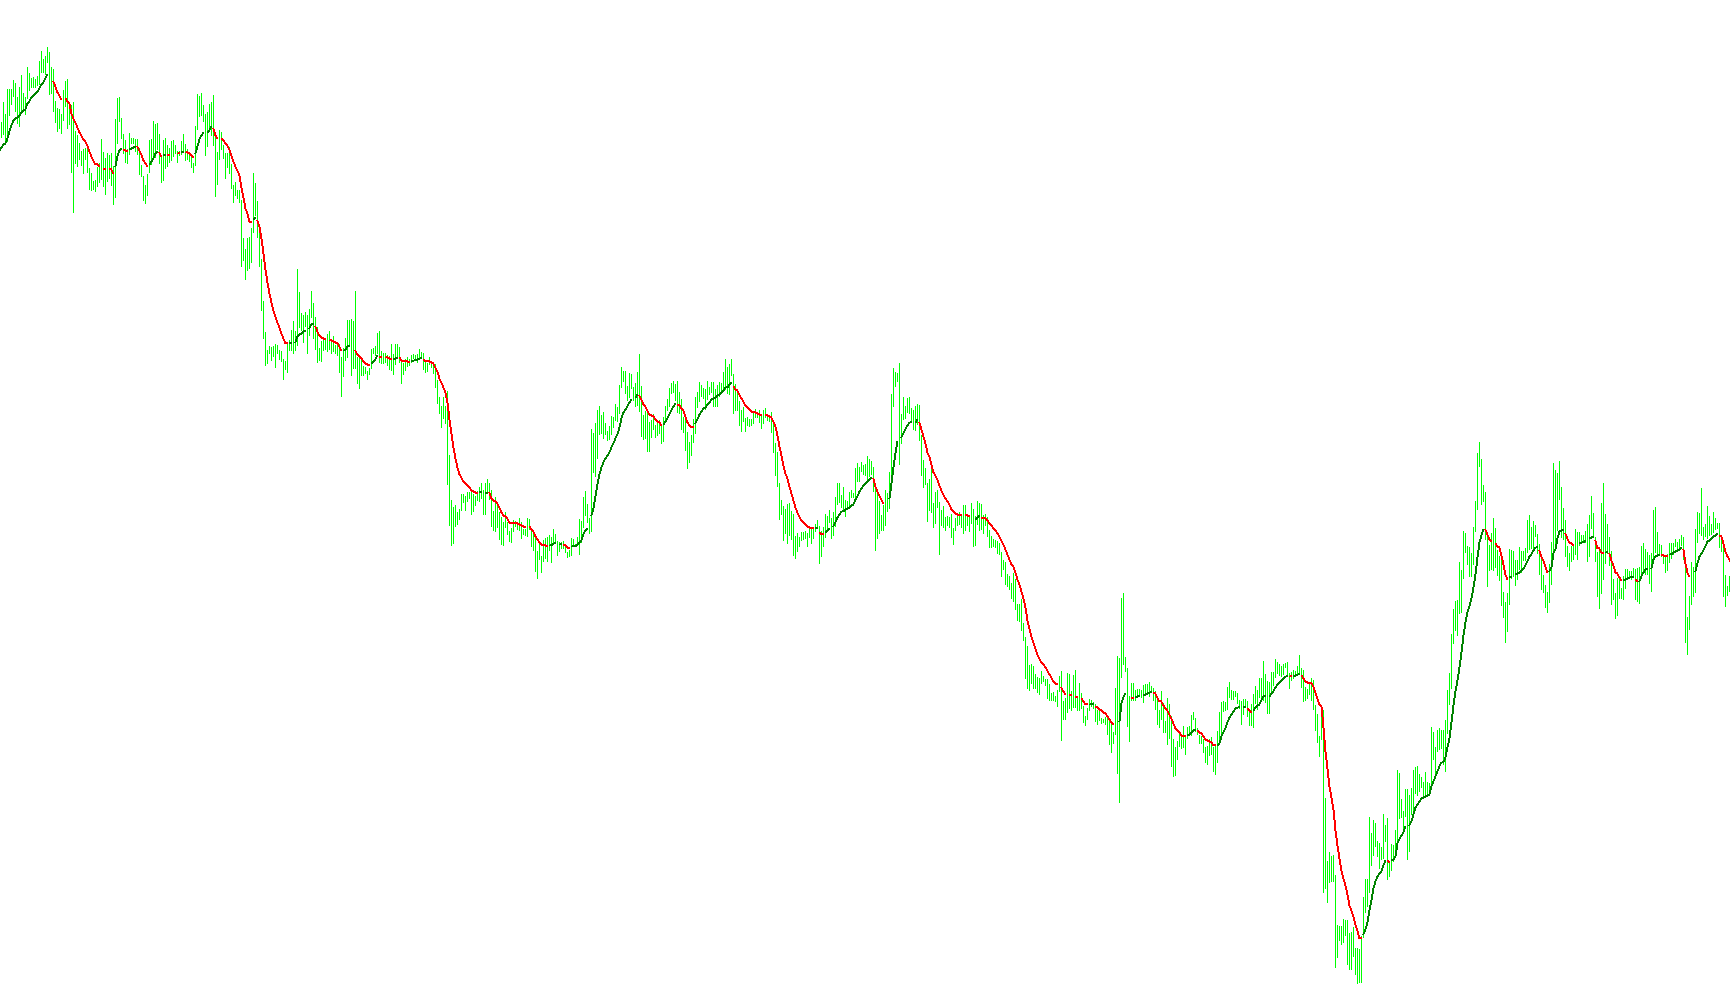
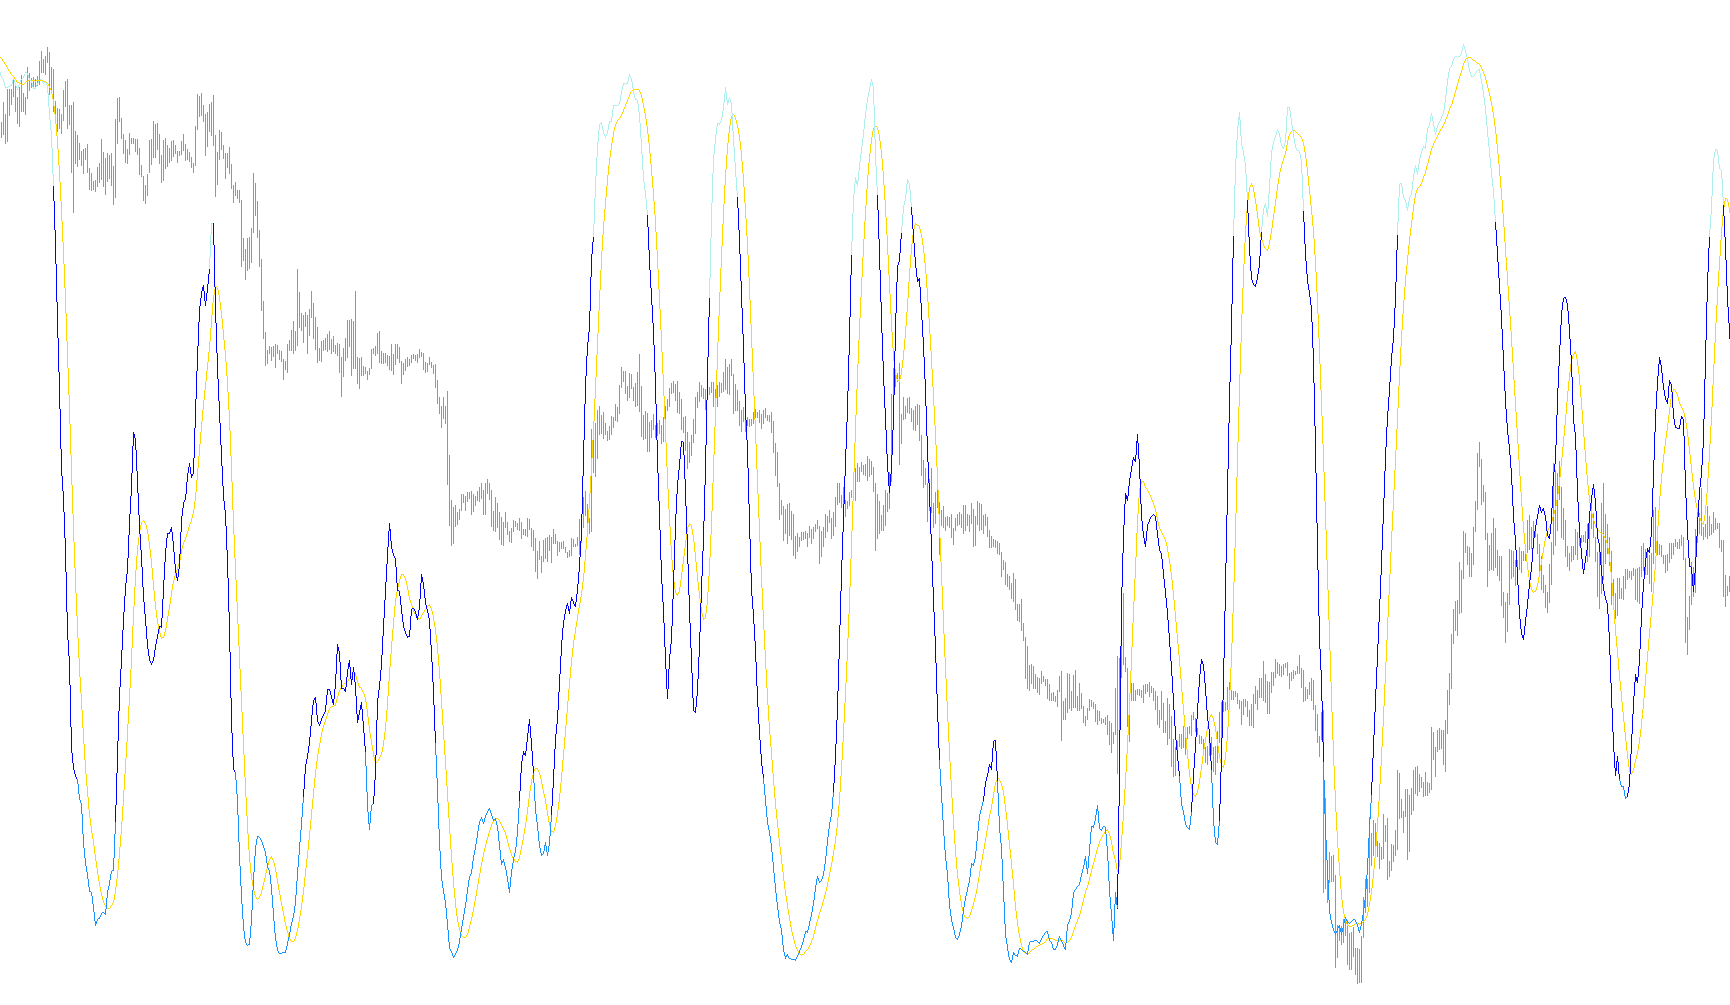
CoeffofLine_true
Indicator

CoeffofLine_true

iMA

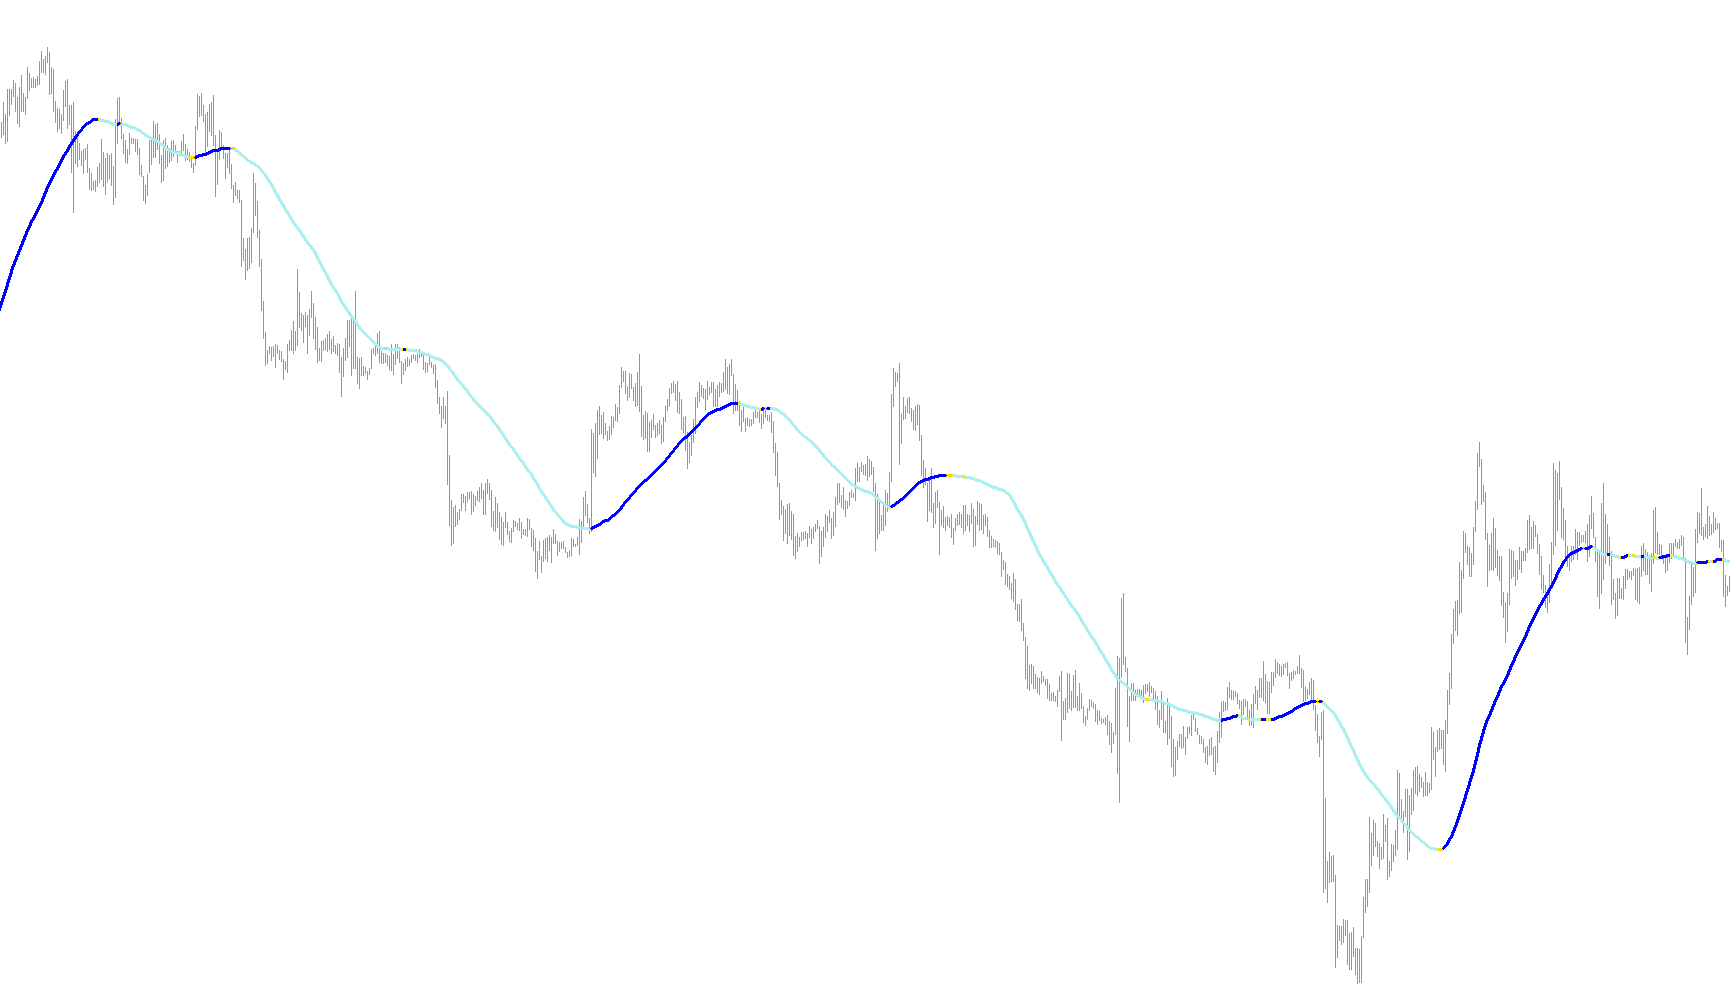
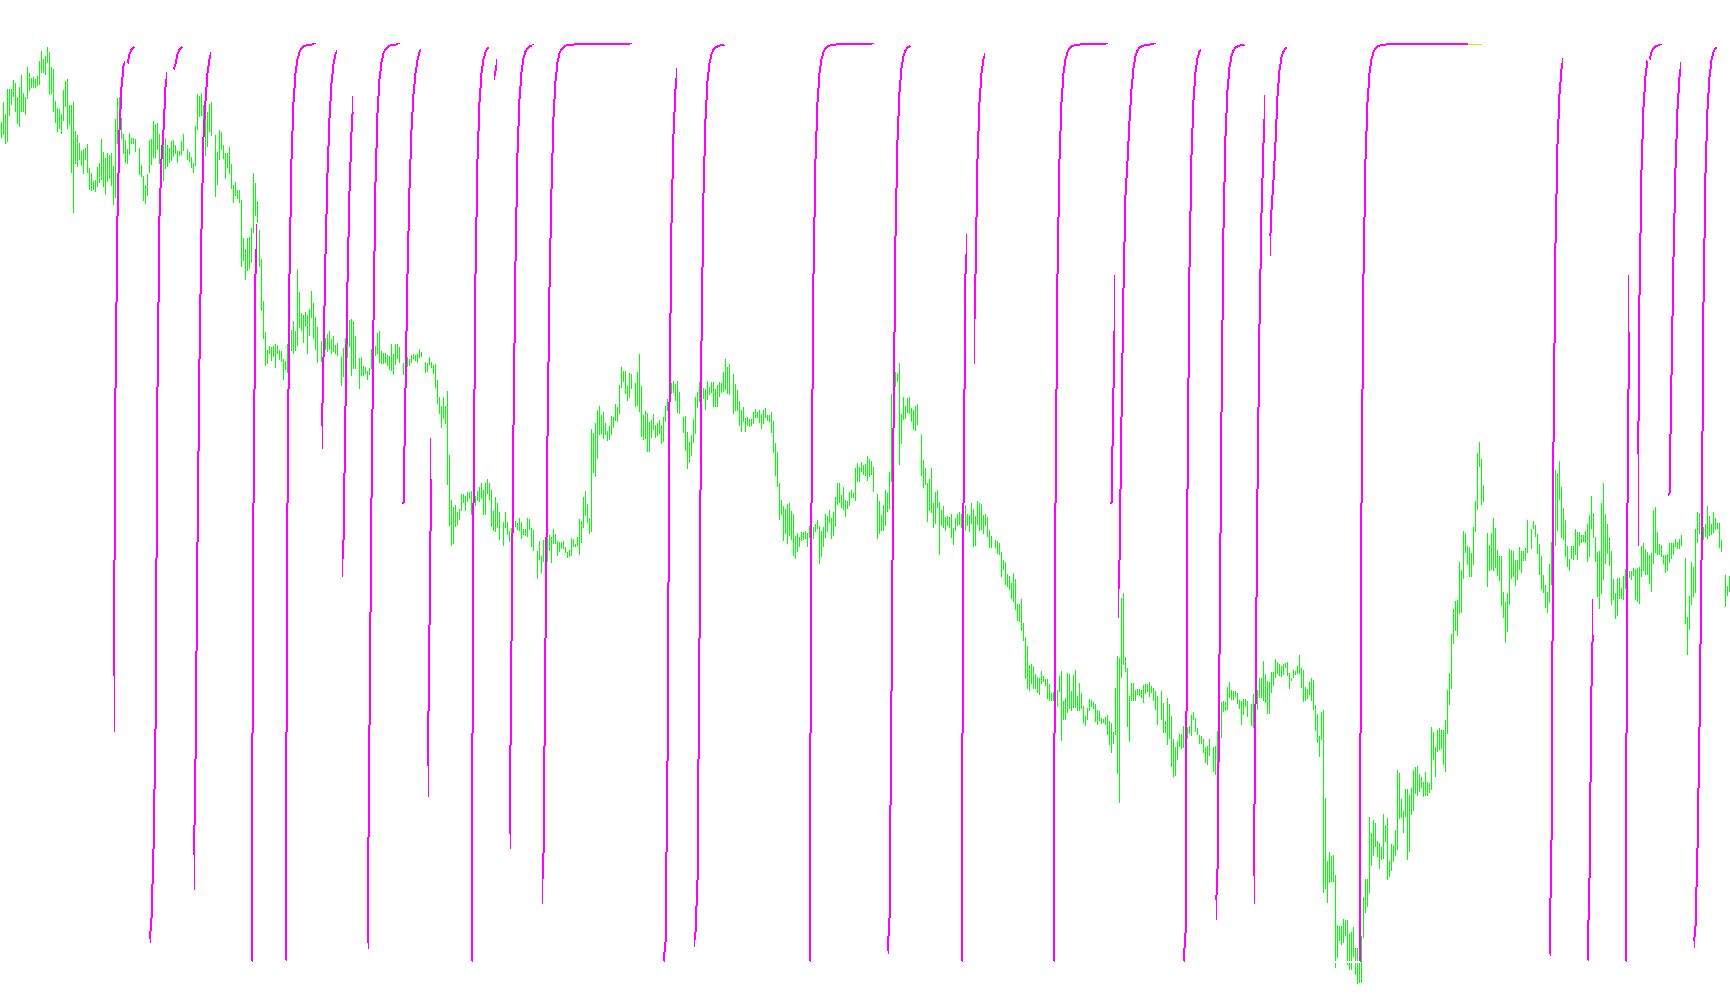
The algorithm calculates the logarithmic ratio between price-weighted averages and smoothed moving averages to identify structural volatility discrepancies.

CoeffofLine_true2
Indicator

CoeffofLine_true2

iMA

Calculates the logarithmic ratio between weighted price median averages and smoothed moving average components to quantify structural volatility.

CoeffofLine_trueEdit
Indicator

CoeffofLine_trueEdit

iMA

This indicator calculates the logarithmic ratio between a weighted price median and a smoothed moving average to identify trend momentum reversals.

CoeffofLine_true_v1
Indicator

CoeffofLine_true_v1

iMA

This indicator quantifies the logarithmic variance between a weighted average of median prices and a smoothed moving average to detect overextended market momentum.

CoeffofLine_v1
Indicator

CoeffofLine_v1

iMA

Calculates the logarithmic ratio between weighted price averages and smoothed moving averages to identify momentum disparities across specific currency pairs.

CoeffofLine_v1_v1
Indicator

CoeffofLine_v1_v1

iMA

The logic calculates the logarithmic ratio between weighted median price averages and smoothed moving average aggregates to identify relative volatility shifts.

CoeffofLine_v1_v2
Indicator

CoeffofLine_v1_v2

iMA

Calculates the logarithmic variance between weighted price medians and smoothed moving averages to identify momentum divergence.

CoeffofLine_v2
Indicator

CoeffofLine_v2

iMA

This indicator calculates the logarithmic ratio between weighted price medians and smoothed moving averages to identify structural equilibrium shifts.

CoeffoLine_fixed
Indicator

CoeffoLine_fixed

iMA

Calculates the logarithmic ratio between weighted price midpoints and smoothed moving averages to identify momentum asymmetries.

CoeffoLine_Hist
Indicator

CoeffoLine_Hist

iMA

This indicator calculates the logarithmic ratio between price-weighted moving averages and smoothed median averages to identify underlying structural momentum.

CoeffoLine_Hist1
Indicator

CoeffoLine_Hist1

iMA

The algorithm calculates the logarithmic ratio between weighted price midpoints and smoothed moving averages to identify statistical deviations from equilibrium.

CoeffoLine_Hist1_v1
Indicator

CoeffoLine_Hist1_v1

iMA

The indicator computes the logarithmic ratio between weighted price midpoints and smoothed moving average deviations to identify momentum asymmetries.

CoeffoLine_Hist2
Indicator

CoeffoLine_Hist2

iMA

The indicator calculates a logarithmic ratio between weighted price averages and smoothed median moving averages to identify momentum shifts.

CoeffoLine_Hist_001
Indicator

CoeffoLine_Hist_001

iMA

The indicator calculates the logarithmic ratio between weighted price midpoints and smoothed median moving averages to highlight divergence in volatility structures.

CoeffoLine_Hist_v1
Indicator

CoeffoLine_Hist_v1

iMA

This indicator calculates the logarithmic ratio between weighted price medians and smoothed moving average components to identify structural volatility deviations.

CoeffoLine_Hist_v2
Indicator

CoeffoLine_Hist_v2

iMA

The script calculates a normalized logarithmic ratio between price-weighted linear moving averages and smoothed median moving averages to highlight structural momentum shifts.

Coffie_v1
Indicator

Coffie_v1

iMA

This indicator calculates the logarithmic ratio between weighted price averages and smoothed median moving averages to identify structural momentum shifts.

COG THV
Indicator

COG THV

iStdDev

This indicator utilizes a Gauss elimination matrix to solve for polynomial coefficients, projecting price trends and calculating multi-layered standard deviation envelopes based on regression variance.

COG
Indicator

COG

iStdDev

This indicator calculates a dynamic non-linear price path using polynomial regression coefficients and generates multi-layered volatility bands based on weighted standard deviation.

Cog_Histo
Indicator

Cog_Histo

This indicator visualizes trend polarity by comparing two distinct Center of Gravity calculations to identify shifts in equilibrium and directional dominance.

Indicator

CoinFlip_v01

Indicator

CoinFlip_v02

iMomentum
Indicator

CoinFlip_v03

CollectData
Indicator

CollectData

Asynchronously captures real-time timestamped price coordinates into a persistent CSV database for external analytical logging.

collect_forexite_quotes
Indicator

collect_forexite_quotes

This script parses individual daily quotation files from a specific directory, filters for a designated symbol, and consolidates the historical data into a single unified CSV file.

Color Moving average
Indicator

Color Moving average

iMA

This indicator dynamically updates a moving average line color to visualize trend direction by detecting changes in price momentum relative to historical averages.

Indicator

Color RSI with allert

iRSI
Indicator

Color RSI

iRSI
Indicator

Color Stochastic v1.02

iATRiStochastic
Indicator

Color Stochastic v1.03

iATRiStochastic
Indicator

Color Stochastic v1.04

iATRiStochastic
Indicator

Color Stochastic v1.04d test on alert on arrow

iATRiStochastic
Indicator

Color Stochastic v1.04d test on alert on arrow_001

iATRiStochastic
Indicator

Color Stochastic v1[1].02

iATRiStochastic
Color Stochastic
Indicator

Color Stochastic

iStochastic

This indicator visualizes specific price momentum extremes by dynamically plotting color-coded signals only when the stochastic oscillator breaches predefined overbought or oversold thresholds.

Indicator

Color Stochastic_Pivot

iStochastic
Colored Schaff Trend
Indicator

Colored Schaff Trend

iMA

This indicator synthesizes a nested momentum logic by sequentially applying stochastic smoothing to the differences of exponential moving averages.

ColorOsMA
Indicator

ColorOsMA

iMAiMAOnArray

This indicator visualizes the spread between the MACD line and its signal average using a dual-colored histogram to highlight positive and negative momentum shifts.

ColorOsMA_v1
Indicator

ColorOsMA_v1

iMAiMAOnArray

This indicator quantifies price momentum by calculating the differential between a primary MACD line and its signal average, rendered as a dual-color histogram.

ColorOsMA_v2
Indicator

ColorOsMA_v2

iMAiMAOnArray

This indicator quantifies momentum by calculating the difference between the MACD line and its signal line, visually bifurcating positive and negative deviations into distinct colored histograms.

ColorOsMA_v3
Indicator

ColorOsMA_v3

iMAiMAOnArray

This indicator quantifies price momentum by calculating the differential between the MACD line and its signal average, visualized as a color-coded histogram to identify directional shifts.

ColorRSI
Indicator

ColorRSI

iRSI

This indicator dynamically segregates the Relative Strength Index into two distinct visual buffers to differentiate bullish momentum above 50 from bearish pressure below 50.

ColorRSI1
Indicator

ColorRSI1

iRSI

This indicator bifurcates the Relative Strength Index into two distinct visual streams based on a 50-level midpoint crossover to isolate bullish and bearish momentum phases.

ColorRSI_Histo_ZeroLine
Indicator

ColorRSI_Histo_ZeroLine

iRSI

This indicator visualizes price momentum by measuring the deviation of the Relative Strength Index from a 50.0 centerline, rendering dual-colored histograms to signify directional strength shifts.

ColorRSI_Histo_ZeroLine1
Indicator

ColorRSI_Histo_ZeroLine1

iRSI

This indicator visualizes relative strength by calculating the deviation of the RSI value from a 50.0 midpoint, rendering directional histograms above and below the zero line.

Color_MA
Indicator

Color_MA

iMA

This indicator visualizes momentum by dynamically shifting color states based on the incremental direction of an Exponential Moving Average.

Color_Stochastic
Indicator

Color_Stochastic

iStochastic

This indicator highlights extreme price momentum by visually isolating stochastic oscillations that breach pre-defined overbought and oversold thresholds.

ColouredWoodie
Indicator

ColouredWoodie

iCCI

This indicator identifies market sentiment by calculating the crossover and zero-line transitions of fast and slow Commodity Channel Index oscillators to visualize momentum shifts through color-coded histograms.

ColouredWoodiesCCI
Indicator

ColouredWoodiesCCI

iCCI

This indicator computes dual Chande oscillators to differentiate market momentum through a neutral zone filter that dynamically shifts histogram colors based on sign-reversal persistence.

ColouredWoodiesCCI_v1
Indicator

ColouredWoodiesCCI_v1

iCCI

This indicator identifies directional shifts by comparing fast and slow Commodity Channel Index values, utilizing a neutral zone threshold to filter out market noise and highlight confirmed trend momentum through color-coded histograms.