dailybreak.
Download script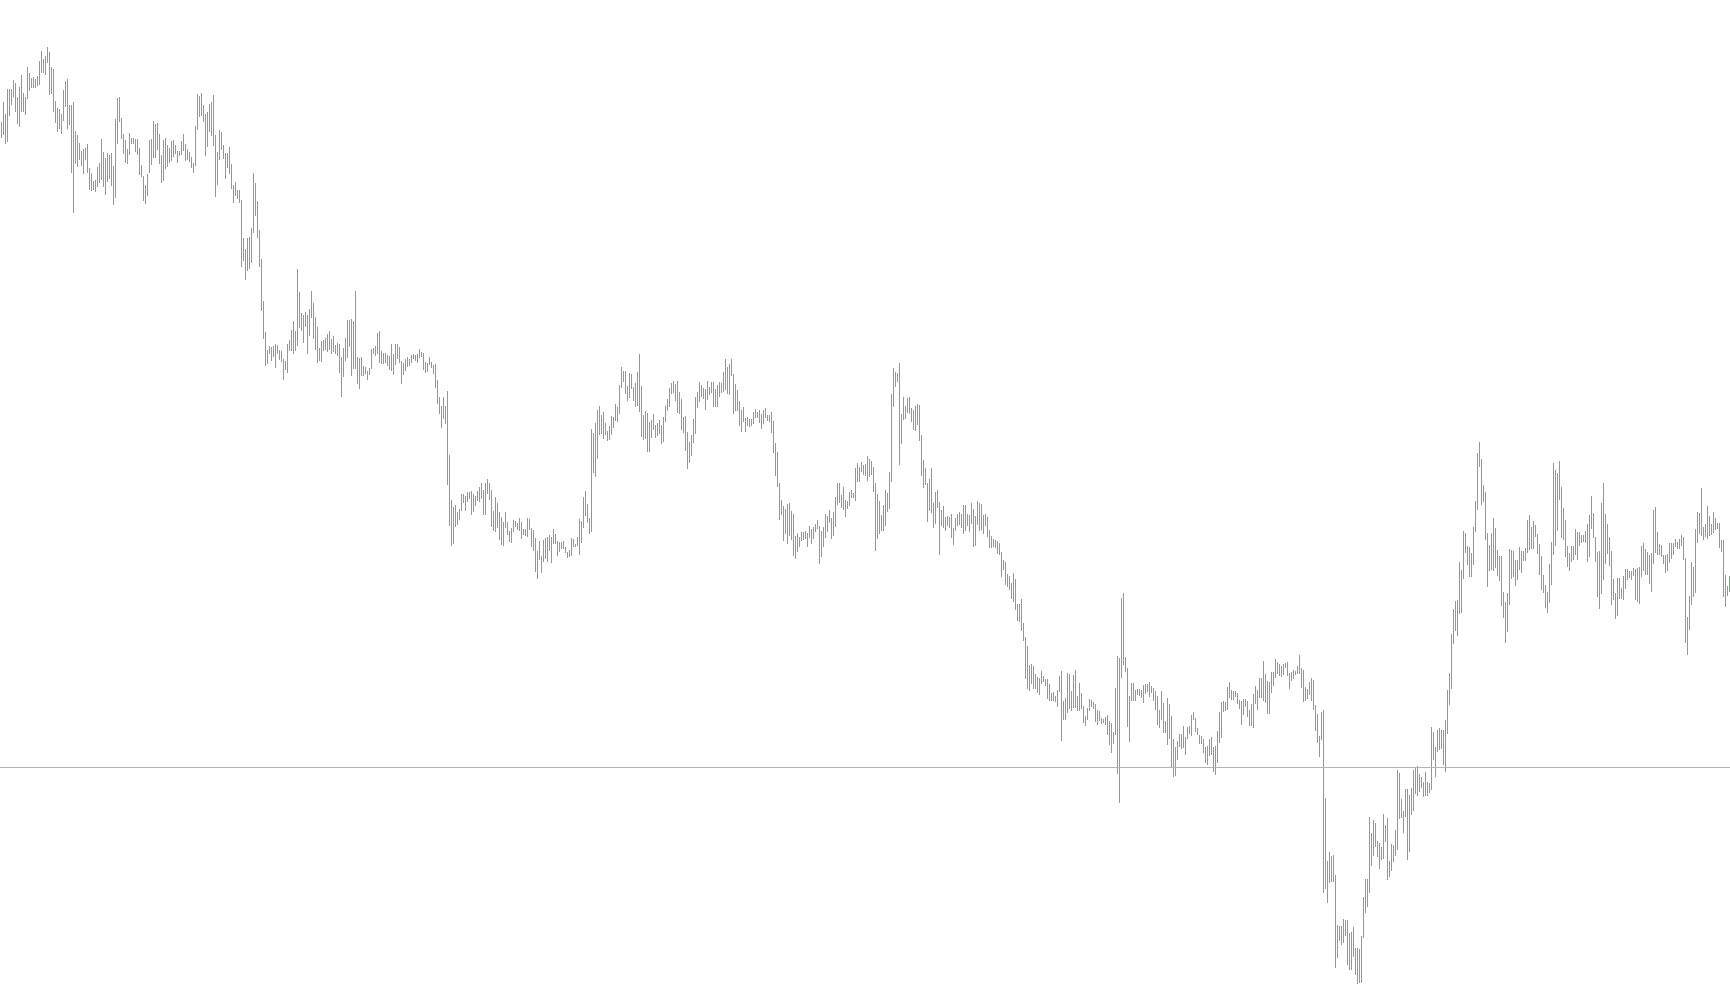
This script is designed to provide traders with a clear visual reference of key price levels based on historical market activity over a specific timeframe. By identifying significant boundaries, it helps users understand where the price has been contained and where potential breakout opportunities might occur.
How the Logic Works
The core objective of this tool is to identify the highest and lowest price points reached during the last five trading days. Here is a breakdown of the process:
1. Data Gathering The script automatically looks back at the previous daily candles on the chart. It specifically pulls the "High" and "Low" values for each day, ignoring the current developing day to ensure the data represents completed price action.
2. Identifying Extremes Once it has gathered the data from the past five days, the script performs a comparative analysis:
- The High Boundary: It scans all five days of data to find the single highest price reached.
- The Low Boundary: It scans the same period to identify the single lowest price reached.
3. Visualizing the Breakout Levels After calculating these two extremes, the script draws two horizontal lines directly on your trading chart:
- Upper Line: Plotted at the 5-day high.
- Lower Line: Plotted at the 5-day low.
4. Dynamic Updates The script is designed to refresh automatically. As new days conclude and old data moves out of the five-day window, the lines will move to reflect the most recent price extremes. This ensures that your "breakout" boundaries are always current.
Practical Application
By displaying these lines, the tool creates a visible "trading range." For a trader, these levels act as significant milestones:
- Breakouts: When the price moves above or below these lines, it indicates that the market is moving outside of its recent five-day range, which can often signal a shift in momentum.
- Support and Resistance: The lines serve as immediate visual cues for where price might encounter heavy buying or selling pressure based on recent history.
//+------------------------------------------------------------------+
//|                                                 5dayBreakout.mq4 |
//|                                                        Bill Sica |
//|                                         http://www.tetsuyama.com |
//+------------------------------------------------------------------+
#property copyright "Bill Sica"
#property link      "http://www.tetsuyama.com"

#property indicator_chart_window
//---- input parameters
extern int       DAYS=5;
//+------------------------------------------------------------------+
//| Custom indicator initialization function                         |
//+------------------------------------------------------------------+

int init()
  {
//---- indicators

//---- indicators


//----
   return(0);
  }

//+------------------------------------------------------------------+
//| Custom indicator iteration function                              |
//+------------------------------------------------------------------+
int start()
  {
   double daily_high[20];
   double daily_low[20];
   double yesterday_close;
   double phigh,plow;
   int i=1;

//---- TODO: add your code here
ArrayResize(daily_high,DAYS);
ArrayResize(daily_low,DAYS);
ArrayInitialize(daily_high,0);
ArrayInitialize(daily_low,0);

ArrayCopySeries(daily_low, MODE_LOW, Symbol(), PERIOD_D1);
ArrayCopySeries(daily_high, MODE_HIGH, Symbol(), PERIOD_D1);

/* initialise */
plow=daily_low[1];
phigh=daily_high[1];

for(i=1;i<DAYS;i++)
{
   if(plow>daily_low[i])
   {
      plow =daily_low[i];
   }
}

for(i=1;i<DAYS;i++)
{
   if(phigh<daily_high[i])
   {
      phigh =daily_high[i];
   }
}

Comment("\n5dayH ",phigh,"\n5dayL ",plow);

ObjectDelete("5dayHigh");
ObjectDelete("5dayLow");

ObjectCreate("5dayHigh", OBJ_HLINE,0, CurTime(),phigh);
ObjectSet("5dayHigh",OBJPROP_COLOR,Aqua);
ObjectSet("5dayHigh",OBJPROP_STYLE,STYLE_SOLID);

ObjectCreate("5dayLow", OBJ_HLINE,0, CurTime(),plow);
ObjectSet("5dayLow",OBJPROP_COLOR,Aqua);
ObjectSet("5dayLow",OBJPROP_STYLE,STYLE_SOLID);

ObjectsRedraw();

   return(0);
  }
//+------------------------------------------------------------------
Comments