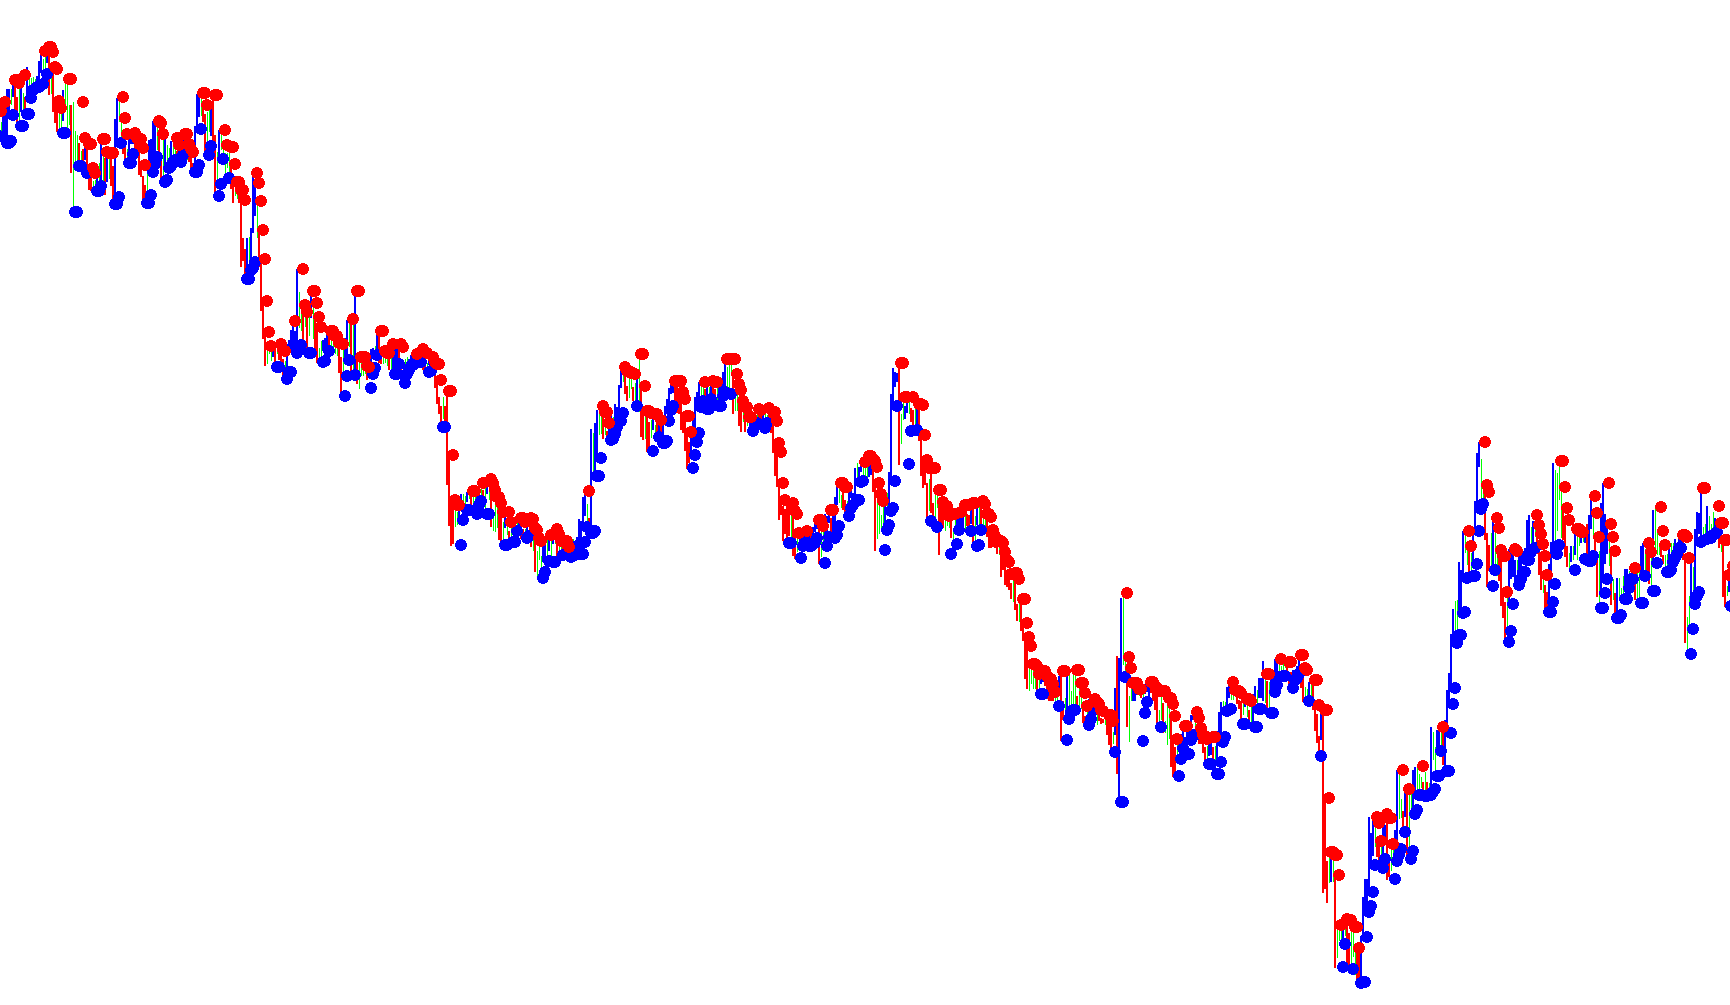
DailyHighLow_v1
Indicator

DailyHighLow_v1

This indicator dynamically identifies and plots the absolute highest and lowest price points achieved during each individual trading day to visualize daily volatility extremes.

DailyPivotPoints
Indicator

DailyPivotPoints

This indicator calculates and visualizes historical daily pivot levels using three distinct mathematical formulas to identify key support and resistance zones based on previous session volatility.

DailyPivotPoints_v1
Indicator

DailyPivotPoints_v1

This indicator calculates and plots historical and real-time daily pivot points, support levels, and resistance zones using four distinct mathematical models based on previous day's price action.

DailyPivot_Shift
Indicator

DailyPivot_Shift

This indicator dynamically calculates and projects multi-level support and resistance zones based on historical price extremes adjusted by a customizable time offset.

Indicator

DailyTrader

Daily_High_Low
Indicator

Daily_High_Low

This indicator identifies and plots horizontal dashed lines representing the highest and lowest price points reached during the preceding 24-hour trading session.

daily_open_line  GMT 2  LA
Indicator

daily_open_line GMT 2 LA

This indicator identifies and projects the horizontal price level of each session's initial opening candle while accounting for specific timezone offsets to synchronize daily boundaries.

daily_open_line
Indicator

daily_open_line

Identifies and projects the specific price level at the commencement of each new trading day based on user-defined temporal offsets.

daily_open_line_001
Indicator

daily_open_line_001

This indicator identifies and plots the precise opening price of each new trading day based on a user-defined timezone offset to establish horizontal price levels.

Daily_range
Indicator

Daily_range

This indicator calculates and plots horizontal support and resistance levels based on the arithmetic mean of high, low, and closing prices from the previous daily candle.

Daily_Research
Indicator

Daily_Research

This script evaluates historical price action to calculate the statistical frequency of candle reversals, body types, and wick lengths to estimate the probability of hitting specific profit targets.

Damiani_volatmeter
Indicator

Damiani_volatmeter

iATRiStdDev

This indicator identifies high-intensity market movements by calculating the ratio between short-term and long-term Average True Ranges while filtering for signal-to-noise thresholds.

Damiani_volatmeter2.i
Indicator

Damiani_volatmeter2.i

iATRiStdDev

This indicator calculates a volatility quotient by comparing short-term ATR against long-term ATR and standard deviation metrics to filter for high-momentum market expansion.

Damiani_volatmeterNoInputs
Indicator

Damiani_volatmeterNoInputs

iATRiStdDev

The indicator quantifies market intensity by calculating the ratio between short-term and long-term Average True Range while applying a dynamic standard deviation threshold to filter out non-tradeable noise.

Damiani_volatmeter_v1
Indicator

Damiani_volatmeter_v1

iATRiStdDev

This indicator quantifies market momentum by calculating the ratio between short-term and long-term Average True Ranges while applying a standard deviation threshold to isolate high-probability trade signals from market noise.

Damiani_volatmeter_v2
Indicator

Damiani_volatmeter_v2

iATRiStdDev

The indicator identifies high-probability trading zones by calculating the ratio between short-term and long-term Average True Range (ATR) and comparing it against a dynamic standard deviation threshold to filter out market noise.

Damiani_volatmeter_v3
Indicator

Damiani_volatmeter_v3

iATRiStdDev

The logic calculates a relative volatility coefficient by comparing short-term ATR to long-term ATR and filters actionable signals based on a dynamic standard deviation threshold.

Damiani_Volt
Indicator

Damiani_Volt

iATRiStdDev

The indicator identifies high-momentum entries by comparing the ratio of short-term Average True Range to long-term ATR against a dynamic standard deviation threshold.

Indicator

Damiani_Volt_mtf

Damiani_Volt_v1
Indicator

Damiani_Volt_v1

iATRiStdDev

This indicator identifies high-momentum market entries by comparing a normalized Average True Range against a dynamic Standard Deviation threshold to detect significant price expansion.

Darma Pivots
Indicator

Darma Pivots

This indicator calculates multi-layered pivot points and support/resistance levels by synthesizing daily price extremes, opening values, and closing data into customizable geometric anchors.

Darma Pivots_v1
Indicator

Darma Pivots_v1

This indicator calculates and projects multi-layered support, resistance, and central pivot levels based on daily price extremes and opening values.

Darma System Indicator (beta)
Indicator

Darma System Indicator (beta)

iSAR

This indicator identifies trend reversals by detecting specific price action shifts where pivot point extremes align with Parabolic SAR dot transitions.

Darma System Indicator (beta)_v1
Indicator

Darma System Indicator (beta)_v1

iSAR

This system identifies bullish and bearish sentiment shifts by monitoring the transition of polarity dots relative to price extremes and confirming the signal with completed colored histogram bars.

Darma System Indicator (beta)_v2
Indicator

Darma System Indicator (beta)_v2

iSAR

The system identifies reversal opportunities by detecting transitions in dot-based sentiment indicators and confirming them with specific price action bar colorations.

Darma System Indicator (beta)_v3
Indicator

Darma System Indicator (beta)_v3

iSAR

This system identifies trend reversals by monitoring the transition of polarity dots and subsequent bar color shifts to trigger breakout entries.

Darvas Boxes
Indicator

Darvas Boxes

This indicator dynamically identifies price breakout boundaries by tracking sequential high and low extremes to define non-overlapping trading zones.

darvas
Indicator

darvas

The algorithm identifies price momentum by dynamically evolving a multi-state containment boundary that captures local high and low extremes across sequential price candles.

DarvasBoxes
Indicator

DarvasBoxes

This indicator dynamically maps price boundaries by identifying structural supply and demand zones to signal trend continuations or reversals.

DashBoard_v1.4_pn
Indicator

DashBoard_v1.4_pn

iACiAOiSAR

This indicator monitors multiple currency pairs and commodities across varied timeframes, generating synchronized buy/sell alerts based on concurrent bullish or bearish crossovers of the Parabolic SAR, Awesome Oscillator, and Awesome Money indicators.

DavidF_Hedge_chart
Indicator

DavidF_Hedge_chart

The script monitors the synthetic Forward Price Index (FPI) by calculating the cross-product discrepancy between EUR/USD, USD/CHF, and EUR/CHF pairs to identify equilibrium deviations.

Indicator

Day Chenel

DayBorders
Indicator

DayBorders

This script dynamically visualizes the previous calendar day's opening and closing price levels alongside vertical time markers to delineate historical trading boundaries.

DayChanelGLORINIKA_NikitaK_en
Indicator

DayChanelGLORINIKA_NikitaK_en

A comprehensive technical tool that maps daily price ranges, Fibonacci retracement levels, and multi-period structural boundaries (H1, H4, Weekly) to identify high-probability entry zones and trend transitions.

DayChannel(Mix edition)
Indicator

DayChannel(Mix edition)

This indicator dynamically tracks the daily price extremes and calculates a median equilibrium line by resetting at specific midnight intervals.

DayChannel(Mix_edition)
Indicator

DayChannel(Mix_edition)

The indicator dynamically projects a price boundary by identifying the absolute high and low extremes reached from midnight until 12:30 AM daily.

dayHL
Indicator

dayHL

This indicator dynamically projects historical daily pivot points, resistance levels, and support zones by calculating the midpoint and extremes of the preceding day's price action.

dayHL_v1
Indicator

dayHL_v1

This indicator projects horizontal support and resistance levels based on the extreme high and low price points established during the preceding trading day.

dayHL_v2
Indicator

dayHL_v2

This indicator dynamically projects the previous day's high, low, and mid-point median levels onto the current chart to identify key structural support and resistance zones.

dayHL_v3
Indicator

dayHL_v3

This indicator dynamically projects historical support, resistance, and midpoint levels based on the previous day's high and low extremes.

dayHL_v4
Indicator

dayHL_v4

Calculates and plots daily support, resistance, and pivot points based on the previous day's price extremes.

DayImplus 1.1
Indicator

DayImplus 1.1

iMAOnArray

This indicator calculates the cumulative sum of price discrepancies between opening and closing prices over a rolling window, applying an optional smoothing average to identify momentum shifts.

DayImplus 1.1_v1
Indicator

DayImplus 1.1_v1

iMAOnArray

Quantifies historical price action by aggregating the cumulative difference between opening and closing prices over a defined period to identify directional bias.

DayImpuls
Indicator

DayImpuls

The logic quantifies aggregate price discrepancies between opening and closing prices over a rolling temporal window to identify directional momentum shifts.

DayImpuls1
Indicator

DayImpuls1

This indicator calculates the cumulative price spread over a rolling period to generate a smoothed momentum signal processed through a Triple Exponential Moving Average (T3) filter.

DayImpuls1_v1
Indicator

DayImpuls1_v1

This indicator calculates a smoothed impulse momentum value using the T3 moving average algorithm applied to the sum of price gaps, complemented by dynamic high-low channel boundaries.

DayImpulse2DD
Indicator

DayImpulse2DD

iMAOnArray

This indicator quantifies cumulative price displacement over a defined lookback period and projects the resulting aggregate momentum forward to visualize potential trend trajectory.

DayImpulse2DD_v1
Indicator

DayImpulse2DD_v1

iMAOnArray

This indicator quantifies cumulative price momentum by aggregating historical candle body ranges and projecting the resulting aggregate value forward into a predefined offset.

DayImpulse2DD_v2
Indicator

DayImpulse2DD_v2

iMAOnArray

This indicator calculates the aggregate price movement over a specific period and projects it forward to visualize potential momentum trends.

DayImpulseOverlay
Indicator

DayImpulseOverlay

This indicator aggregates historical price delta over a specified period and projects a shifted momentum overlay to visualize potential trend velocity.