Daily M LEVELS
Download script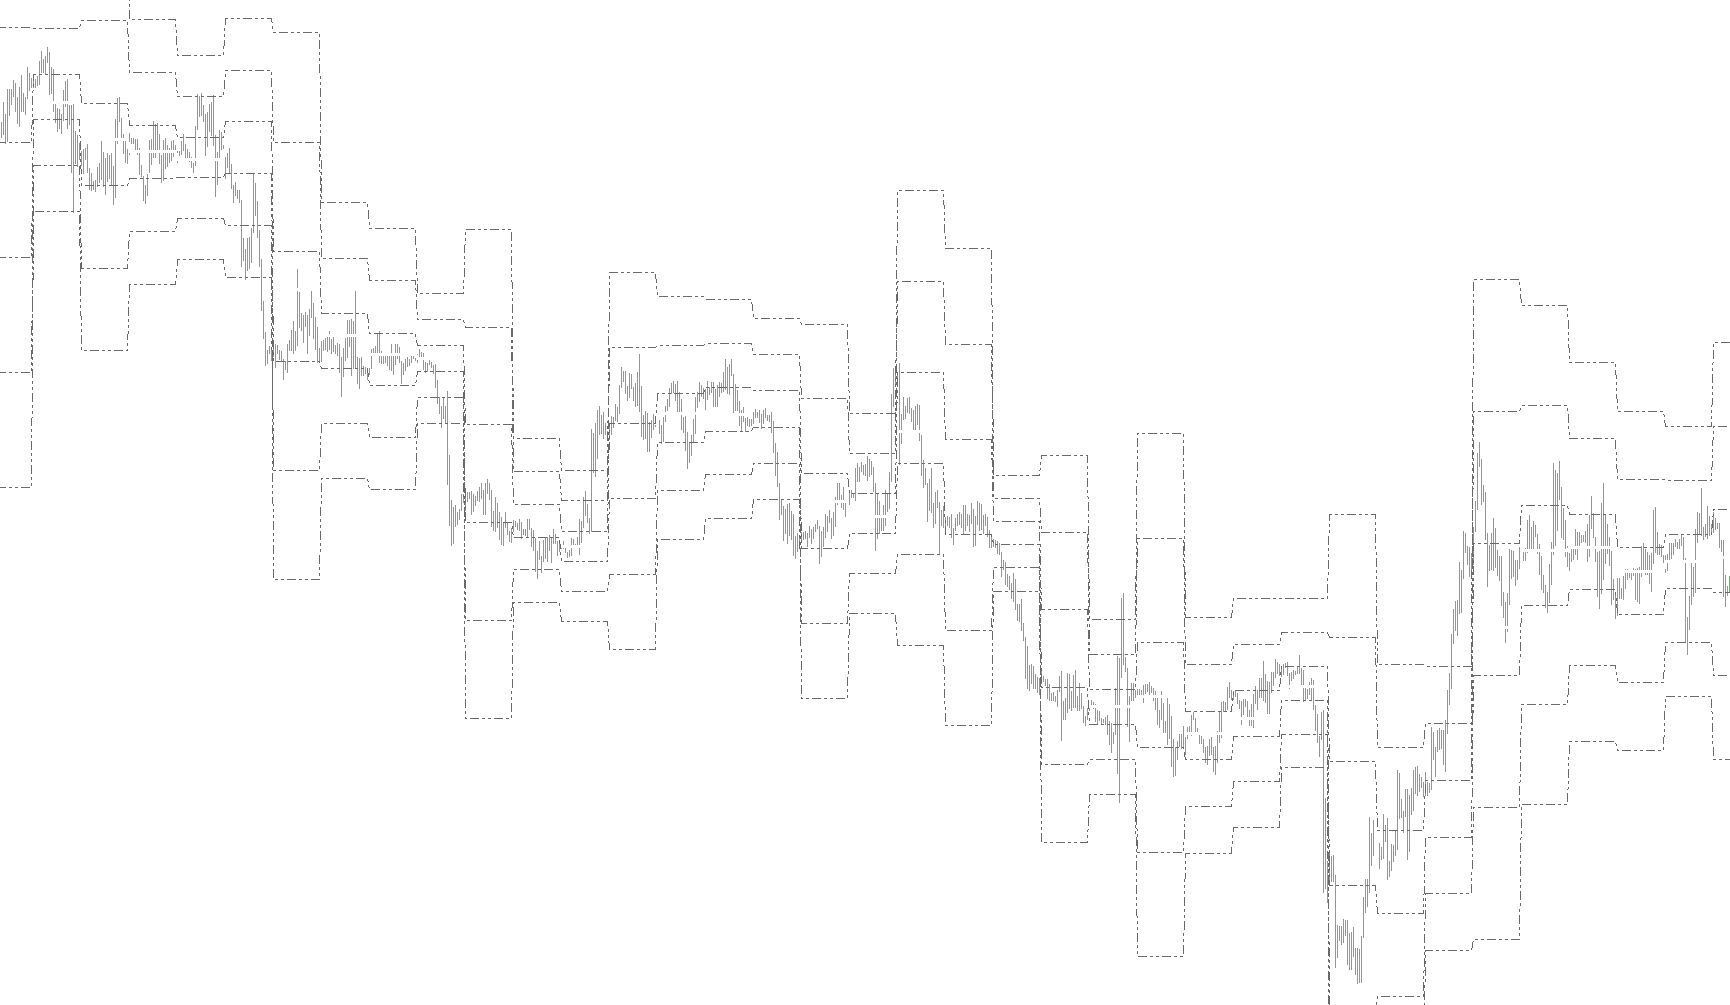
This script is designed to provide traders with visual and analytical support by automatically calculating and plotting key price levels on a chart. Specifically, it identifies critical "Pivot Points" and associated Support and Resistance levels based on previous market activity.
Core Functionality
The primary goal of this tool is to help users visualize where the market might find balance or experience turning points. It uses the high, low, and closing prices from a completed day to project several significant price targets for the following trading period.
How the Logic Works
To provide these levels accurately, the script follows a specific logical sequence:
- Historical Data Analysis: The tool looks back at the price movement of the previous trading session. It identifies the highest price reached (High) and the lowest price reached (Low).
- The Pivot Point Calculation: Once it has identified the previous session's high, low, and closing price, it calculates a central "Pivot" price. This acts as the baseline or "equilibrium" for the current trading day.
- Support and Resistance Projection: Using that central Pivot Point as a base, the script performs a series of mathematical calculations to project five additional levels:
- Support Levels (M0, M1, M2): These represent price zones where buying interest is traditionally expected to increase, potentially preventing the price from falling further.
- Resistance Levels (M3, M4, M5): These represent price zones where selling pressure is typically higher, potentially preventing the price from rising further.
- Real-Time Visualization: The script automatically draws these levels as lines on your chart. Every time a new day begins, the tool detects the change in the date and recalculates all levels based on the newest set of data, moving the labels and lines to their updated positions.
User Experience Highlights
- Automatic Updates: You do not need to manually calculate these numbers; the script updates automatically as new daily candles close.
- Visual Clarity: The indicator distinguishes between different types of levels using different line styles and colors, making it easy to read at a glance during active trading.
- Timeframe Compatibility: It is designed to work on intraday timeframes (lower than 4 hours), ensuring that the daily levels are clearly visible while you monitor shorter-term price fluctuations.
14
Views
0
Downloads
0
Favorites
Daily M LEVELS
//+------------------------------------------------------------------+
//|                                               Daily M LEVELS.mq4 |
//|                      Copyright © 2006, MetaQuotes Software Corp. |
//|                                        http://www.metaquotes.net |
//+------------------------------------------------------------------+
#property copyright "Copyright © 2006, MetaQuotes Software Corp."
#property link      "http://www.metaquotes.net"

#property indicator_chart_window
//#property indicator_separate_window
#property indicator_buffers 7
#property indicator_color1 LightSlateGray
#property indicator_color2 DimGray
#property indicator_color3 DimGray
#property indicator_color4 DimGray
#property indicator_color5 DimGray
#property indicator_color6 DimGray
#property indicator_color7 DimGray
//---- input parameters

//---- buffers
double PBuffer[];
double M0Buffer[];
double M1Buffer[];
double M2Buffer[];
double M3Buffer[];
double M4Buffer[];
double M5Buffer[];
string Pivot="Pivot Point",Sup11="M 2", Res11="M 3";
string Sup22="M 1", Res22="M 4", Sup33="M 0", Res33="M 5";
int fontsize=8;
double P,M0,M1,M2,M3,M4,M5;
double LastHigh,LastLow,x;

//+------------------------------------------------------------------+
//| Custor indicator deinitialization function                       |
//+------------------------------------------------------------------+
int deinit()
  {
//---- TODO: add your code here

   ObjectDelete("Pivot");
   ObjectDelete("Sup11");
   ObjectDelete("Res11");
   ObjectDelete("Sup22");
   ObjectDelete("Res22");
   ObjectDelete("Sup33");
   ObjectDelete("Res33");

//----
   return(0);
  }
//+------------------------------------------------------------------+
//| Custom indicator initialization function                         |
//+------------------------------------------------------------------+
int init()
  {
   string short_name;


//---- indicator line
   SetIndexStyle(0,DRAW_LINE,0,3,LightSlateGray);

   SetIndexStyle(1,DRAW_LINE,STYLE_DASHDOTDOT,1,DimGray);
   SetIndexStyle(2,DRAW_LINE,STYLE_DASHDOTDOT,1,DimGray);
   SetIndexStyle(3,DRAW_LINE,STYLE_DASHDOTDOT,1,DimGray);
   SetIndexStyle(4,DRAW_LINE,STYLE_DASHDOTDOT,1,DimGray);
   SetIndexStyle(5,DRAW_LINE,STYLE_DASHDOTDOT,1,DimGray);
   SetIndexStyle(6,DRAW_LINE,STYLE_DASHDOTDOT,1,DimGray);
   SetIndexBuffer(0,PBuffer);
   SetIndexBuffer(1,M0Buffer);
   SetIndexBuffer(2,M1Buffer);
   SetIndexBuffer(3,M2Buffer);
   SetIndexBuffer(4,M3Buffer);
   SetIndexBuffer(5,M4Buffer);
   SetIndexBuffer(6,M5Buffer);


//---- name for DataWindow and indicator subwindow label
   short_name="Daily M LEVELS";
   IndicatorShortName(short_name);
   SetIndexLabel(0,short_name);

//----
   SetIndexDrawBegin(0,1);
//----


//----
   return(0);
  }

//+------------------------------------------------------------------+
//| Custom indicator iteration function                              |
//+------------------------------------------------------------------+
int start()

  {
   int    counted_bars=IndicatorCounted();

   int limit, i;
//---- indicator calculation
if (counted_bars==0)
{
   x=Period();
   if (x>240) return(-1);
   ObjectCreate("Pivot", OBJ_TEXT, 0, 0,0);
   ObjectSetText("Pivot", "             Pivot ",fontsize,"Arial ",Red);
   SetIndexLabel(0, "Pivot Point");
   ObjectCreate("Sup11", OBJ_TEXT, 0, 0, 0);
   ObjectSetText("Sup11", "         M 2",fontsize,"Arial",Gray);
   SetIndexLabel(3, "M2");
   ObjectCreate("Res11", OBJ_TEXT, 0, 0, 0);
   ObjectSetText("Res11", "         M 3",fontsize,"Arial",Gray);
   SetIndexLabel(4, "M3");
   ObjectCreate("Sup22", OBJ_TEXT, 0, 0, 0);
   ObjectSetText("Sup22", "         M 1",fontsize,"Arial",Gray);
   SetIndexLabel(2, "M1");
   ObjectCreate("Res22", OBJ_TEXT, 0, 0, 0);
   ObjectSetText("Res22", "         M 4",fontsize,"Arial",Gray);
   SetIndexLabel(5, "M4");
   ObjectCreate("Sup33", OBJ_TEXT, 0, 0, 0);
   ObjectSetText("Sup33", "         M 0",fontsize,"Arial",Gray);
   SetIndexLabel(1, "M0");
   ObjectCreate("Res33", OBJ_TEXT, 0, 0, 0);
   ObjectSetText("Res33", "         M 5",fontsize,"Arial",Gray);
   SetIndexLabel(6, "M5");
}
   if(counted_bars<0) return(-1);
//---- last counted bar will be recounted
//   if(counted_bars>0) counted_bars--;
   limit=(Bars-counted_bars)-1;

for (i=limit; i>=0;i--) {
if (TimeDayOfWeek(Time[i+1])!=0){ // Monday Fix

if (High[i+1]>LastHigh) LastHigh=High[i+1];
if (Low[i+1]<LastLow) LastLow=Low[i+1];

if (TimeDay(Time[i])!= TimeDay(Time[i+1]))
   {
   P=(LastHigh+LastLow+Close[i+1])/3;
   M0 = (P-(LastHigh - LastLow)+(2*P)-((2* LastHigh)-LastLow))/2;           //S3(2*P)-((2* LastHigh)-LastLow);
   M1 = ((2*P)-LastHigh + P-(LastHigh - LastLow))/2;       //S2P-(LastHigh - LastLow);
   M2 = (P + (2*P)-LastHigh)/2;           //S1(2*P)-LastHigh;
   M3 = (P + (2*P)-LastLow)/2;    //R1(2*P)-LastLow;
   M4 = ((2*P)-LastLow + P+(LastHigh - LastLow))/2;    //R2P+(LastHigh - LastLow);
   M5 = ((2*P)+(LastHigh-(2*LastLow))+P+(LastHigh - LastLow))/2;         //R3(2*P)+(LastHigh-(2*LastLow));

   LastLow=Open[i]; LastHigh=Open[i];

   ObjectMove("Pivot", 0, Time[i],P);
   ObjectMove("Sup11", 0, Time[i],M2);
   ObjectMove("Res11", 0, Time[i],M3);
   ObjectMove("Sup22", 0, Time[i],M1);
   ObjectMove("Res22", 0, Time[i],M4);
   ObjectMove("Sup33", 0, Time[i],M0);
   ObjectMove("Res33", 0, Time[i],M5);
   }
}
    PBuffer[i]=P;
    M0Buffer[i]=M0;
    M1Buffer[i]=M1;
    M2Buffer[i]=M2;
    M3Buffer[i]=M3;
    M4Buffer[i]=M4;
    M5Buffer[i]=M5;

}

//----
   return(0);
  }
//+------------------------------------------------------------------+
Comments