Cycle_KROUFR_version_MTF
Download script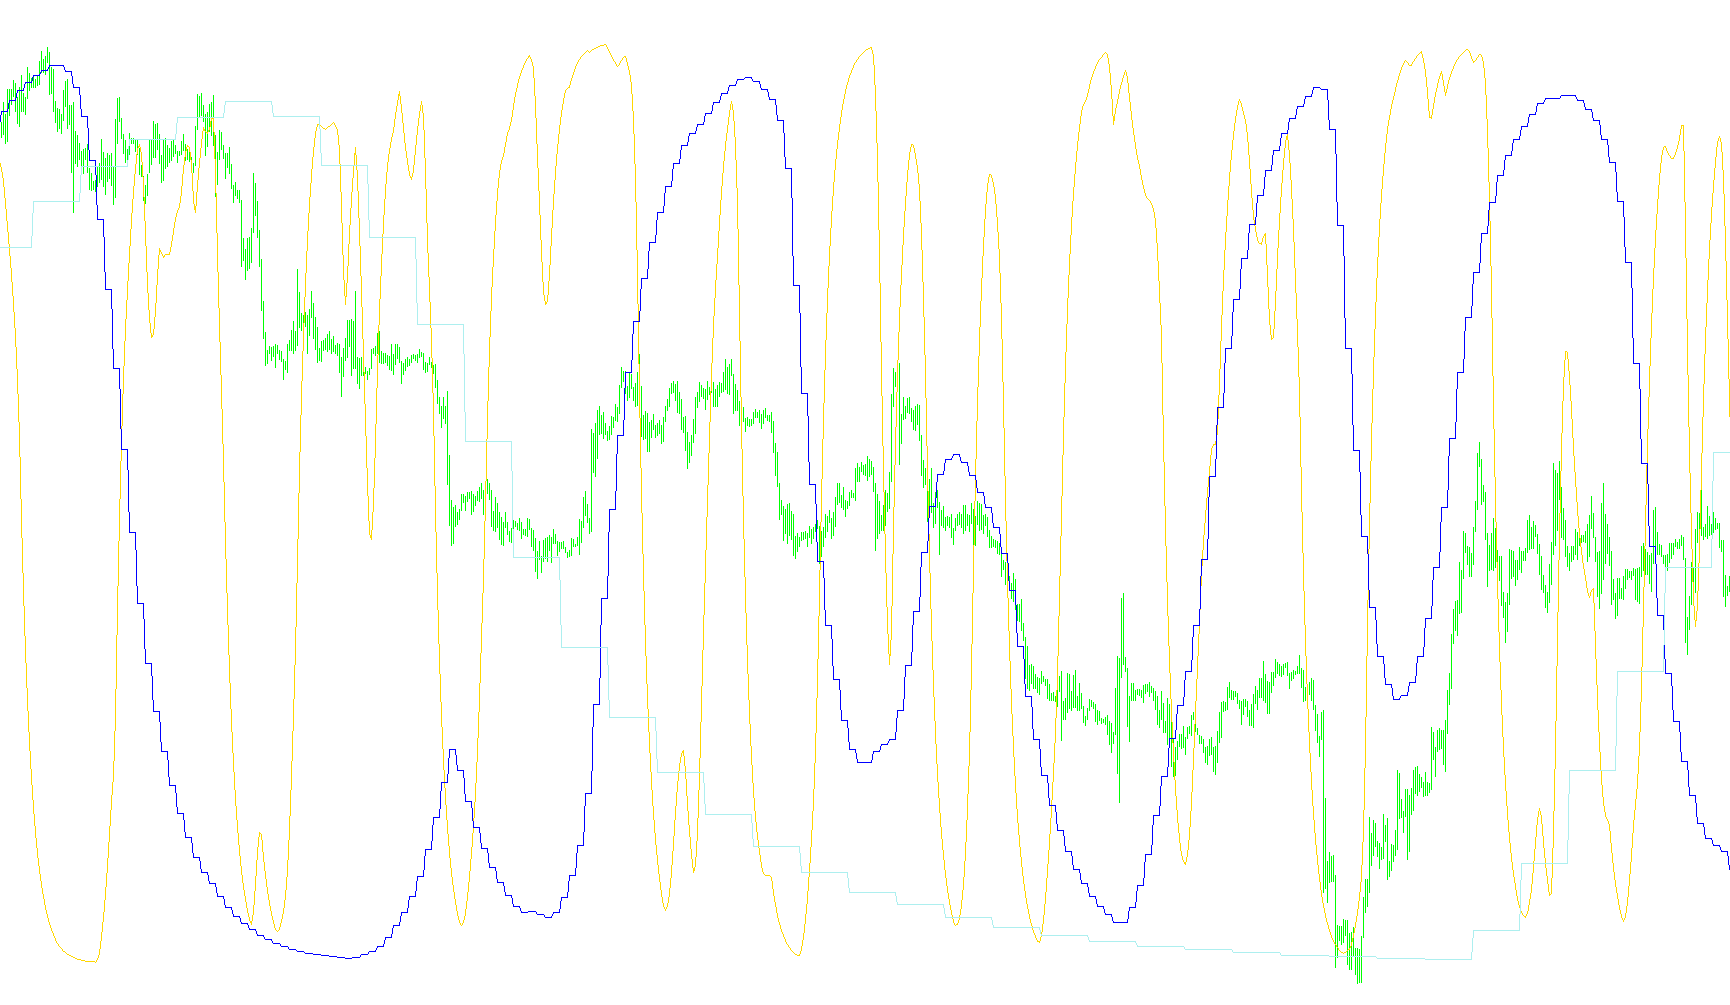
This tool is designed to provide traders with a comprehensive view of market dynamics by analyzing price cycles across three different timeframes simultaneously. Instead of looking at the market through a single lens, it layers multiple perspectives into one unified visual display, helping to identify broader trends that might be missed when viewing only one chart type.
Core Functionality
The script works by pulling data from three distinct time periods (configurable by the user) and displaying them as separate lines on a single indicator window. By synchronizing these different scales, it allows you to see how short-term price action relates to medium-term movements and long-term cycles at a glance.
How the Logic Works
- Multi-Timeframe Integration: The script automatically calculates and retrieves data from three specific timeframes. It maps these values back to the current chart, ensuring that even if you are looking at a small timeframe (like a 5-minute chart), you can still see the "big picture" cycles occurring in much larger time periods.
- Dynamic Data Retrieval: For every point on your current chart, the script performs a calculation to find the corresponding point in time for the three larger periods. This ensures that the lines plotted are accurately aligned with the current moment in history.
- Cycle Analysis: The tool utilizes a specific "Cycle KROUFR" logic to determine its values. It processes these cycles using three adjustable parameters: a fast movement average, a slow movement average, and a crossover threshold. This helps smooth out market "noise" so you can focus on the underlying momentum.
- Visual Organization: The output is organized into three distinct lines (represented in different colors). This allows for an immediate visual comparison:
- One line represents the immediate cycle.
- The second represents the intermediate trend.
- The third represents the long-term market cycle.
Summary for the User
By using this script, you are essentially creating a "macro" view of the market on your "micro" chart. It is intended to help you identify whether the current price movement is supported by the larger trends or if it is deviating from the established long-term cycles. This dual-layered perspective helps in identifying high-probability areas for entries and exits by confirming that multiple timeframes are moving in harmony.
//+------------------------------------------------------------------+
//|                                     MTF_Cycle_KROUFR_version.mq4 |
//+------------------------------------------------------------------+
#property  copyright "Copyright © 2008 | Grayman77, zIG, akadex"
#property  link      "ForexResearch"

#property indicator_separate_window
#property indicator_buffers 3
#property indicator_color1 Red
#property indicator_color2 White
#property indicator_color3 Aqua
#property indicator_level1 80
#property indicator_level2 20
#property indicator_level3 50
#property indicator_levelcolor SlateGray

extern int Period2=240;
extern int Period3=1440;

extern int FastMA=12;
extern int SlowMA=24;
extern int Crosses=50;
extern bool Comments=false;

int Period1=0;

//---- buffers
double ExtMapBuffer1[];
double ExtMapBuffer2[];
double ExtMapBuffer3[];
//+------------------------------------------------------------------+
//| Custom indicator initialization function                         |
//+------------------------------------------------------------------+
int init()
  {
//---- indicators
   SetIndexStyle(0,DRAW_LINE);
   SetIndexBuffer(0,ExtMapBuffer1);
   SetIndexStyle(1,DRAW_LINE);
   SetIndexBuffer(1,ExtMapBuffer2);
   SetIndexStyle(2,DRAW_LINE);
   SetIndexBuffer(2,ExtMapBuffer3);
//----
   return(0);
  }
//+------------------------------------------------------------------+
//| Custom indicator deinitialization function                       |
//+------------------------------------------------------------------+
int deinit()
  {
//----
//ObjectsDeleteAll();
 Comment("");
//----
   return(0);
  }
//+------------------------------------------------------------------+
//| Custom indicator iteration function                              |
//+------------------------------------------------------------------+
int start()
  {
   int    counted_bars=IndicatorCounted();
   int i,limit,tm;
   int p1,p2;
   double vtmp1,vtmp2;
   double pr1,pr2;
      //---- ïðîâåðêà íà âîçìîæíûå îøèáêè
   if(counted_bars<0) return(-1);

   //---- ïîñëåäíèé ïîñ÷èòàííûé áàð áóäåò ïåðåñ÷èòàí
   if(counted_bars>0) counted_bars--;
   limit=Bars-counted_bars;
   if(limit>Bars-2) limit=Bars-2;
//----
p1=0;
p2=0;
pr1=0;
pr2=0;
   //for(i=Bars-2;i>0;i--)
   for(i=limit;i>0;i--)
   {
  datetime _TimeBar=Time[i];
  // ñìåùåíèå òåêóùåé ñâå÷è ÒÔ íà 2 ñòàðøå
  int Shift=iBarShift(Symbol(),Period1,_TimeBar,false);
  int Shift2=iBarShift(Symbol(),Period2,_TimeBar,false)+1;
  int Shift3=iBarShift(Symbol(),Period3,_TimeBar,false)+1;

  double v1=iCustom(Symbol(),Period1,"Cycle_KROUFR_version_",FastMA,SlowMA,Crosses,Comments,0,Shift);
  double v2=iCustom(Symbol(),Period2,"Cycle_KROUFR_version_",FastMA,SlowMA,Crosses,Comments,0,Shift2);
  double v3=iCustom(Symbol(),Period3,"Cycle_KROUFR_version_",FastMA,SlowMA,Crosses,Comments,0,Shift3);

  ExtMapBuffer1[i]=v1;
  ExtMapBuffer2[i]=v2;
  ExtMapBuffer3[i]=v3;

   }
//----
   return(0);
  }
Comments