DailyHighLow
Download script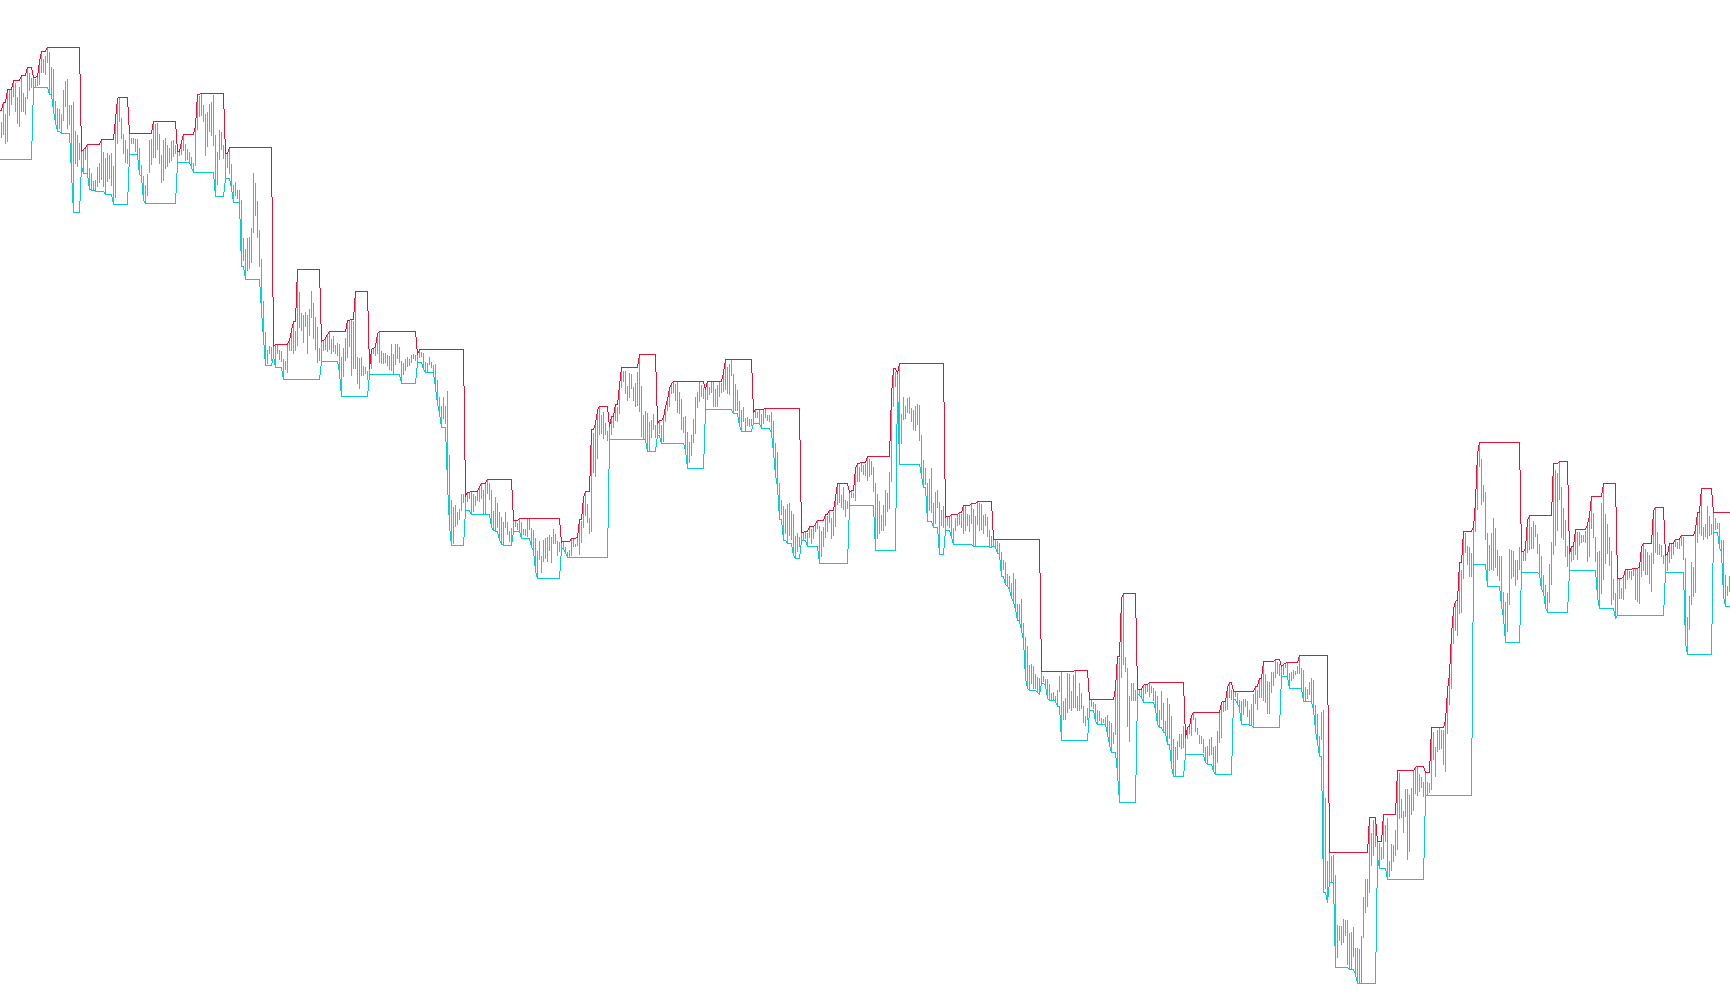
This tool is designed to provide a clear visual representation of the price extremes reached during each trading day. It automatically tracks and plots the highest and lowest price points reached between the start and end of each daily session, allowing traders to easily identify significant boundaries on their charts.
How the Logic Works
The script functions by scanning through historical price data to establish two distinct boundaries:
- Daily High Tracking: The tool continuously monitors the "High" price of every candle. It identifies the maximum price reached during the current day and projects it forward as a horizontal reference point.
- Daily Low Tracking: Similarly, the tool monitors the "Low" price of every candle to identify the minimum price reached during the current day, projecting this as a secondary boundary.
Key Behavioral Features
- Automatic Day Resets: The core logic includes a transition trigger. Every time the date changes (moving from one trading day to the next), the script automatically clears the previous day's data and resets its tracking. This ensures that the "High" and "Low" lines represent only the current day's activity rather than carrying over extreme values from past days.
- Real-Time Updates: As new price candles form during a live trading session, the script constantly compares the new prices against the existing extremes. If the price breaks above the current daily high or below the daily low, the corresponding line updates instantly to reflect the new boundary.
- Visual Indicators: The tool renders these boundaries as distinct colored lines on your chart. This provides an immediate visual cue of the "trading range" for the day, helping to identify how much room is left before a previous high or low is breached.
In essence, this tool removes the need for manual calculation by providing a live, dynamic map of the current day's price limits, helping you see at a glance where the market has reached its peak and its floor during the session.
Miscellaneous
11
Views
0
Downloads
0
Favorites
DailyHighLow
//+------------------------------------------------------------------+
//|                                               Daily High Low.mq4 |
//|                                           Copywrong 2005, RonT   |
//|                                 http://www.lightpatch.com/forex/ |
//+------------------------------------------------------------------+
#property copyright "RonT"
#property link      "http://www.lightpatch.com/forex/"

#property indicator_chart_window
#property indicator_buffers 2

double LOBuffer[];
double HIBuffer[];


//+------------------------------------------------------------------+
//| Custor indicator deinitialization function                       |
//+------------------------------------------------------------------+
int deinit()
  {
   return(0);
  }


//+------------------------------------------------------------------+
//| Custom indicator initialization function                         |
//+------------------------------------------------------------------+
int init()
  {
   SetIndexStyle(0,DRAW_LINE,0,1,DarkTurquoise);
   SetIndexBuffer(0,LOBuffer);

   SetIndexStyle(1,DRAW_LINE,0,1,Crimson);
   SetIndexBuffer(1,HIBuffer);

   return(0);
  }


//+------------------------------------------------------------------+
//| Custom indicator iteration function                              |
//+------------------------------------------------------------------+
int start()

  {
   int    counted_bars=IndicatorCounted();
   int    limit, i;

   double dayhigh=0;
   double daylow=999;

   if(counted_bars<0) return(-1);
   limit=(Bars-counted_bars)-1;

   for (i=limit; i>=0;i--)
     {
      if (dayhigh<High[i]) {dayhigh=High[i];}
      if (daylow>Low[i])   {daylow=Low[i];  }

      if (TimeDay(Time[i])!=TimeDay(Time[i+1]))
        {
         // reset limits when day changes
         dayhigh=High[i];
         daylow=Low[i];
        }

      LOBuffer[i]=daylow;
      HIBuffer[i]=dayhigh;

     }
   return(0);
  }
Comments