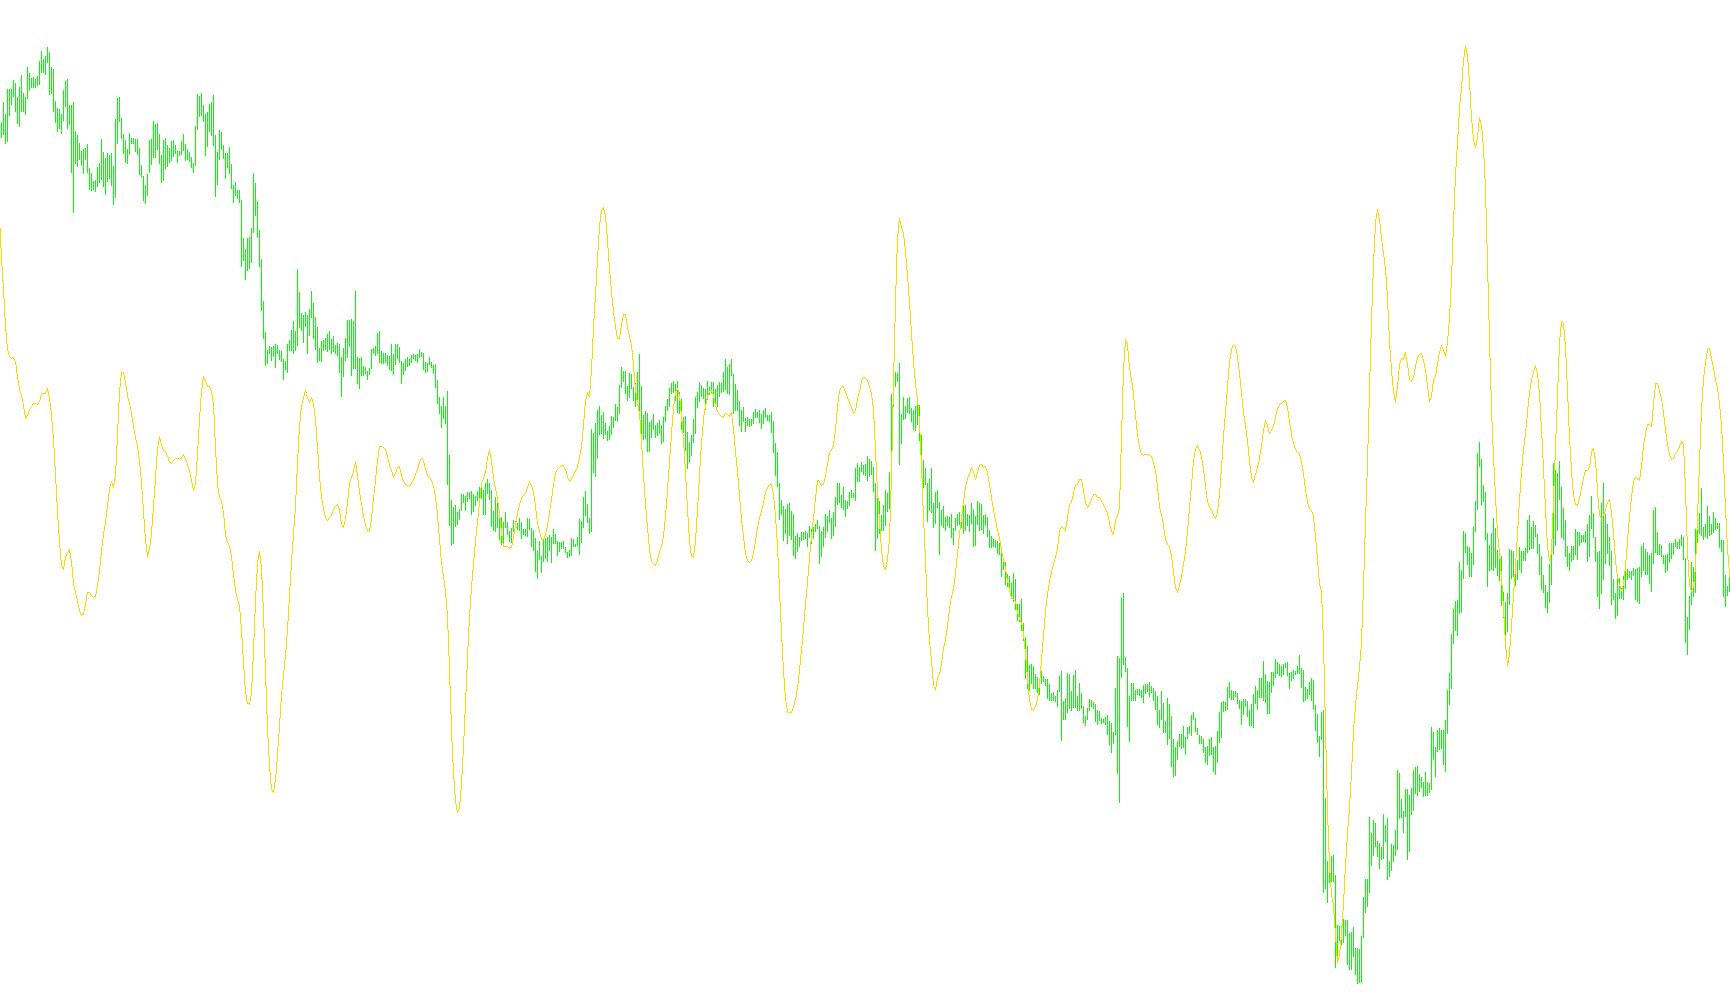
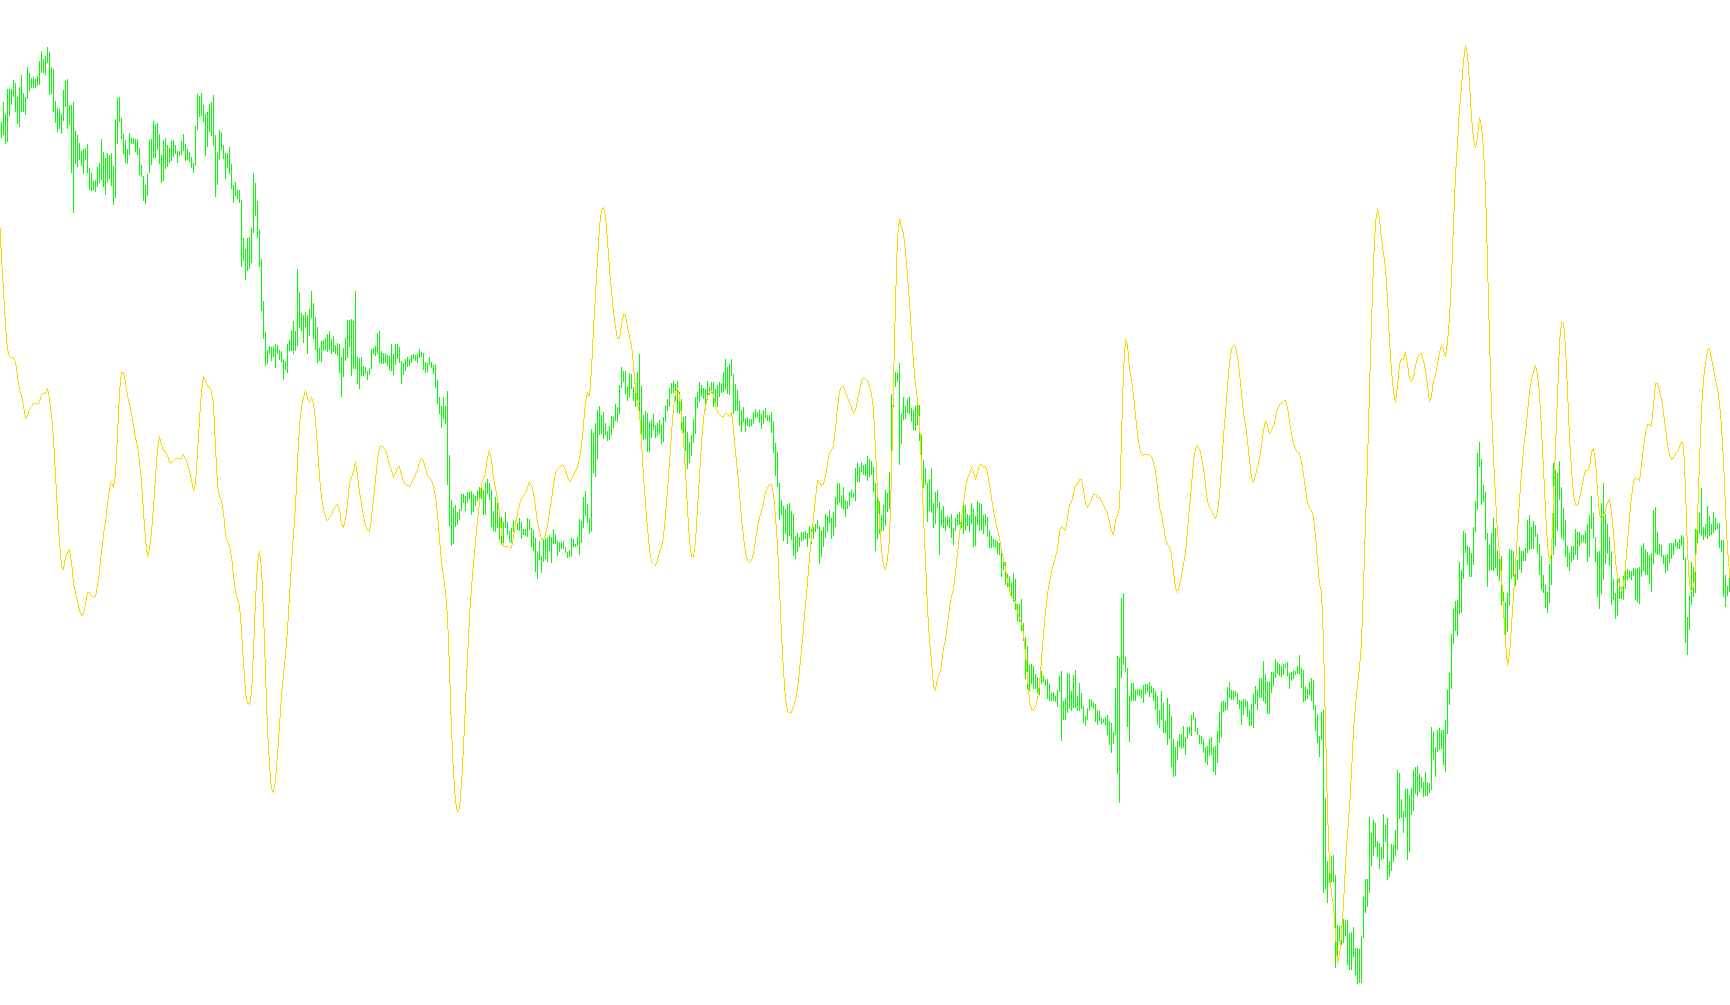
ColouredWoodie_v1
Indicator

ColouredWoodie_v1

iCCI

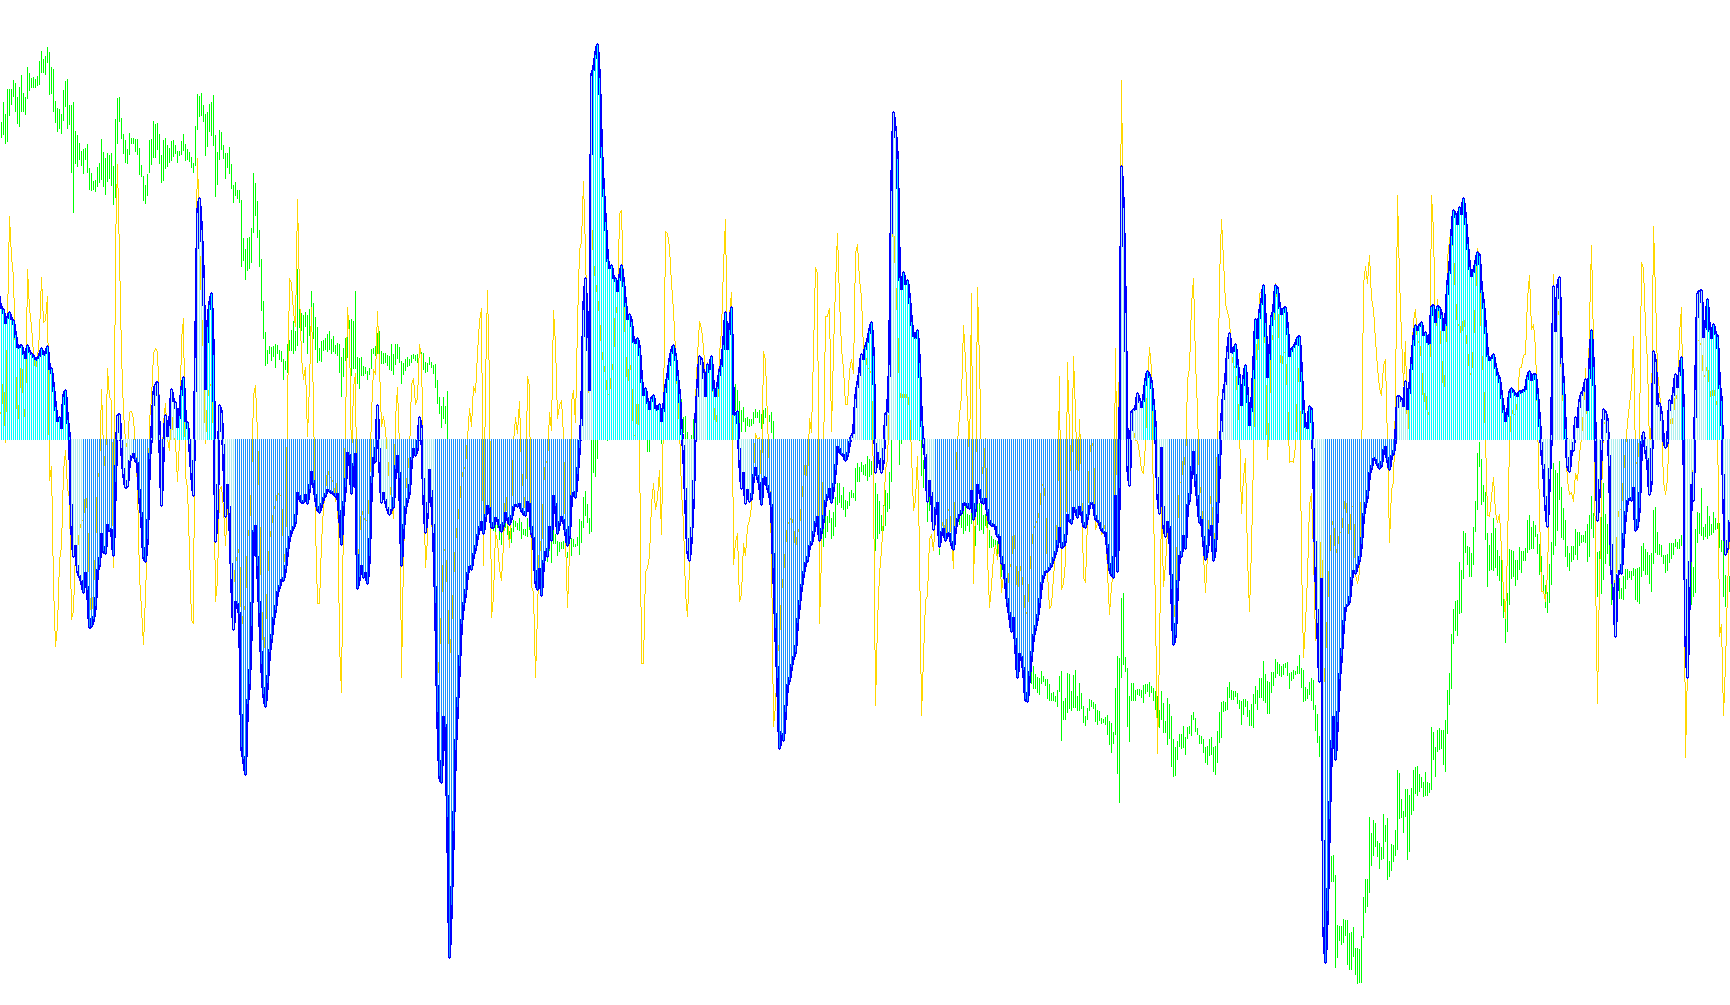
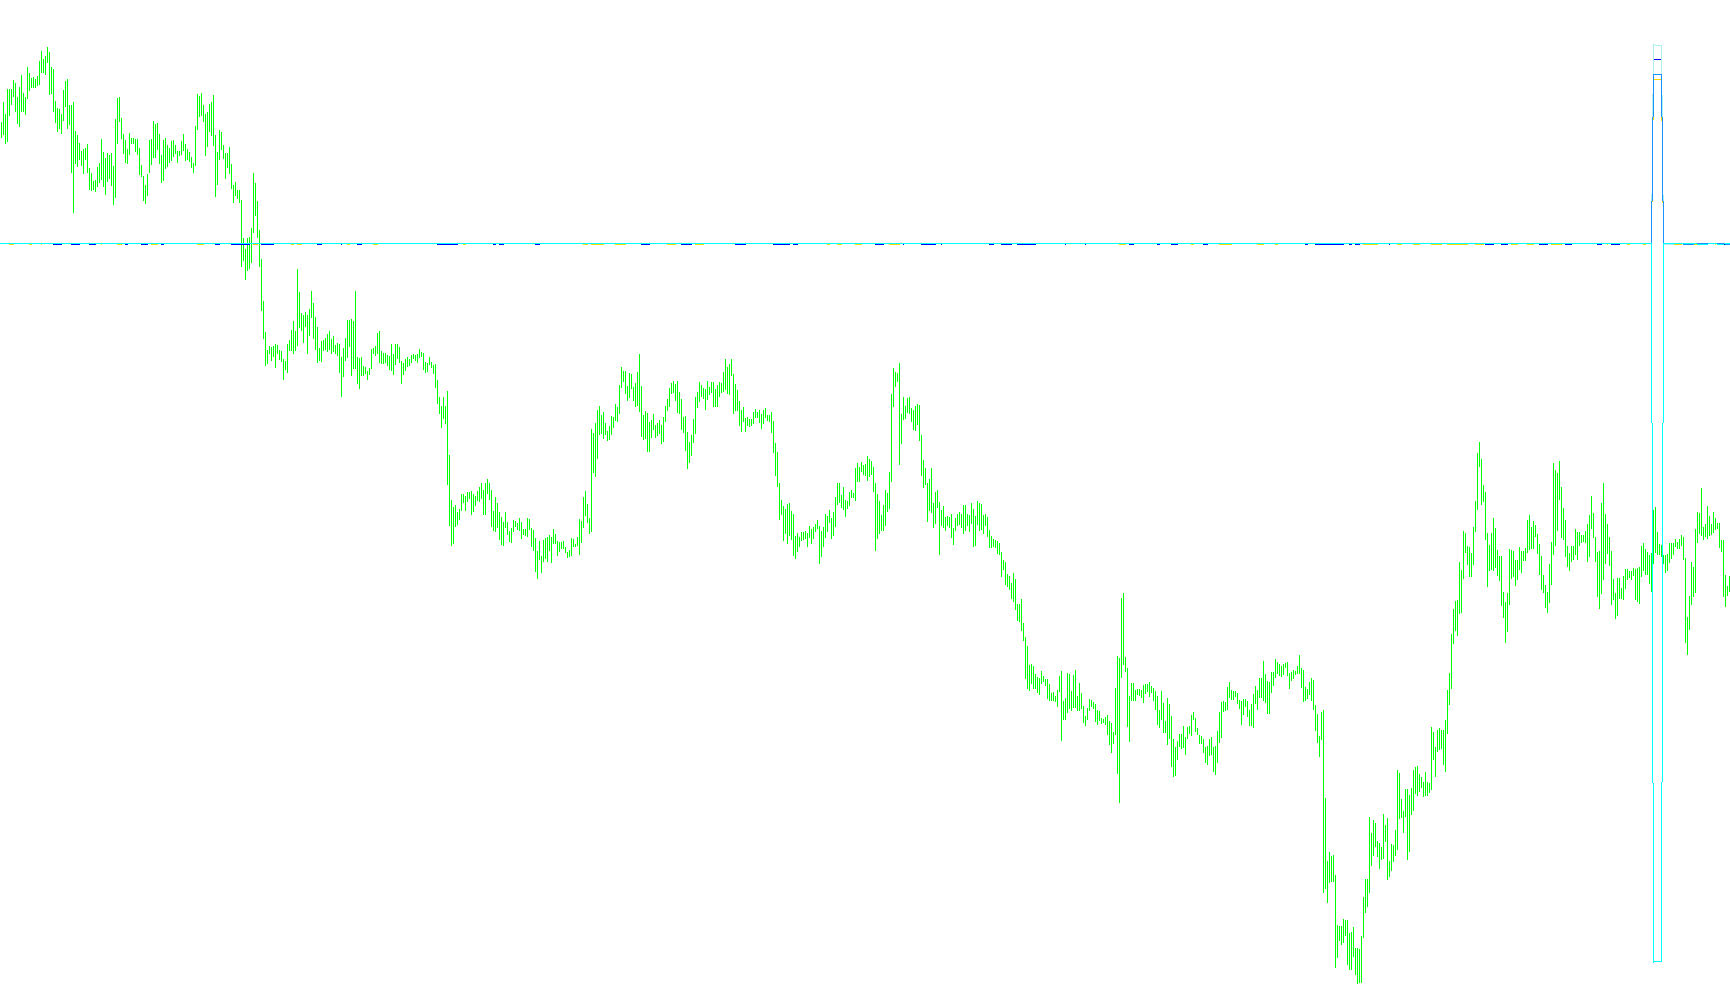
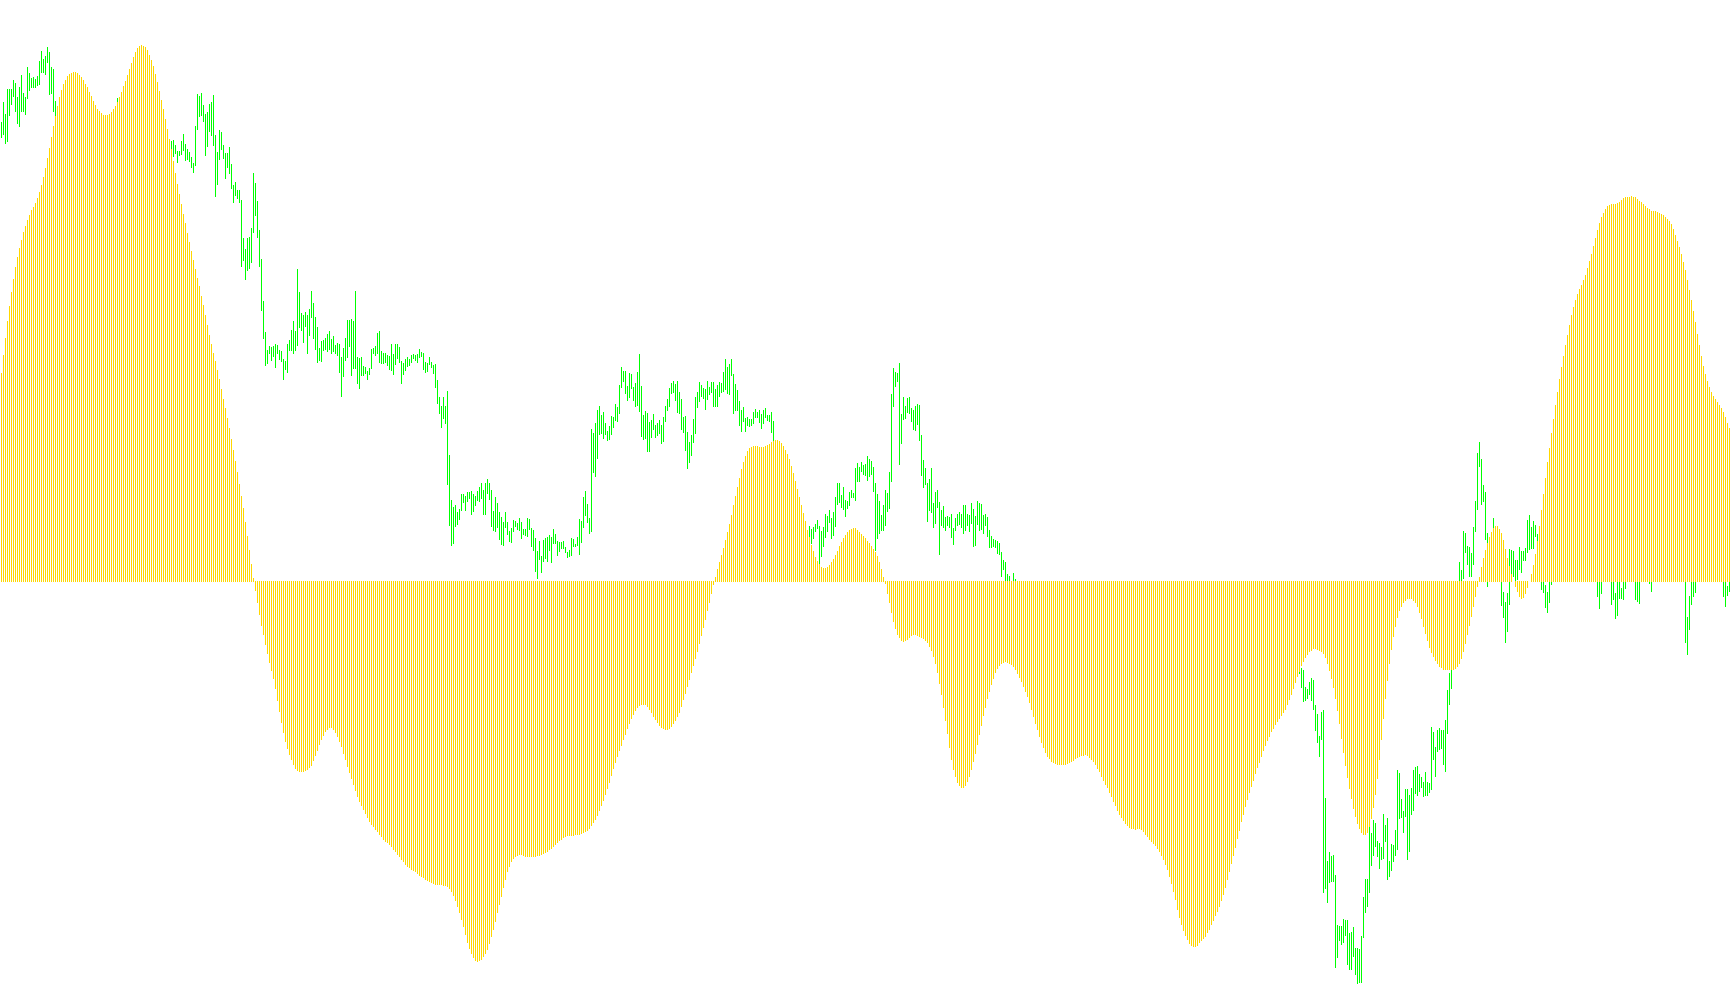
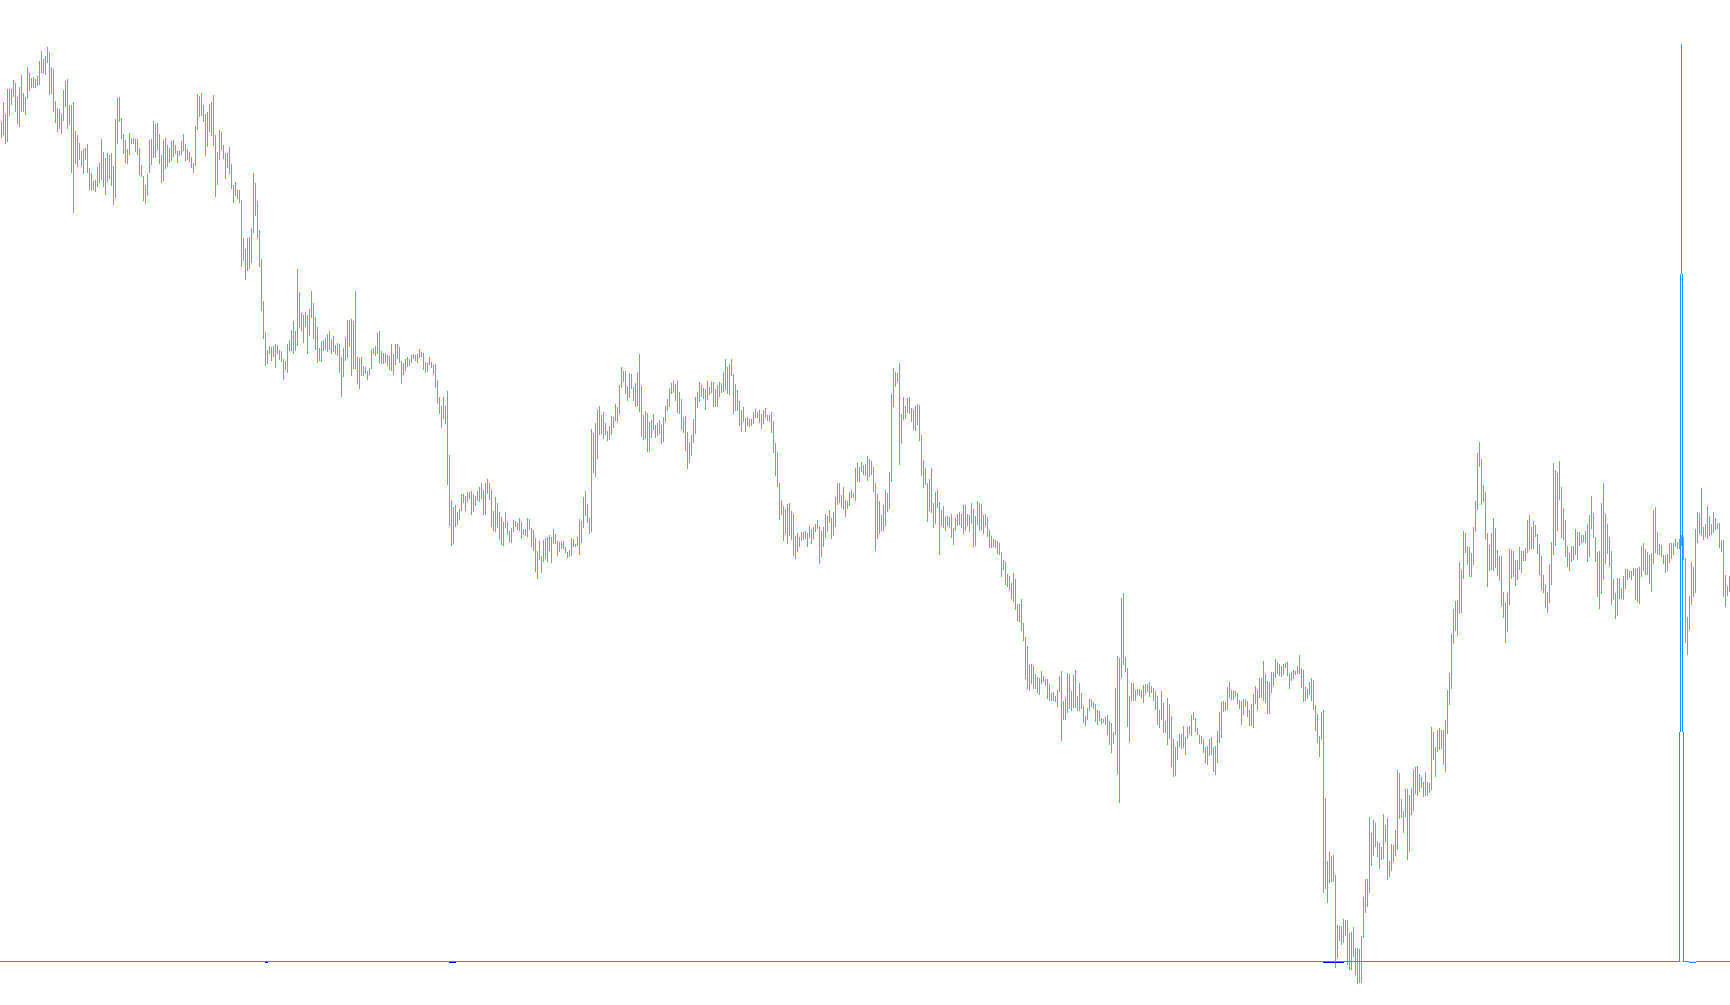
This indicator calculates dual-period Commodity Channel Indices to identify trend reversals and momentum shifts through multi-colored histogram transitions.

ColouredWoodie_v2
Indicator

ColouredWoodie_v2

iCCI

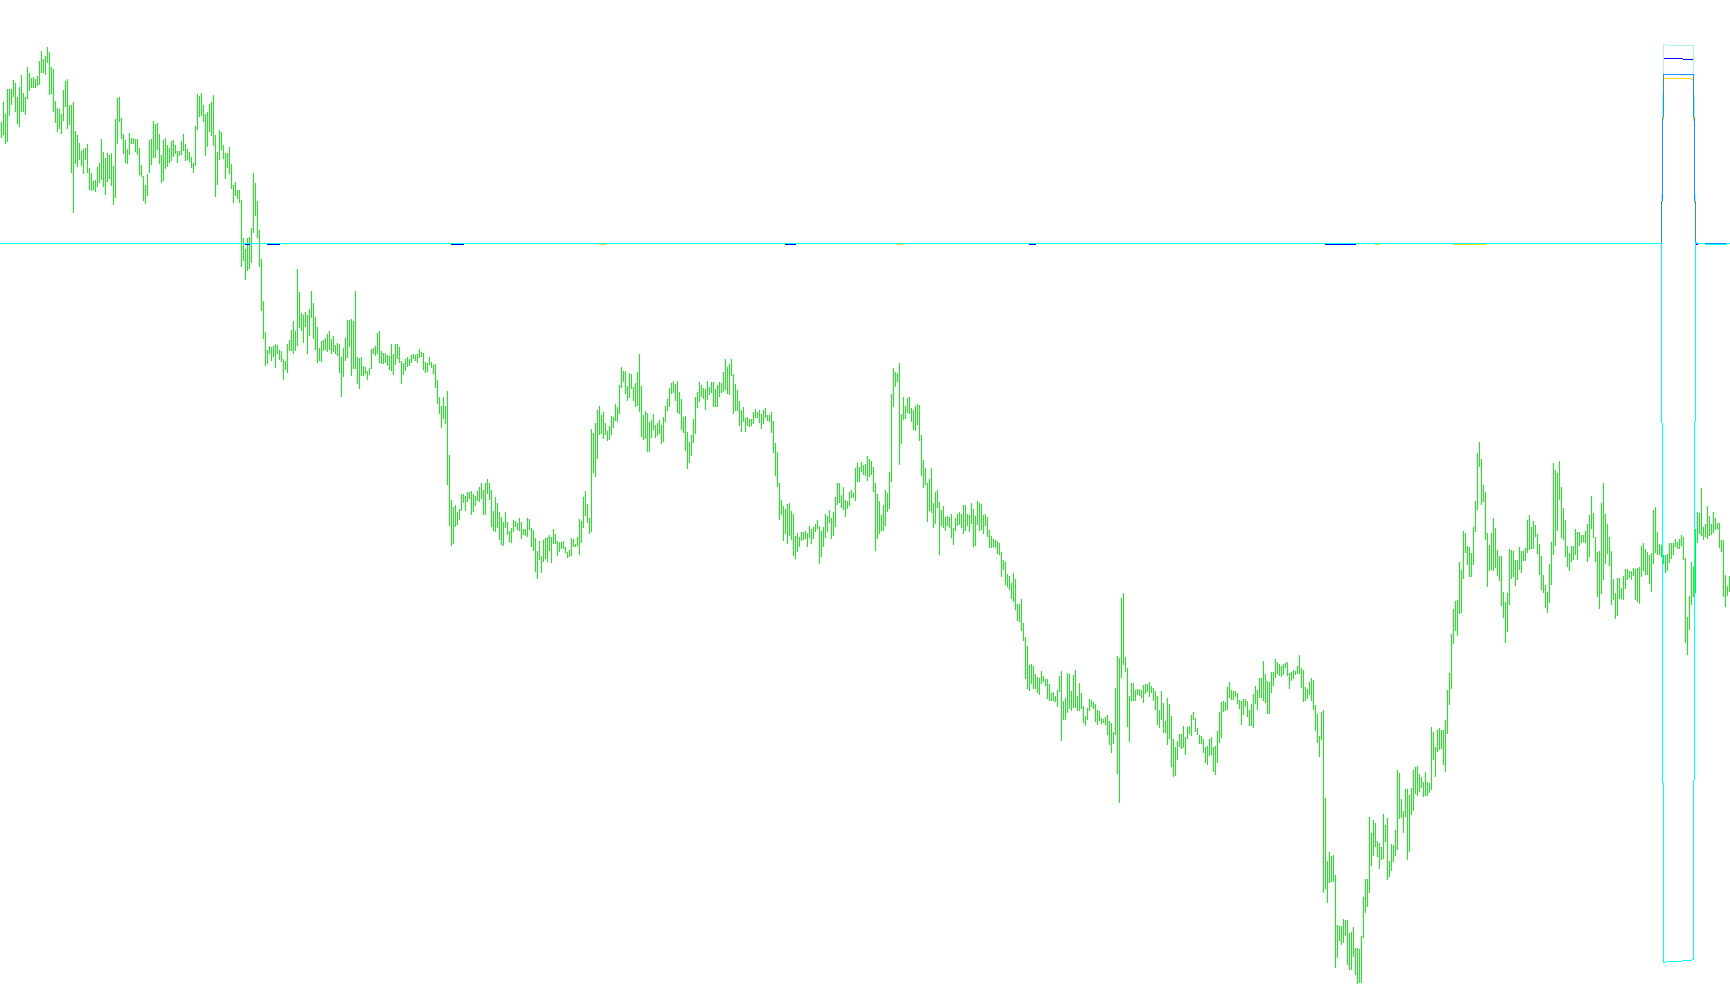
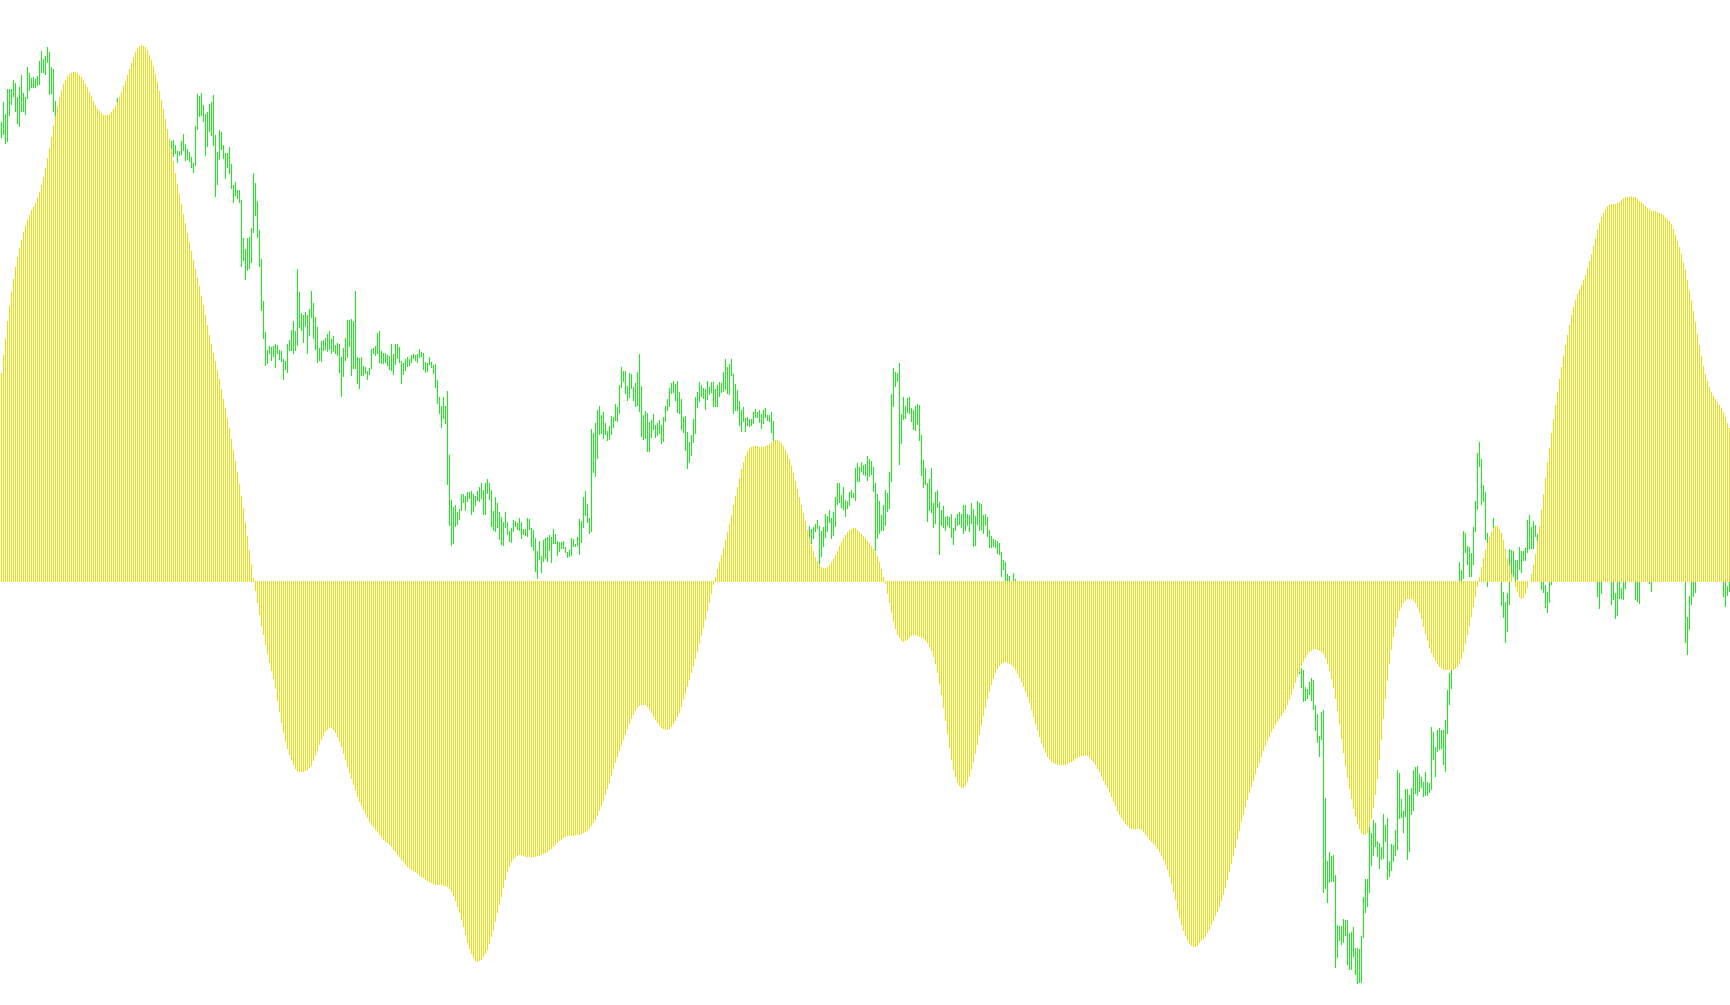
This indicator synthesizes fast and slow Commodity Channel Index values to identify trend momentum and detect neutral territory via a color-coded histogram.

Coloured_Days_on_Chart
Indicator

Coloured_Days_on_Chart

This indicator overlays a series of alternating shaded rectangular zones across the most recent historical days to enhance visual temporal separation on the chart.
Combined_MA_Signal
Indicator

Combined_MA_Signal

iMA

The logic calculates a weighted moving average of price differences to identify directional shifts and generates trend-following signals based on momentum acceleration.
comment2
Indicator

comment2

This library facilitates persistent, indexed text output by synchronizing a dynamic array of strings with a local data file to render multi-line chart comments.

Commentator
Indicator

Commentator

iACiCCIiDeMarkeriATR
Commentator_v1
Indicator

Commentator_v1

iACiCCIiDeMarkeriATR
Commentator_v2
Indicator

Commentator_v2

iACiCCIiDeMarkeriATR
Complex'
Indicator

Complex'

iMA

This indicator calculates the relative momentum of major fiat currencies by aggregating weighted moving average differentials across a cross-pair matrix.

Complex'_001
Indicator

Complex'_001

iMA

This indicator calculates the relative strength and directional momentum of major currencies by aggregating smoothed moving average differentials across multiple currency pairs simultaneously.

Complex
Indicator

Complex

iMA

The indicator calculates the weighted directional strength of major currencies by aggregating the differences between short and long Moving Averages across multiple currency pairs.

Complex_balance
Indicator

Complex_balance

iMA

This indicator calculates synthetic price deviations by aggregating weighted Moving Average differentials across multiple currency pairs to identify cross-market momentum shifts.

Complex_balance____Ext
Indicator

Complex_balance____Ext

iMA

This indicator identifies trend reversals by calculating the variance between two moving averages and projecting volatility adjustments onto a price-weighted central mean.

Complex_Common
Indicator

Complex_Common

iMA

This indicator calculates the weighted price velocity of five major currencies by computing the differential between dual moving averages across multiple currency pairs.

Complex_Common_Frames
Indicator

Complex_Common_Frames

iMA

This indicator quantifies the relative strength of major currencies by calculating the weighted sum of linear weighted moving average (LWMA) deviations across various currency pairs simultaneously.

Complex_Common_v1
Indicator

Complex_Common_v1

iMA

This indicator calculates and visualizes the aggregate deviation between dual moving averages across multiple currency pairs to identify relative strength and cross-market momentum.

Complex_Common_v2
Indicator

Complex_Common_v2

iMA

This indicator calculates the relative strength of major global currencies (USD, EUR, GBP, CHF, JPY) by aggregating weighted Moving Average deviations across a comprehensive cross-pair matrix.

Complex_Common__(bez linii)
Indicator

Complex_Common__(bez linii)

iMA

This indicator calculates the weighted price action divergence between major global currencies by aggregating moving average spreads across multiple currency pairs simultaneously.

Complex_pairs T3
Indicator

Complex_pairs T3

This indicator applies a triple-smoothing T3 filter algorithm to an underlying complex pair signal to isolate refined trend directions and momentum fluctuations.

Complex_pairs
Indicator

Complex_pairs

iMA

This indicator synthesizes individual currency strengths into a unified value by calculating the weighted differential between moving averages across multiple major and minor forex pairs.

Complex_pairs1
Indicator

Complex_pairs1

iMA

This indicator calculates the arithmetic mean of smoothed price points derived from the spread between dual moving averages across dynamic timeframe-specific periods.

Complex_pairs1_v1
Indicator

Complex_pairs1_v1

iMA

The indicator calculates the numerical variance between two distinct moving average periods tailored specifically to the current chart's timeframe to reveal price momentum shifts.

Complex_pairs_v1
Indicator

Complex_pairs_v1

iMA

This indicator calculates a synthetic value for specific currency pairs by aggregating the weighted moving average differentials of underlying component currencies.

continuation
Indicator

continuation

This indicator calculates the differential between cumulative positive and negative price movements over a sliding window to identify trend exhaustion and momentum shifts.

continuation_v1
Indicator

continuation_v1

The indicator calculates the differential between cumulative price growth and historical momentum shifts to highlight trend persistence versus exhaustive exhaustion.

Cool2
Indicator

Cool2

iMA

The algorithm calculates the variance between a weighted median price and an smoothed moving average to project a logarithmic deviation from the baseline close.

Cool2_v1
Indicator

Cool2_v1

iMA

This indicator calculates price divergence by applying a logarithmic ratio between weighted median price components and smoothed moving averages.

Coppock
Indicator

Coppock

iMAiMAOnArray

This indicator identifies momentum shifts by calculating the sum of two distinct Rate of Change values derived from varying moving average distances and applying a final smoothing pass.

Coppock_v1
Indicator

Coppock_v1

iMAiMAOnArray

This indicator calculates the sum of two independent Rate of Change values derived from different moving average periods and applies a final smoothing layer to identify long-term momentum shifts.

Coppock_v2
Indicator

Coppock_v2

iMAiMAOnArray

This indicator quantifies market momentum by calculating the sum of two distinct Rate of Change values derived from long-term and short-term moving averages, then smoothing the result through a final moving average filter.

Copy of 27-23 Rule
Indicator

Copy of 27-23 Rule

The algorithm identifies specific daily reference levels based on a fixed time hour and triggers alerts when price action breaches the predetermined upper and lower buffer zones.

Indicator

Copy of PriceChannel_FiboLevels100_MTF

corelation
Indicator

corelation

iMA

This tool maps the price action of a secondary currency pair onto the primary chart by calculating proportional scale factors and positional offsets to visualize real-time correlations.

Corr
Indicator

Corr

This indicator quantifies the statistical covariance between current price body fluctuations and historical price movements over a rolling period to identify cyclical trends.

Correlation
Indicator

Correlation

iMA

This indicator quantifies the linear relationship between two distinct financial symbols by calculating the normalized product of their respective price deviations from a Simple Moving Average.

Indicator

Correlation1

Correlation2in1
Indicator

Correlation2in1

This indicator calculates and visualizes the Pearson correlation coefficient for two distinct pairs of currency assets simultaneously to identify synchronized market behaviors.

CorrelationBurst
Indicator

CorrelationBurst

iMA

This indicator calculates the relative price velocity of four major currency pairs using Linear Weighted Moving Averages to visualize synchronized momentum shifts.

Correlation_Index
Indicator

Correlation_Index

The indicator calculates a dynamic Pearson correlation coefficient between the EURUSD and USDCHF currency pairs to quantify their statistical linear dependency over a rolling period.

Correlation_njel
Indicator

Correlation_njel

iMA

This indicator calculates the Pearson correlation coefficient between a primary base currency and multiple assets across ten distinct lookback periods to visualize price synchronization patterns.

correlation_Pearson
Indicator

correlation_Pearson

Quantifies the linear dependency between two independent financial instruments by calculating the normalized covariance of their opening prices over a rolling window.

correlation_v1
Indicator

correlation_v1

iMA

This indicator quantifies the Pearson correlation coefficient between two assets by measuring the statistical relationship of their price deviations from a Simple Moving Average.

Correlation_v1_v1
Indicator

Correlation_v1_v1

iMA

This indicator quantifies the statistical relationship between two financial instruments by measuring the coefficient of covariance relative to their respective deviations from simple moving averages.

Indicator

correlation_v2

iMA
Correlation_v3.1_kroufr
Indicator

Correlation_v3.1_kroufr

iMA

This indicator quantifies the statistical linear relationship between a base currency and the current symbol across distinct short-term and long-term temporal windows.

Correlation_v3
Indicator

Correlation_v3

This indicator calculates the Pearson correlation coefficient between two different financial symbols by computing the weighted covariance of specific price actions over a user-defined historical lookback period.

Correl[i]_1
Indicator

Correl[i]_1

This indicator calculates a synthetic global currency strength by computing the geometric mean of major pairs to derive a consolidated market price for a specified target currency.

Correl[i]_1_v1
Indicator

Correl[i]_1_v1

Calculates a composite currency strength value by deriving a weighted geometric mean of multiple major forex pairs to isolate the relative movement of a specific base currency.

Corridor
Indicator

Corridor

This indicator plots dynamic upper and lower bands, calculated using the highest high and lowest low over a defined period, effectively creating a trading channel.

CosMod
Indicator

CosMod

iMA

This indicator maps the periodic trigonometric variance of price action relative to a simple moving average baseline.