DEMA
Indicator

DEMA

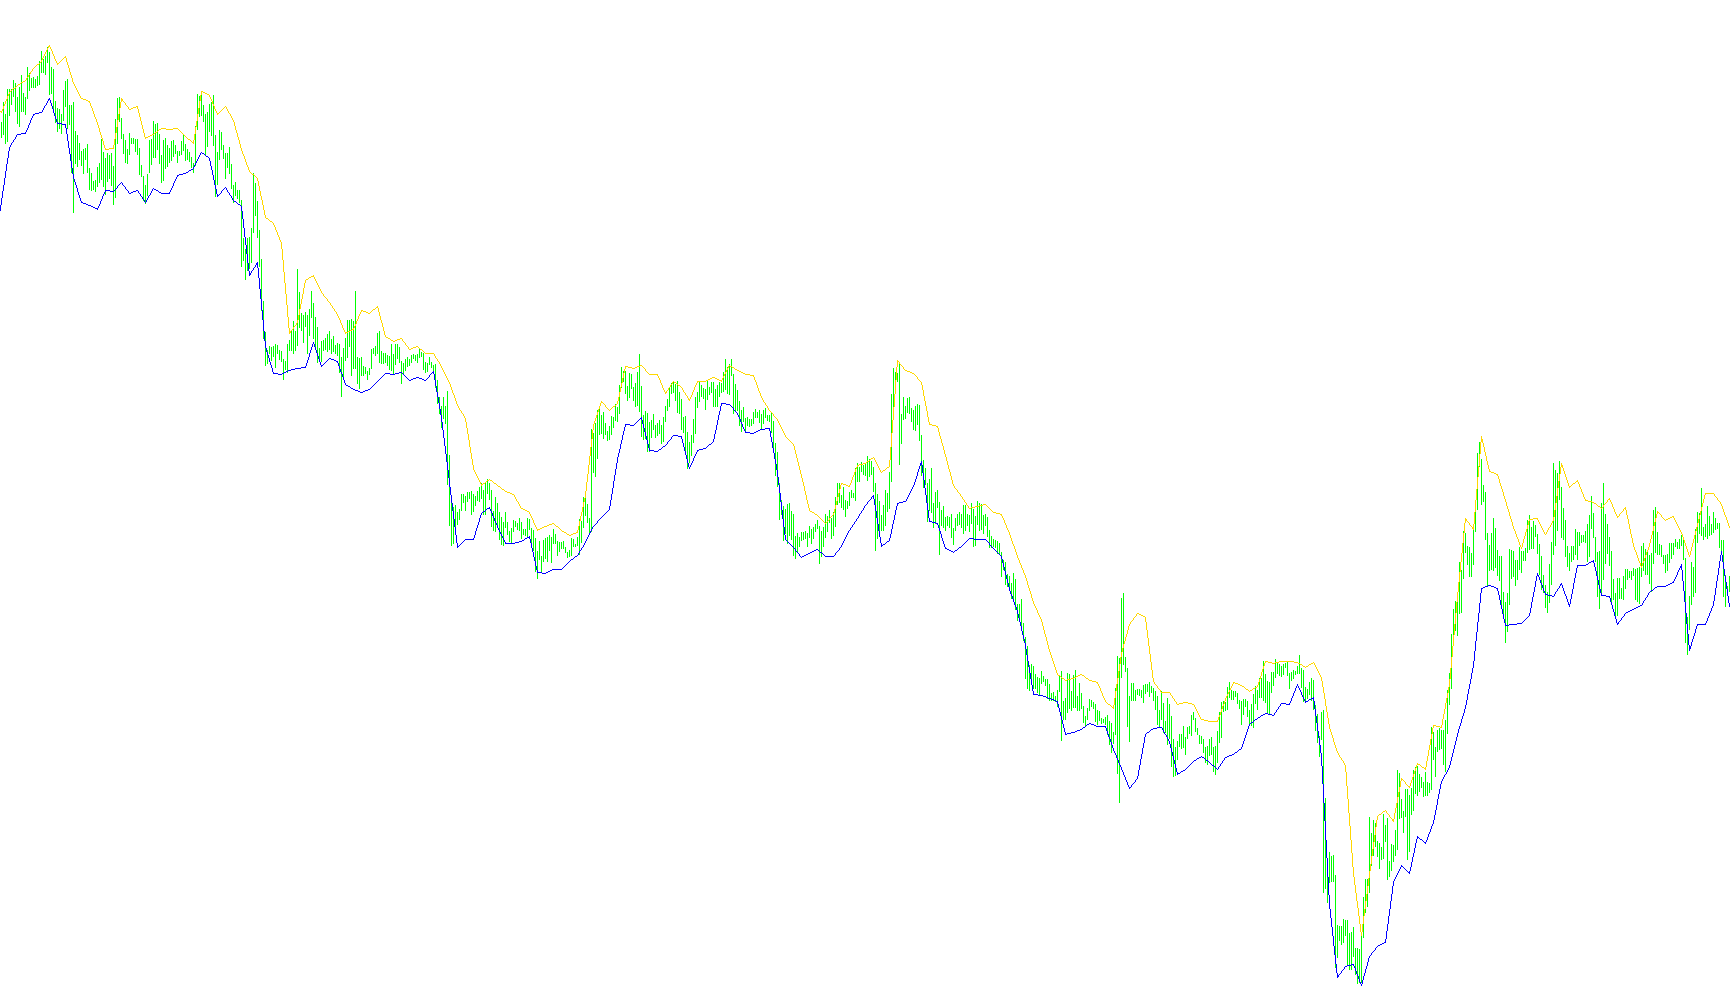
This indicator calculates a smoothed price trend by subtracting the EMA of an EMA from twice the primary EMA to reduce lag while maintaining sensitivity.

DeMark lines
Indicator

DeMark lines

This indicator identifies DeMark high/low pivot points to construct trendlines and automatically detects structural breakouts with specific price target levels and visual alerts.

DeMark lines_001
Indicator

DeMark lines_001

This indicator identifies structural price pivots using DeMark theory to project dynamic trendlines, breakout levels, and Fibonacci-based target zones.

DeMark lines_v1
Indicator

DeMark lines_v1

This indicator identifies key pivot points using DeMark theory to construct trendlines, breakout levels, and dynamic target zones for precise market structure analysis.

DeMark Projected High & Low Script
Indicator

DeMark Projected High & Low Script

This script dynamically calculates and plots projected daily high and low price targets based on DeMark's weighted pivot formula derived from the previous day's open, high, low, and close prices.

DeMark Trendline Trader
Indicator

DeMark Trendline Trader

Identifies price reversal points and trend lines based on Thomas DeMark theory to project potential take-profit targets and alert on structural breakouts.

DeMark Trendline Trader_001
Indicator

DeMark Trendline Trader_001

This indicator identifies TD-style price pivots to plot multi-step trendlines and calculate automated profit projection targets based on structural breaks.

DeMark Trendline Trader_v1
Indicator

DeMark Trendline Trader_v1

Identifies Trend Dynamics using multi-point highs and lows to project geometric break-out targets and trendline violations.

DeMark Trendline Trader_v2
Indicator

DeMark Trendline Trader_v2

This indicator identifies TD sequential high and low points to construct trendlines, calculate price projection targets, and trigger alerts upon structural breakouts.

Demark
Indicator

Demark

This indicator identifies DeMark pivot points to project dynamic trendlines, breakout levels, and Fibonacci-based target zones while monitoring structural breaches.

Demark2
Indicator

Demark2

This indicator dynamically identifies Demark pivot points to project trendlines, violation levels, and Fibonacci-based take-profit zones with automated hitch detection.

DeMarker Pivots
Indicator

DeMarker Pivots

This indicator projects dynamic horizontal price levels by calculating daily mean pivots and subsequent symmetrical support/resistance boundaries based on the previous session's extremes.

DeMarker Pivots_v1
Indicator

DeMarker Pivots_v1

This indicator projects dynamic support and resistance levels by calculating primary pivots and secondary boundaries based on the previous day's high, low, and closing prices.

DeMarker Pivots_v2
Indicator

DeMarker Pivots_v2

This indicator calculates daily price equilibrium and projected polarity boundaries by synthesizing previous session extremes and closing coordinates.

DeMarker
Indicator

DeMarker

iMAOnArray

This indicator quantifies price action momentum by calculating the normalized ratio between cumulative upward and downward price fluctuations over a specific period.

DeMarkerB_MTF
Indicator

DeMarkerB_MTF

iDeMarker

This indicator maps the DeMarker momentum value from a higher time frame onto the current chart to identify extended price movements and potential reversals across different temporal scales.

DeMarker_MTF
Indicator

DeMarker_MTF

This indicator synchronizes and maps the DeMarker momentum values from a secondary higher timeframe onto the current chart to identify long-term trend strength.

DeMarker_MTF_001
Indicator

DeMarker_MTF_001

iDeMarker

This indicator synchronizes the DeMarker momentum value across different timeframes to visualize long-term price pressure relative to the current chart's volatility.

DeMarker_Pivots
Indicator

DeMarker_Pivots

This indicator calculates daily equilibrium levels and multi-tier support/resistance boundaries based on the previous day's high, low, and closing price data.

DemarkNextDay
Indicator

DemarkNextDay

This indicator projects dynamic price levels by calculating a weighted mean of the previous day's high, low, open, and close prices to identify potential reversal zones.

deMark_TrendLines_&_Alert
Indicator

deMark_TrendLines_&_Alert

This indicator identifies significant local price extrema to dynamically plot trendlines and trigger alerts upon structural breakout of the established trajectory.

DeMark_Trendline_Trader
Indicator

DeMark_Trendline_Trader

This indicator identifies and plots Trend Danger (TD) points to generate dynamic trendlines, horizontal break levels, and automated price targets based on geometric price projection.

Demark_trend_alert_and_mail
Indicator

Demark_trend_alert_and_mail

This indicator identifies DeMark pivots to construct trendlines, detect price breakouts with specific qualifiers, and project potential take-profit targets.

Demark_trend_alert_and_mail_v1
Indicator

Demark_trend_alert_and_mail_v1

This advisor identifies structural trend shifts by calculating DeMark pivot levels and projecting automated trendlines, breakout qualifiers, and Fibonacci-based price targets.

Demark_trend_new
Indicator

Demark_trend_new

This indicator identifies DeMark high and low pivots to project trendlines, breakout levels, and dynamic trading channels based on Fibonacci-inspired price action.

DEMA_RLH
Indicator

DEMA_RLH

iMAiMAOnArray

This indicator calculates a high-responsiveness trend line by subtracting the smoothed mean of an EMA from twice its original value to reduce lag.

DEMA_RLH_v1
Indicator

DEMA_RLH_v1

iMAiMAOnArray

This indicator calculates the Double Exponential Moving Average by subtracting a secondary smoothed EMA from twice the primary EMA to reduce lag while preserving price sensitivity.

DEMA_RLH_v2
Indicator

DEMA_RLH_v2

iMAiMAOnArray

This indicator calculates the Double Exponential Moving Average by subtracting the nested EMA from twice the primary EMA to reduce lag and increase responsiveness.

DEMA_v1
Indicator

DEMA_v1

This indicator calculates the Double Exponential Moving Average by subtracting the smoothed average of the EMA from twice the primary EMA to reduce lag in trend detection.

Detrended Price Oscillator
Indicator

Detrended Price Oscillator

iMA

This indicator quantifies momentum by calculating the raw distance between current closing prices and a shifted simple moving average.

Detrended_Price_Oscillator
Indicator

Detrended_Price_Oscillator

iMAiStdDevOnArray

Calculates the variance between current price action and moving average benchmarks while establishing volatility-based extreme zones to identify momentum exhaustion.

Indicator

DeviantPush

dex_2Trales_V1
Indicator

dex_2Trales_V1

iATRiStdDev

This indicator calculates price boundaries by blending historical daily range averages with real-time expansion of volatility using Standard Deviation or ATR metrics.

dex_HeLMA_v2.0
Indicator

dex_HeLMA_v2.0

iMA

This indicator calculates a multi-period volatility average to project price channels and filters directional momentum shifts using an EMA-weighted signal.

dex_MACDPVT
Indicator

dex_MACDPVT

iMAiMAOnArray

This indicator quantifies market momentum by calculating the cumulative weighted change in price relative to volume, applying a dual exponential moving average crossover strategy.

dex_RSIndex
Indicator

dex_RSIndex

iMAOnArrayiRSIOnArray

This indicator calculates and visualizes the smoothed RSI values of synthetic currency indices derived from a proprietary weighted cross-calculation of USD, GBP, EUR, CHF, and JPY price actions.

dex_SCALP
Indicator

dex_SCALP

iStdDev

The indicator calculates an exponential moving standard deviation to project a dynamic volatility band based on the statistical variance of price deviations.

dex_SolarWind
Indicator

dex_SolarWind

iMAOnArray

The algorithm calculates a normalized price position relative to the highest highs and lowest lows of a set period, applying an exponential smoothing weight and a logarithmic transformation to isolate momentum shifts.

dex_SRFractal
Indicator

dex_SRFractal

iFractals
DFC High
Indicator

DFC High

This indicator calculates dynamic upper and lower price boundaries by projecting Fibonacci-based ratios from high and low extremes within specific delimited time segments.

DFC Next ج߻Ña¿¼Ñ¡G
Indicator

DFC Next ج߻Ña¿¼Ñ¡G

This indicator identifies significant price boundaries by calculating the midpoint and Fibonacci-based retracement levels across specific time-delimited structural cycles.

DFC Next
Indicator

DFC Next

This indicator calculates and projects dynamic Fibonacci-based upper and lower boundary channels by identifying historical volatility extremes across specific period delimiters.

DFC Next_v1
Indicator

DFC Next_v1

This indicator projects dynamic price channels based on a user-defined Fibonacci ratio applied to the high-low range of specific temporal delimiters.

DFC Next_v2
Indicator

DFC Next_v2

This indicator projects dynamic price boundaries by calculating Fibonacci-based mean deviations from historical high-low extremes and interpolating them across timeframes.

DFC Next_v3
Indicator

DFC Next_v3

This indicator calculates and projects dynamic price boundaries by identifying multi-period high/low extremes and applying a weighted Fibonacci ratio to define upper and lower volatility channels.

DFC_Next
Indicator

DFC_Next

This indicator projects dual boundary lines based on a specific Fibonacci ratio relative to high-low extremes across predefined structural periods.

Diapazon
Indicator

Diapazon

This indicator projects real-time price boundaries by identifying the highest highs and lowest lows over a rolling period to calculate a central median equilibrium.

Diapazon_v1
Indicator

Diapazon_v1

The indicator identifies rolling price extremes by calculating the highest high, lowest low, and arithmetic mean over a user-defined bar period.

DIBSv1.0
Indicator

DIBSv1.0

This indicator identifies internal price expansion boundaries (Inside Bars) while simultaneously mapping daily opening price levels and providing real-time countdowns for candle expiration.

DIBS_TriggerLines1.2
Indicator

DIBS_TriggerLines1.2

Identifies intraday bullish and bearish trigger points by detecting inside bars relative to the daily open price within specific trading windows.