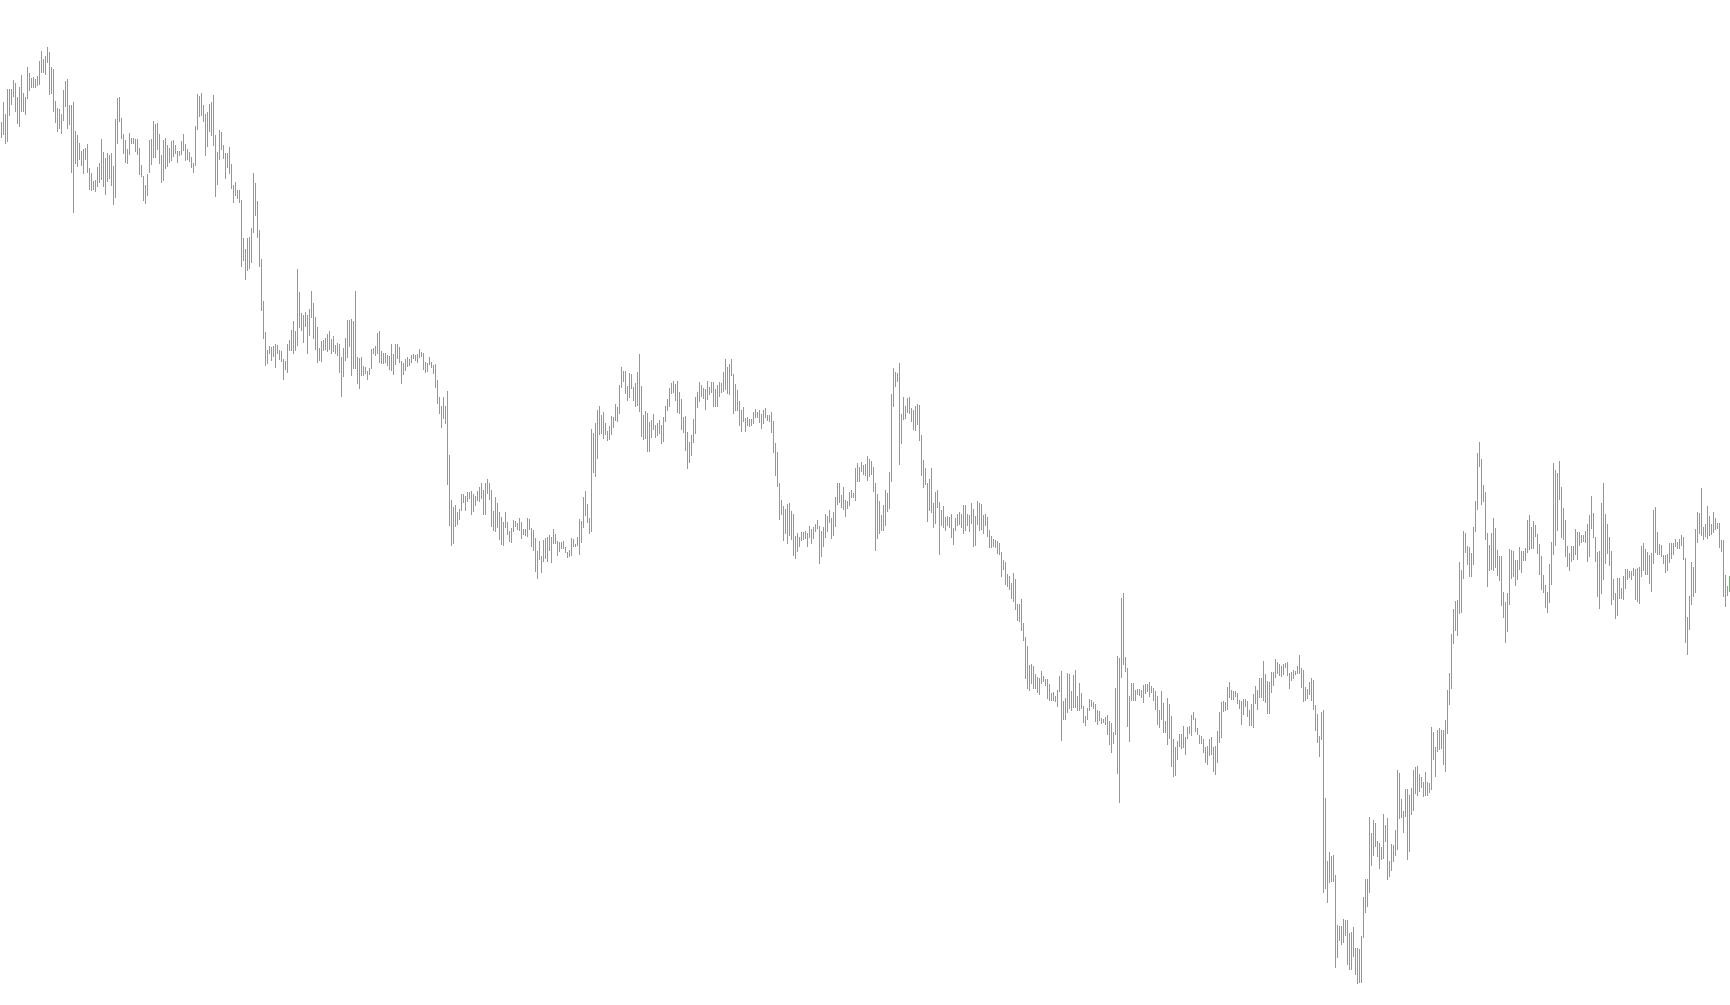
The Cyber Cycle indicator is a specialized technical analysis tool designed to identify and visualize cyclical patterns within financial markets. Based on the methodologies outlined in Cybernetics Analysis for Stock and Futures by John F. Ehlers, this script filters out general market "noise" to help traders recognize underlying rhythmic trends.
Core Logic Overview
The indicator operates by analyzing price action through three distinct mathematical layers:
1. Price Averaging To begin the analysis, the tool focuses on the midpoint of each price candle (the average of the high and low prices). By using the midpoint rather than just the closing price, the logic captures a more balanced view of the market's reach during any given period.
2. Signal Smoothing Raw market data is often jagged and erratic. The script applies a smoothing calculation that weighs recent prices differently to create a cleaner trend line. This ensures that minor, insignificant price fluctuations do not trigger false signals, allowing the user to see the "true" momentum of the asset.
3. Cycle Detection and Calculation This is the core of the Cyber Cycle logic. The script processes the smoothed data through a specialized recursive formula. Unlike standard moving averages—which simply look back at past prices—this calculation attempts to identify the frequency and phase of market cycles.
- It compares current smoothed values against previous points to determine if the market is currently in an ascending or descending phase of a cycle.
- The "Alpha" setting allows for a degree of sensitivity, determining how quickly the indicator reacts to changes in the cycle.
Visual Output and Interpretation
The script generates two primary components on the chart:
- The Cycle Line: This represents the calculated trend of the market's rhythmic movement. It helps traders visualize where the price sits within its current cycle.
- The Trigger Line: This is a lagging line derived from the Cycle data. Its primary purpose is to provide specific "trigger" points. When the main Cycle line crosses or interacts with this Trigger line, it can signal potential shifts in momentum or entry/exit opportunities.
By combining these elements, the indicator provides a visual representation of market periodicity, making it easier for users to anticipate turning points rather than simply reacting to historical price movements.
//+------------------------------------------------------------------+
//|                                                   CyberCycle.mq4 |
//|                                                                  |
//| Cyber Cycle                                                      |
//|                                                                  |
//| Algorithm taken from book                                        |
//|     "Cybernetics Analysis for Stock and Futures"                 |
//| by John F. Ehlers                                                |
//|                                                                  |
//|                                              contact@mqlsoft.com |
//|                                          http://www.mqlsoft.com/ |
//+------------------------------------------------------------------+
#property copyright "Coded by Witold Wozniak"
#property link      "www.mqlsoft.com"

#property indicator_separate_window
#property indicator_buffers 2
#property indicator_color1 Red
#property indicator_color2 Blue

#property indicator_level1 0

double Cycle[];
double Trigger[];
double Smooth[];

extern double Alpha = 0.07;
int buffers = 0;
int drawBegin = 0;

int init() {
    drawBegin = 8;
    initBuffer(Cycle, "Cycle", DRAW_LINE);
    initBuffer(Trigger, "Trigger", DRAW_LINE);
    initBuffer(Smooth);
    IndicatorBuffers(buffers);
    IndicatorShortName("Cyber Cycle [" + DoubleToStr(Alpha, 2) + "]");
    return (0);
}

int start() {
    if (Bars <= drawBegin) return (0);
    int countedBars = IndicatorCounted();
    if (countedBars < 0) return (-1);
    if (countedBars > 0) countedBars--;
    int s, limit = Bars - countedBars - 1;
    for (s = limit; s >= 0; s--) {
        Smooth[s] = (P(s) + 2.0 * P(s + 1) + 2.0 * P(s + 2) + P(s + 3)) / 6.0;
        Cycle[s] = (1.0 - 0.5 * Alpha) * (1.0 - 0.5 * Alpha) * (Smooth[s] - 2.0 * Smooth[s + 1]
            + Smooth[s + 2]) + 2.0 * (1.0 - Alpha) * Cycle[s + 1] - (1.0 - Alpha) * (1.0 - Alpha) * Cycle[s + 2];
        if (s > Bars - 8) {
            Cycle[s] = (P(s) - 2.0 * P(s + 1) + P(s + 2)) / 4.0;
        }
        Trigger[s] = Cycle[s + 1];
    }
    return (0);
}

double P(int index) {
    return ((High[index] + Low[index]) / 2.0);
}

void initBuffer(double array[], string label = "", int type = DRAW_NONE, int arrow = 0, int style = EMPTY, int width = EMPTY, color clr = CLR_NONE) {
    SetIndexBuffer(buffers, array);
    SetIndexLabel(buffers, label);
    SetIndexEmptyValue(buffers, EMPTY_VALUE);
    SetIndexDrawBegin(buffers, drawBegin);
    SetIndexShift(buffers, 0);
    SetIndexStyle(buffers, type, style, width);
    SetIndexArrow(buffers, arrow);
    buffers++;
}
Comments