dailybreakm5
Download script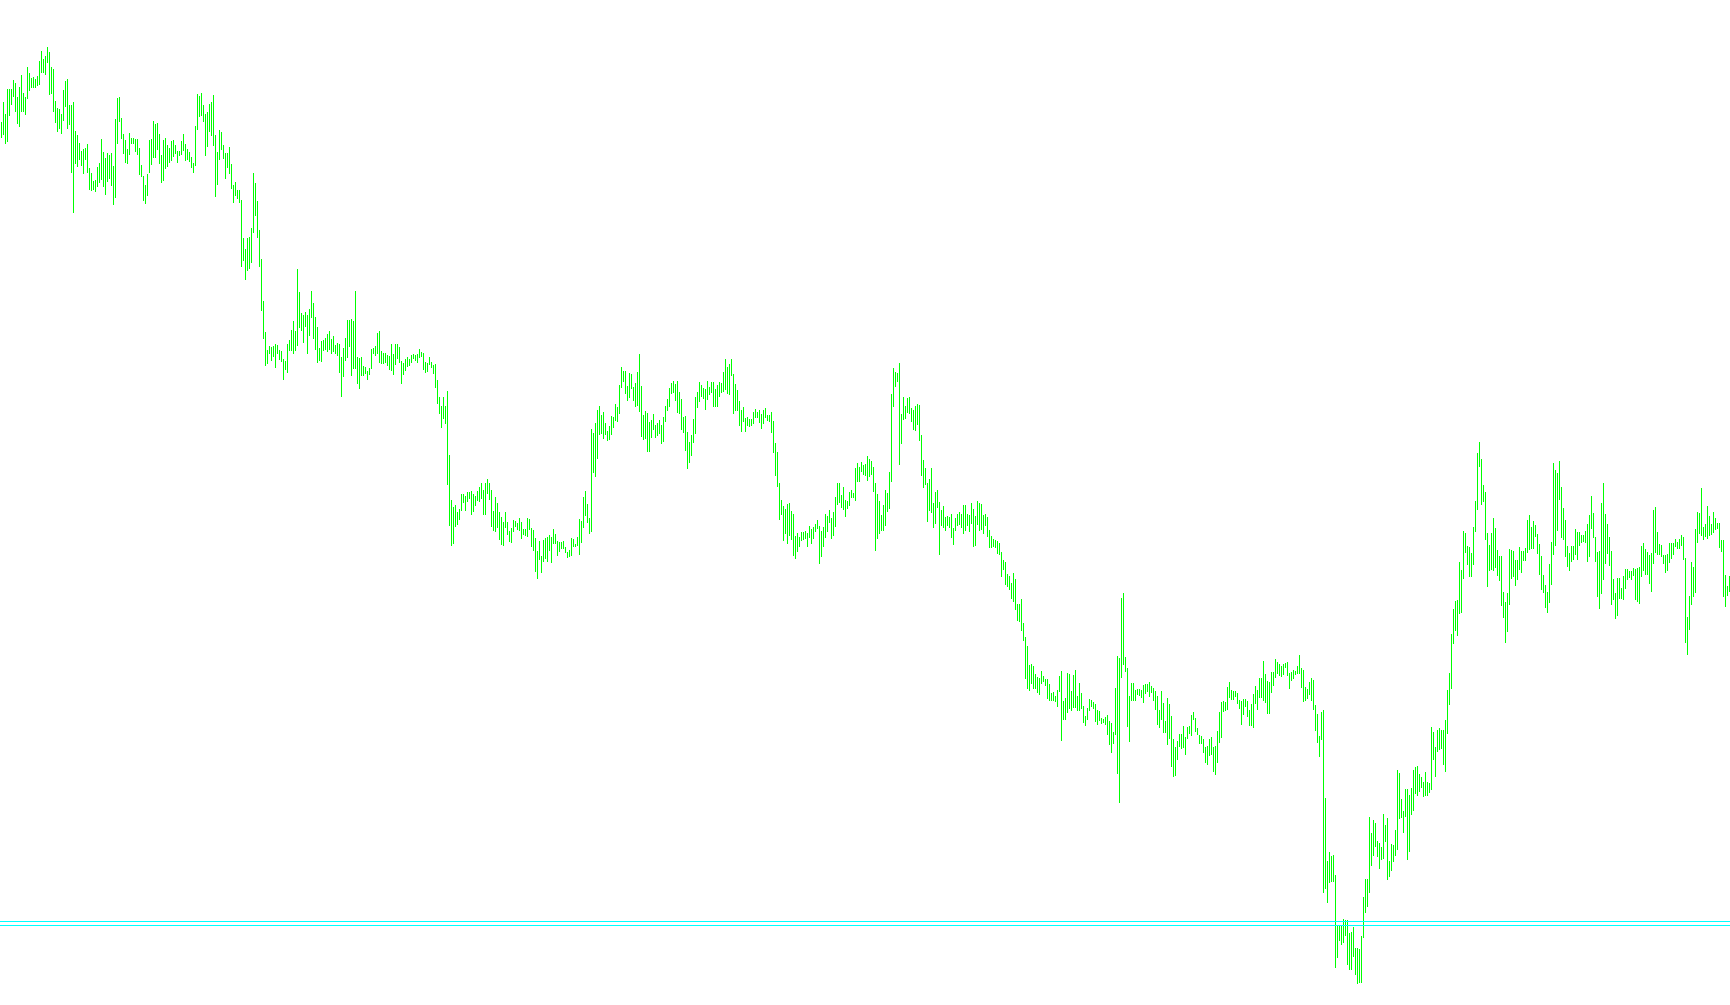
This script is designed to provide traders with a visual reference of significant price boundaries by identifying the highest and lowest price points reached over the last 5 trading days. By automating this calculation, it allows you to quickly see "breakout" levels without having to manually scan historical data.
How the Logic Works
The script functions through a three-step process to identify these key market levels:
1. Data Collection The tool scans the price history of the current asset. It specifically looks at the high and low prices recorded on the charts over the preceding 5 days.
2. Identifying Extremes Once the data is collected, the script runs a comparison logic:
- The 5-Day High: It compares the highest price of each individual day within that 5-day window to find the absolute peak.
- The 5-Day Low: It performs a similar comparison to find the absolute lowest point reached during that same period.
3. Visual Representation After calculating these two specific values, the script automatically draws two horizontal lines on your chart:
- High Line: A solid aqua-colored line is placed at the 5-day high price level.
- Low Line: A solid aqua-colored line is placed at the 5-day low price level.
Additionally, the script displays the exact numerical values for these highs and lows as a text comment on your screen, providing immediate clarity on where the current price stands in relation to recent historical boundaries.
//+------------------------------------------------------------------+
//|                                                 5dayBreakout.mq4 |
//|                                                        Bill Sica |
//|                                         http://www.tetsuyama.com |
//+------------------------------------------------------------------+
#property copyright "Bill Sica"
#property link      "http://www.tetsuyama.com"

#property indicator_chart_window
//---- input parameters
extern int       DAYS=5;
//+------------------------------------------------------------------+
//| Custom indicator initialization function                         |
//+------------------------------------------------------------------+

int init()
  {
//---- indicators

//---- indicators


//----
   return(0);
  }

//+------------------------------------------------------------------+
//| Custom indicator iteration function                              |
//+------------------------------------------------------------------+
int start()
  {
   double daily_high[20];
   double daily_low[20];
   double yesterday_close;
   double phigh,plow;
   int i=1;

//---- TODO: add your code here
ArrayResize(daily_high,DAYS);
ArrayResize(daily_low,DAYS);
ArrayInitialize(daily_high,0);
ArrayInitialize(daily_low,0);

ArrayCopySeries(daily_low, MODE_LOW, Symbol(), PERIOD_M5);
ArrayCopySeries(daily_high, MODE_HIGH, Symbol(), PERIOD_M5);

/* initialise */
plow=daily_low[1];
phigh=daily_high[1];

for(i=1;i<DAYS;i++)
{
   if(plow>daily_low[i])
   {
      plow =daily_low[i];
   }
}

for(i=1;i<DAYS;i++)
{
   if(phigh<daily_high[i])
   {
      phigh =daily_high[i];
   }
}

Comment("\n5dayH ",phigh,"\n5dayL ",plow);

ObjectDelete("5dayHigh");
ObjectDelete("5dayLow");

ObjectCreate("5dayHigh", OBJ_HLINE,0, CurTime(),phigh);
ObjectSet("5dayHigh",OBJPROP_COLOR,Aqua);
ObjectSet("5dayHigh",OBJPROP_STYLE,STYLE_SOLID);

ObjectCreate("5dayLow", OBJ_HLINE,0, CurTime(),plow);
ObjectSet("5dayLow",OBJPROP_COLOR,Aqua);
ObjectSet("5dayLow",OBJPROP_STYLE,STYLE_SOLID);

ObjectsRedraw();

   return(0);
  }
//+------------------------------------------------------------------
Comments