DailyData
Download script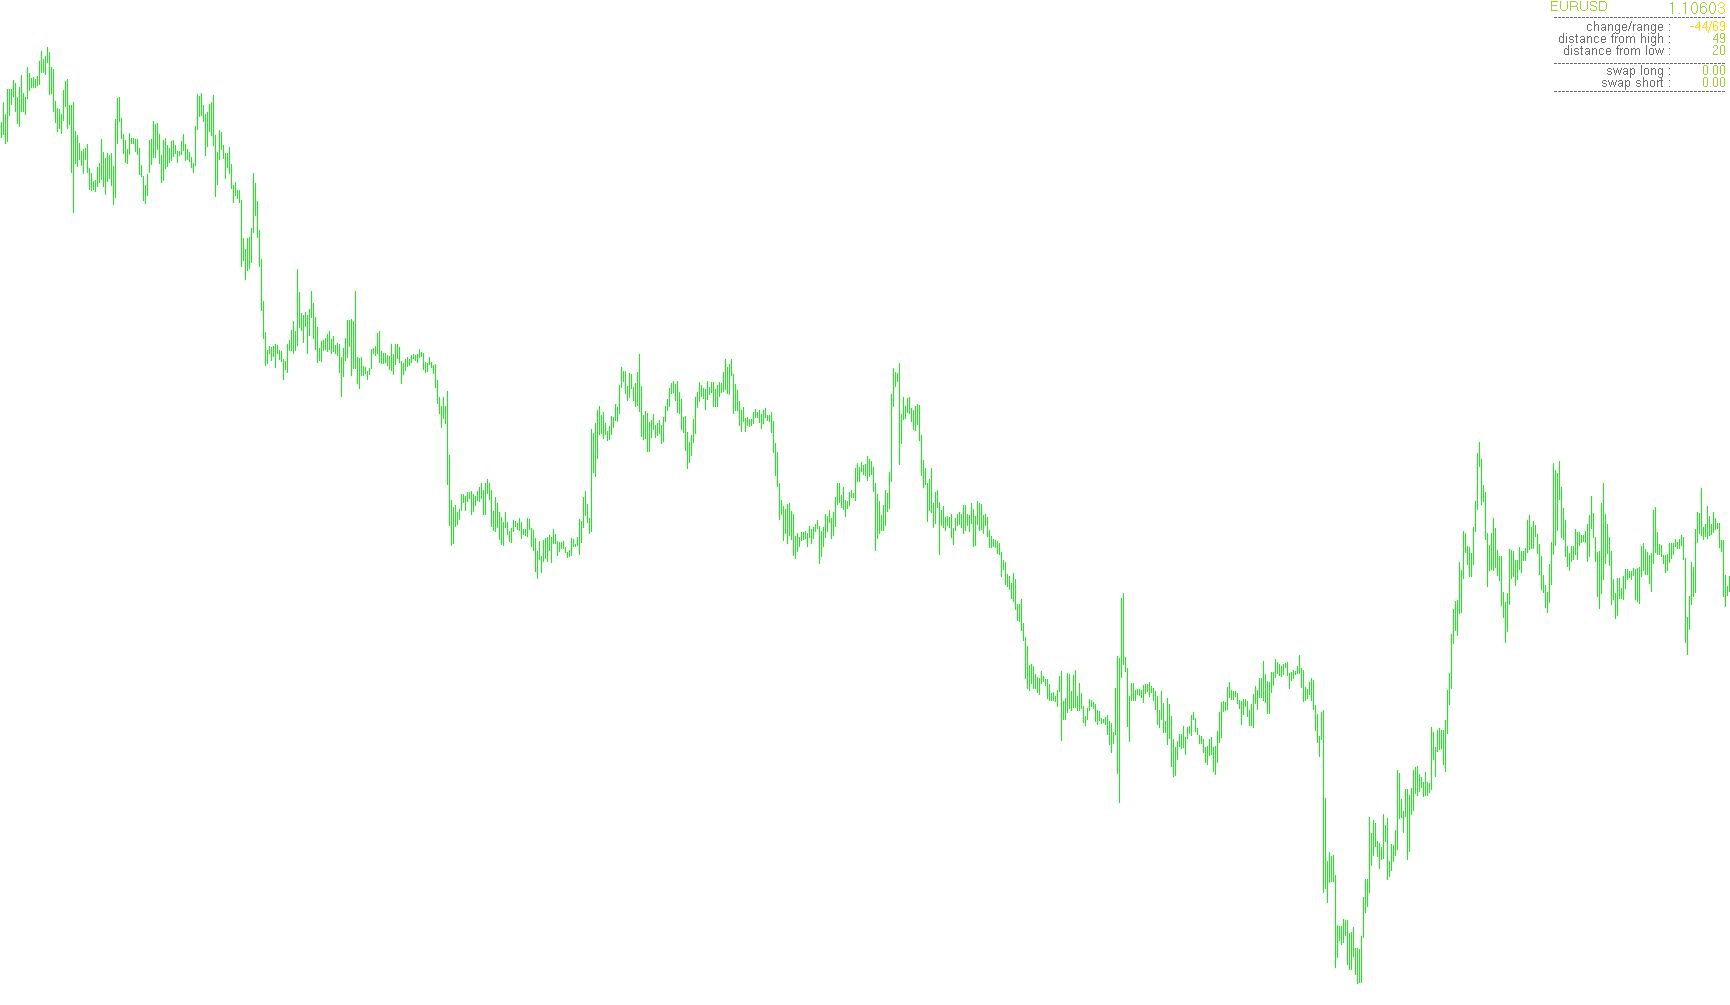
This script is designed to provide traders with a real-time visual and numerical overview of daily price action directly on their trading charts. Rather than just showing raw price lines, it calculates key market milestones to help users understand where the current price sits in relation to the day's overall movement.
Core Functionality
The tool focuses on identifying four primary data points: the daily high, the daily low, the daily open, and the current closing price. It automatically detects the timeframe you are viewing and adjusts its logic accordingly, ensuring that whether you are looking at a small chart or a large one, you are always seeing relevant daily data.
Visual Features
- Dynamic Background Zones: The script can highlight the area between the day's high and low with a shaded background. This creates a clear visual "container" for the day's trading activity, making it easy to see the total price range at a glance.
- Histogram Overlays: It places historical markers (bars) on the chart that represent these daily milestones, allowing you to see past price boundaries more clearly.
Data & Information Display
The script includes a customizable information dashboard that populates the corner of your screen with live statistics:
- Price Distance: It calculates exactly how far the current price is from the day's high and the day's low. This helps traders identify if the market is "stretched" or nearing an exhaustion point.
- Range Analysis: It provides the total range of the current day (the distance between the highest and lowest points reached).
- Price Change & Percentages: Depending on your settings, it can show the total price change for the day or the specific percentage/ratio of the movement.
- Swap Rates: For those who hold positions overnight, the script can display current Swap Long and Swap Short rates directly on the chart so you don't have to look them up separately.
Smart Adjustments
The logic includes an automatic "modifier" system. This ensures that whether you are trading a currency pair with 3 decimal places or one with 5, the numbers displayed remain accurate and scaled correctly for your specific asset. It also features a "Shift" setting, allowing you to move the visual markers forward or backward on the chart to keep the workspace clean.
//+------------------------------------------------------------------+
//|                                                    DailyData.mq4 |
//|                                                           mladen |
//+------------------------------------------------------------------+
#property copyright "mladen"
#property link      "mladenfx@gmail.com"

#property indicator_chart_window
#property indicator_buffers 4
#property indicator_color1  Green
#property indicator_color2  Maroon
#property indicator_color3  Lime
#property indicator_color4  Red
#property indicator_width1  1
#property indicator_width2  1
#property indicator_width3  2
#property indicator_width4  2

//
//
//
//
//

extern color zoneColor      = C'30,33,36';
extern int   CandleShift    = 8;
extern bool  ShowInfo       = True;
extern bool  ShowSwap       = True;
extern bool  ShowBackground = True;
extern bool  ShowBar        = True;

//
//
//
//
//

double DayHigh[];
double DayLow[];
double DayOpen[];
double DayClose[];
double prevCurr =-1;
int    DataPeriod;
int    DataBar;
string indNames = "DailyData";

//+------------------------------------------------------------------+
//|                                                                  |
//+------------------------------------------------------------------+

int init()
{
   SetIndexBuffer(0, DayHigh);
   SetIndexBuffer(1, DayLow);
   SetIndexBuffer(2, DayClose);
   SetIndexBuffer(3, DayOpen);
      if (ShowBar)
         for (int i=0;i<4;i++)
            {
               SetIndexStyle(i,DRAW_HISTOGRAM);
               SetIndexShift(i,CandleShift);
               SetIndexLabel(i,"Daily data");
            }
      else  for (i=0;i<4;i++) SetIndexStyle(i,DRAW_NONE);

   //
   //
   //
   //
   //

   switch(Period())
   {
      case PERIOD_MN1:
      case PERIOD_W1:  DataPeriod = PERIOD_MN1; break;
      case PERIOD_D1:  DataPeriod = PERIOD_W1;  break;
      default:         DataPeriod = PERIOD_D1;
   }
   prevCurr = -1;
   return(0);
}
int deinit()
{
   for (int counter=-1;counter<17;counter++) ObjectDelete(indNames+counter);
   return(0);
}


//+------------------------------------------------------------------+
//|                                                                  |
//+------------------------------------------------------------------+

int start()
{
   int    digits   = MarketInfo(Symbol(),MODE_DIGITS);
   double modifier = 1;

      if (digits==3 || digits==5) modifier = 10.0;
      else
            if (ObjectFind(indNames+"16") != -1)
                ObjectDelete(indNames+"16");

      //
      //
      //
      //
      //

      DataBar  = iBarShift(NULL,DataPeriod,Time[0]);
         double HiDAILY  = iHigh (NULL,DataPeriod,DataBar);
         double LoDAILY  = iLow  (NULL,DataPeriod,DataBar);
         double current  = iClose(NULL,DataPeriod,DataBar);
         double range    = getRange(DataPeriod)/modifier;
         double change   = (current-iOpen(NULL,DataPeriod,DataBar))/(Point*modifier);
         int    limit,i;

      //
      //
      //
      //
      //

      if (ShowInfo)
      {
          if (ObjectFind(indNames+"1") ==-1) {
                  objectCreate("1",10,10,"-------------------------------------------",10,NULL);
                  objectCreate("3",60,32,"distance from high : ");
                  objectCreate("4",60,44,"distance from low : " );
                  objectCreate("5",10,56,"-------------------------------------------",10,NULL);
                     if (ShowSwap)
                     {
                        objectCreate("2",60,20,"change/range : ");
                        objectCreate("6",60,64,"swap long : "         );
                        objectCreate("7",60,76,"swap short : "        );
                        objectCreate("8",10,84,"-------------------------------------------",10,NULL);
                     }
                     else
                     {
                        objectCreate("2",60,20,"range : "       );
                        objectCreate("6",60,64,"distance from open : ");
                        objectCreate("8",10,76,"-------------------------------------------",10,NULL);
                     }
         }

         //
         //
         //
         //
         //

         if (prevCurr != current)
            {
               prevCurr = current;
                  double currFromHi = (HiDAILY-current)/(Point*modifier);
                  double currFromLo = (current-LoDAILY)/(Point*modifier);

                  //
                  //
                  //
                  //
                  //

                     objectCreate("0",128,0,Symbol(),10,"Arial bold",YellowGreen);
                     if (ShowSwap)
                           objectCreate("10",10,20,DoubleToStr(change,0)+"/"+DoubleToStr(range,0)    ,10,"Arial bold",Gold);
                     else  objectCreate("10",10,20,                          DoubleToStr(range,0)    ,10,"Arial bold",Gold);
                     objectCreate("11",10,32,DoubleToStr(currFromHi,0)                         ,10,"Arial bold",YellowGreen);
                     objectCreate("12",10,44,DoubleToStr(currFromLo,0)                         ,10,"Arial bold",YellowGreen);
                     if (ShowSwap)
                     {
                        objectCreate("13",10,64,DoubleToStr(MarketInfo(Symbol(),MODE_SWAPLONG),2) ,10,"Arial bold",YellowGreen);
                        objectCreate("14",10,76,DoubleToStr(MarketInfo(Symbol(),MODE_SWAPSHORT),2),10,"Arial bold",YellowGreen);
                     }
                     else
                     {
                        if (change<0)
                              objectCreate("13",10,64,DoubleToStr(change,0) ,10,"Arial bold",Red);
                        else  objectCreate("13",10,64,DoubleToStr(change,0) ,10,"Arial bold",Gold);
                     }
                  string currentValue = DoubleToStr(current,digits);
                     objectCreate("15",10, 0,currentValue,12,"Arial bold",YellowGreen);
                     if (modifier !=1)
                        objectCreate("16",10, 0,StringSubstr(currentValue,StringLen(currentValue)-1),12,"Arial bold",Gold);
            }
      }
      setBarIndicator(change,HiDAILY,LoDAILY,iOpen(NULL,DataPeriod,DataBar),current);
      for(i=0,limit=Bars-1;i<4;i++) SetIndexDrawBegin(i,limit);
   return(0);
  }

//+------------------------------------------------------------------+
//+------------------------------------------------------------------+
//
//
//
//
//

void setBarIndicator(double change, double hi,double low, double open, double close)
{
   string name  = indNames+"-1";
   int    shift = 0;

   if (change>0) { DayHigh[shift]  = hi;  DayLow[shift] = low; }
   else          { DayHigh[shift]  = low; DayLow[shift] = hi;  }
                   DayOpen[shift]  = open;
                   DayClose[shift] = close;

   if (ShowBackground)
      {
         if (ObjectFind(name) == -1)
             ObjectCreate(name,OBJ_RECTANGLE,0,0,0);
             ObjectSet(name,OBJPROP_TIME1,iTime(NULL,DataPeriod,DataBar));
             ObjectSet(name,OBJPROP_TIME2,iTime(NULL,         0,0));
             ObjectSet(name,OBJPROP_PRICE1,hi);
             ObjectSet(name,OBJPROP_PRICE2,low);
             ObjectSet(name,OBJPROP_COLOR,zoneColor);
      }
}

//
//
//
//
//

double getRange(int period)
{
      double range = iHigh(NULL, period, DataBar) - iLow(NULL, period, DataBar);
      return (NormalizeDouble(range/Point,0));
}

//
//
//
//
//

void objectCreate(string name,int x,int y,string text="-",int size=10,
                  string font="Arial",color colour=DimGray,int window = 0)
{
   if (ObjectFind(indNames+name) == -1)
   {
      ObjectCreate(indNames+name,OBJ_LABEL,window,0,0);
         ObjectSet(indNames+name,OBJPROP_CORNER,1);
         ObjectSet(indNames+name,OBJPROP_XDISTANCE,x);
         ObjectSet(indNames+name,OBJPROP_YDISTANCE,y);
   }
   ObjectSetText(indNames+name,text,size,font,colour);
}
Comments