Indicator

ARROW_RSI-8_CROSS-55 45alarton_001

iRSI
Indicator

ARROW_RSI-8_CROSS-55 45alarton_002

iRSI
Indicator

ARROW_RSI-8_CROSS-55 45_001

iRSI
Indicator

ARROW_RSI-8_CROSS-55 45_002

iRSI
Indicator

ARROW_RSI-8_CROSS-55 45_003

iRSI
ARROW_RSI-8_CROSS-55 45_v2
Indicator

ARROW_RSI-8_CROSS-55 45_v2

iRSI

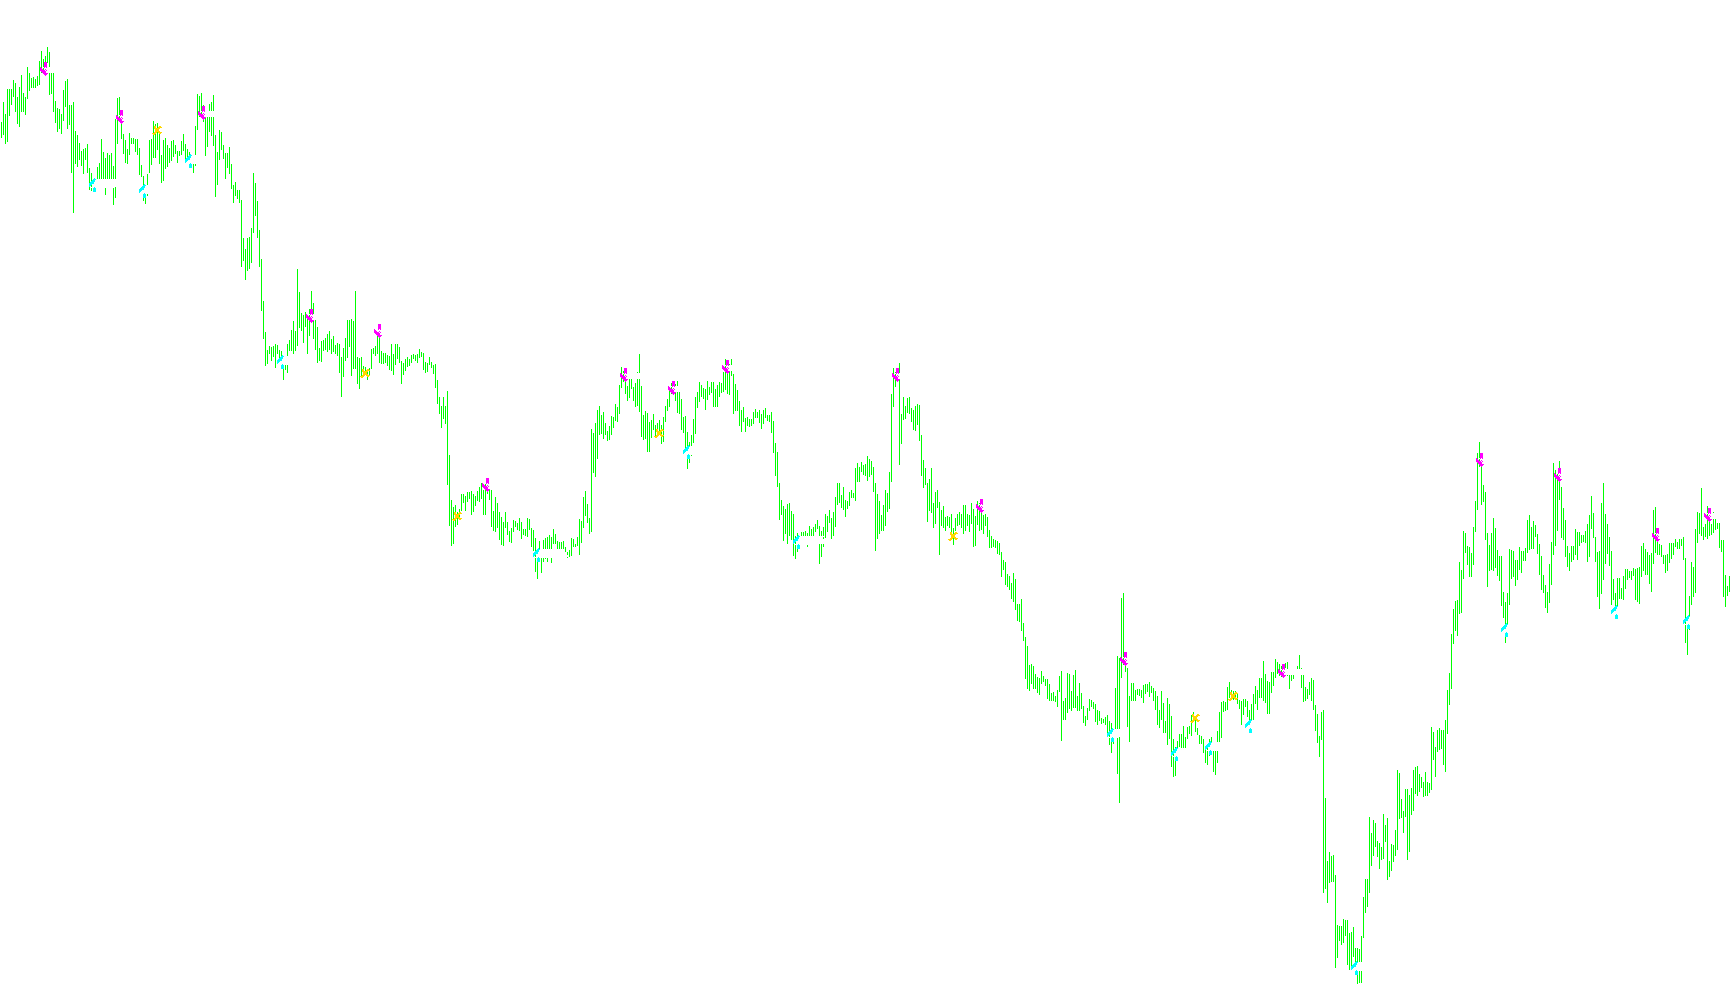
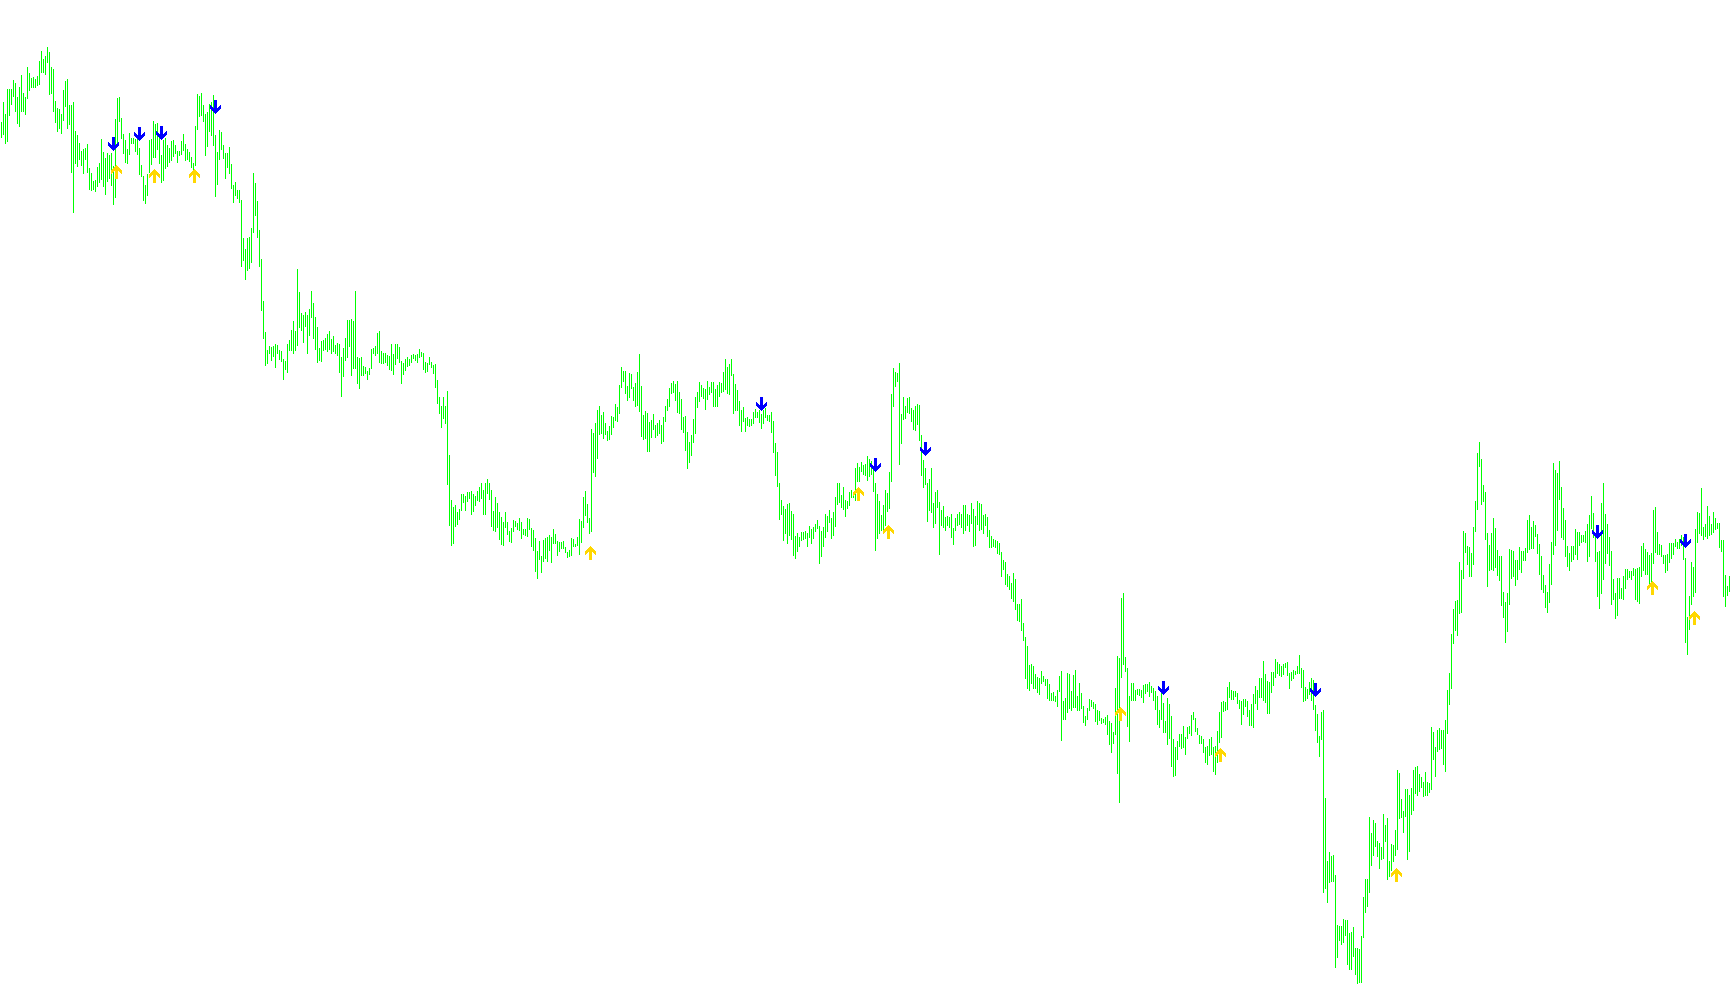
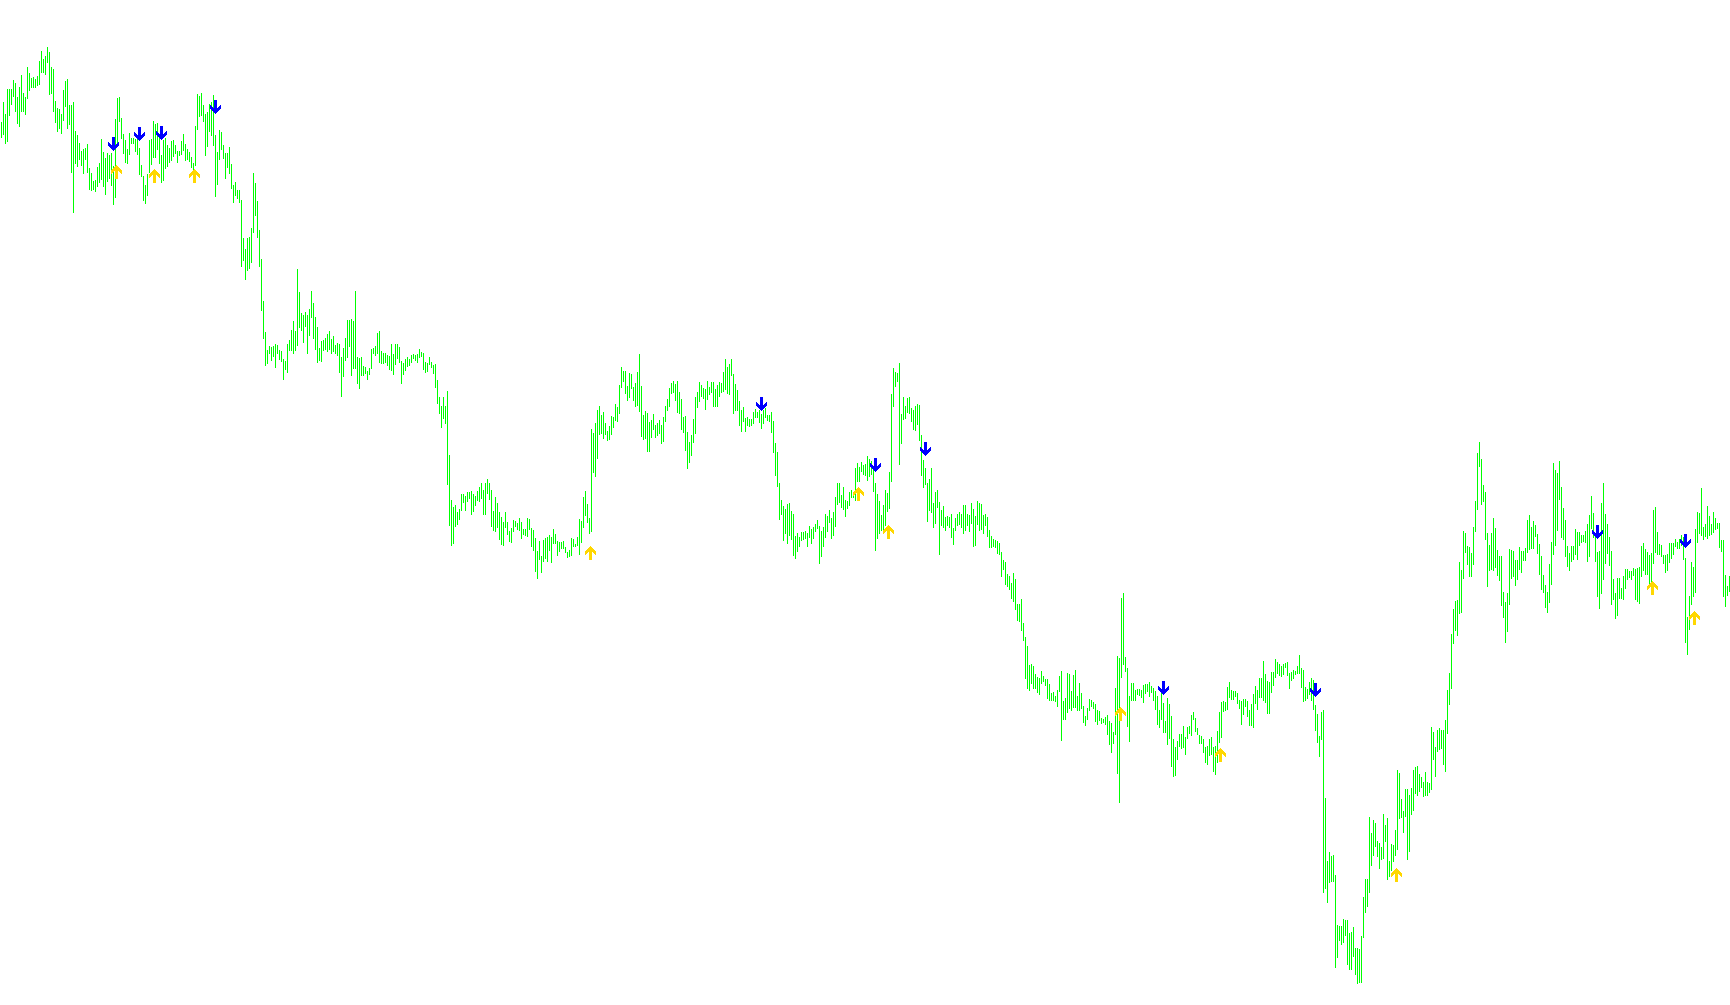
This indicator identifies bullish and bearish trend shifts by detecting discrete breaches of the 55 and 45 RSI levels while utilizing a state-reset mechanism to filter out repetitive signals.
ArrZZx2 v3.9
Indicator

ArrZZx2 v3.9

iMA

This indicator utilizes a multi-layered signal processing approach by applying weighted moving averages, smoothing kernels, and recursive peak detection to filter noise and identify structural trend reversals.

ArrZZx2
Indicator

ArrZZx2

iMA

This indicator identifies structural market reversals by synthesizing weighted moving averages into a smoothed price ribbon to detect local extrema and trend-shifting pivot points.

ARSI
Indicator

ARSI

iRSI

This indicator dynamically blends price action with an adjusted RSI volatility coefficient to generate a smoothed momentum trajectory.

Ascbars
Indicator

Ascbars

This script transforms standard price action into smoothed trend-following visuals by calculating synthetic open, high, low, and close values based on previous candle extremes and current mean prices.

Ascbars_v1
Indicator

Ascbars_v1

This indicator calculates synthetic price action by averaging historical open, high, low, and close values to generate smoothed candlestick trends.

ASCT1sig
Indicator

ASCT1sig

iWPR
ASCT1sig_v1
Indicator

ASCT1sig_v1

iWPR
ASCtrend+Koments
Indicator

ASCtrend+Koments

iWPR
ASCTrend
Indicator

ASCTrend

iWPR
ASCTrend1
Indicator

ASCTrend1

iWPR
ASCTrend1sig
Indicator

ASCTrend1sig

iWPR
ASCTrend1sig_noSound
Indicator

ASCTrend1sig_noSound

iWPR
ASCTrend1sig_noSound_001
Indicator

ASCTrend1sig_noSound_001

iWPR
ASCTrend1sig_noSound_v1
Indicator

ASCTrend1sig_noSound_v1

iWPR
ASCTrend1sig_noSound_v2
Indicator

ASCTrend1sig_noSound_v2

iWPR
ASCTrend1sig_v1
Indicator

ASCTrend1sig_v1

iWPR
ASCTrend1sig_v2
Indicator

ASCTrend1sig_v2

iWPR
ASCTrend1sig_v4
Indicator

ASCTrend1sig_v4

iWPR
ASCTrend1_v1
Indicator

ASCTrend1_v1

iWPR
ASCTrend1_v2
Indicator

ASCTrend1_v2

iWPR
ASCTrend1_v3
Indicator

ASCTrend1_v3

iWPR
AscTrend2
Indicator

AscTrend2

This indicator identifies high-probability reversal zones by synchronizing multi-period moving average crossovers with volatility-adjusted fractal price peaks and structural pivot points.

Asctrend3times_MBK
Indicator

Asctrend3times_MBK

iWPR
Asctrend3times_MBK_001
Indicator

Asctrend3times_MBK_001

iWPR
ASCTrendK
Indicator

ASCTrendK

iWPR
ASCTrendK_v1
Indicator

ASCTrendK_v1

iWPR
ASCTrend_SellBuy Sound
Indicator

ASCTrend_SellBuy Sound

iWPR
ASCTrend_Sound
Indicator

ASCTrend_Sound

iWPR
ASCTrend_Sound.mq4
Indicator

ASCTrend_Sound.mq4

iWPR
ASCTrend_Sound_MTF
Indicator

ASCTrend_Sound_MTF

iWPR
ASCTrend_v1
Indicator

ASCTrend_v1

iWPR
ASCTrend_v2
Indicator

ASCTrend_v2

iWPR
ASCTrend_v3
Indicator

ASCTrend_v3

iWPR
ASI
Indicator

ASI

iATR

This indicator calculates a cumulative momentum value by weighting price movement against volatility components including Average True Range, Extreme Reach, and Candle Shadow.

AsianFrankfurtLondonSessions_GMT+2
Indicator

AsianFrankfurtLondonSessions_GMT+2

Visualizes historical high and low price ranges for specific Asian, European, and American trading sessions over a customizable period.

AsianFrankfurtLondonSessions_GMT
Indicator

AsianFrankfurtLondonSessions_GMT

Visually partitions historical chart data into distinct geographic trading sessions by highlighting high and low price ranges across specific time windows.

ASKBID_v2
Indicator

ASKBID_v2

This indicator maps the real-time bid and ask price levels as discrete histograms to visualize the current market spread across historical bars.

Ask_Shadow
Indicator

Ask_Shadow

This indicator maps price action by projecting the current bid-ask spread onto historical high peaks to visualize potential liquidity gaps.

Ask_Shadow_v1
Indicator

Ask_Shadow_v1

This indicator visualizes the discrepancy between raw price highs and adjusted ask-price ceilings to highlight liquidity gaps.

Ask_Shadow_v2
Indicator

Ask_Shadow_v2

This indicator visualizes the precise boundary between actual high price action and the executable limit by overlaying the current market spread onto historical peaks.

asys_beats
Indicator

asys_beats

Identifies recurring price cycles by projecting linear mathematical divisions at fixed intervals to reveal rhythmic market vibrations.

asys_beats_TRO_MODIFIED_VERSION
Indicator

asys_beats_TRO_MODIFIED_VERSION

Indicator

asys_fibo

as_HHLL
Indicator

as_HHLL

Identifies local price ceilings and floors over a rolling period while optionally calculating midpoint equilibrium levels.