ASI
Download script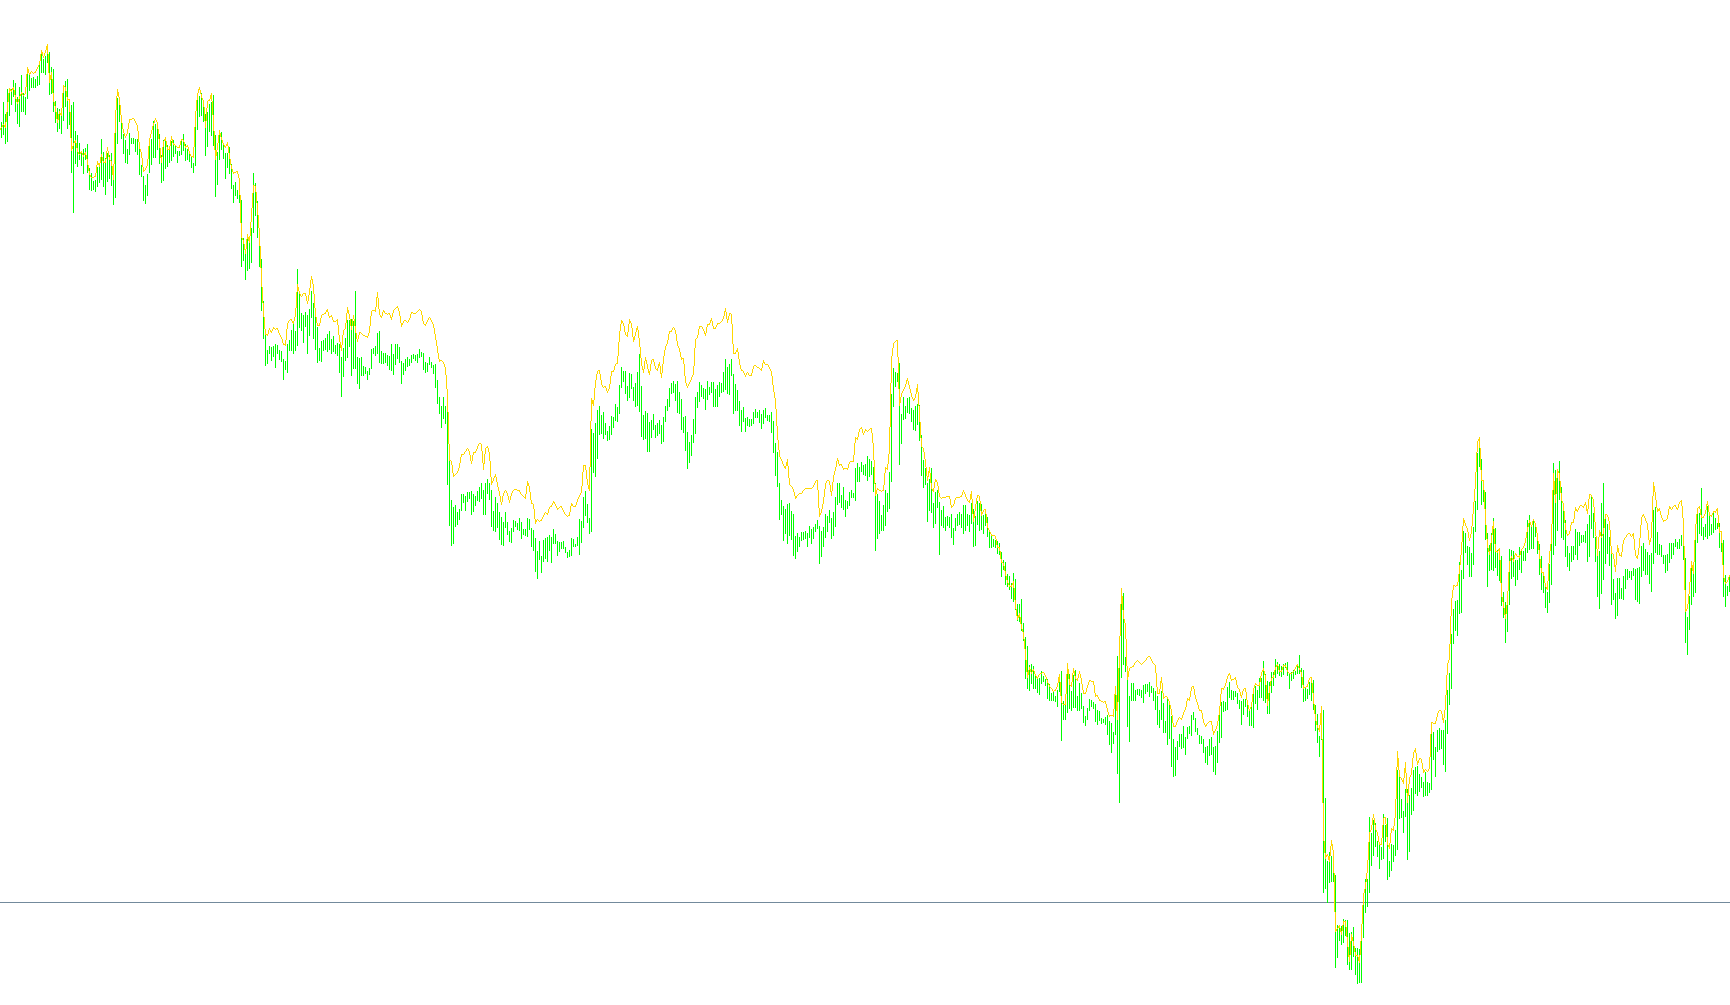
The Accumulation Swing Index (ASI) is a specialized technical analysis tool designed to help traders visualize market momentum and the underlying strength of price movements. Unlike standard indicators that simply track price, this script analyzes the relationship between "true" market movement and the "noise" created by volatility.
How the Logic Works
The core purpose of this indicator is to filter out insignificant price fluctuations to reveal whether a trend is gaining actual substance or merely reacting to erratic market behavior. It achieves this through a multi-step calculation process:
1. Identifying Volatility vs. Movement The script looks at three distinct types of data points for every price candle:
- True Range: The total distance covered by the price during a period (from high to low).
- External Range: This measures "gaps" or movements that happen outside the standard boundaries of the previous price action.
- Shoulder Strength: This accounts for the size of the candle body itself, distinguishing between a candle with a lot of activity (long wicks) and one with solid movement (a large body).
2. The "R" Factor (The Filter) By combining these three data points into a single value (referred to in the logic as "R"), the script creates a sophisticated measure of "effective" volatility. This helps the indicator understand what constitutes a meaningful move versus a random price spike. If there is no significant movement, the index remains stable; if there is a major shift in price that isn't just noise, the indicator reacts accordingly.
3. Momentum Calculation Once the script understands the "quality" of the movement, it calculates the momentum. It takes into account:
- The current closing price relative to the previous close.
- The relationship between the current open and close prices (the candle body).
- The proportion of this move compared to the volatility filter established in the previous step.
4. The Accumulation Effect Finally, rather than showing these moments in isolation, the script uses an "accumulation" logic. It adds the momentum of the current moment to the cumulative total of all previous moments. This results in a smooth line that builds upon itself over time.
What this means for the trader
Because the data is accumulated, the resulting visual output shows a running total of market energy.
- Upward trends occur when the "positive" momentum of price moves consistently outweighs the volatility noise.
- Downward trends occur when the "negative" momentum takes over.
- Flattening lines indicate periods where the price is moving, but the movement lacks the strength or substance to change the overall trend—essentially signaling a consolidation or a lack of conviction in the market.
//+------------------------------------------------------------------+
//|                                                          ASI.mq4 |
//|                      Copyright © 2007, MetaQuotes Software Corp. |
//|                                        http://www.metaquotes.net |
//+------------------------------------------------------------------+
#property copyright "Copyright © 2007, MetaQuotes Software Corp."
#property link      "http://www.metaquotes.net/"
//----
#property indicator_separate_window
#property indicator_buffers 1
#property indicator_color1 DarkBlue
//---- input parameters
extern double T = 300.0;
//---- buffers
double ExtMapBuffer1[];
double SIBuffer[];
//+------------------------------------------------------------------+
//| Custom indicator initialization function                         |
//+------------------------------------------------------------------+
int init()
  {
//---- indicators
   IndicatorBuffers(2);
   SetIndexStyle(0, DRAW_LINE);
   SetIndexBuffer(0, ExtMapBuffer1);
   SetIndexLabel(0, "Accumulation Swing Index");
   SetIndexBuffer(1, SIBuffer);
   SetIndexEmptyValue(0, 0.0);
   SetIndexEmptyValue(1, 0.0);
//----
   return(0);
  }
//+------------------------------------------------------------------+
//| Custom indicator deinitialization function                       |
//+------------------------------------------------------------------+
int deinit()
  {
//----
   return(0);
  }
//+------------------------------------------------------------------+
//| Custom indicator iteration function                              |
//+------------------------------------------------------------------+
int start()
  {
   int counted_bars = IndicatorCounted();
//----
   int i, limit;
   double R, K, TR, ER, SH, Tpoints;
   if(counted_bars == 0)
       limit = Bars - 1;
   if(counted_bars > 0)
       limit = Bars - counted_bars;
   Tpoints = T*MarketInfo(Symbol(), MODE_POINT);
   for(i = limit; i >= 0; i--)
     {
       TR = iATR(Symbol(), 0, 1, i);
       if(Close[i+1] >= Low[i] && Close[i+1] <= High[i])
           ER = 0;
       else
         {
           if(Close[i+1] > High[i])
               ER = MathAbs(High[i] - Close[i+1]);
           if(Close[i+1] < Low[i])
               ER = MathAbs(Low[i] - Close[i+1]);
         }
       K = MathMax(MathAbs(High[i] - Close[i+1]), MathAbs(Low[i] - Close[i+1]));
       SH = MathAbs(Close[i+1] - Open[i+1]);
       R = TR - 0.5*ER + 0.25*SH;
       if(R == 0)
           SIBuffer[i] = 0;
       else
           SIBuffer[i] = 50*(Close[i] - Close[i+1] + 0.5*(Close[i] - Open[i]) +
                         0.25*(Close[i+1] - Open[i+1]))*(K / Tpoints) / R;
       ExtMapBuffer1[i] = ExtMapBuffer1[i+1] + SIBuffer[i];
     }
//----
   return(0);
  }
//+------------------------------------------------------------------+
Comments