ASCTrend1
Download script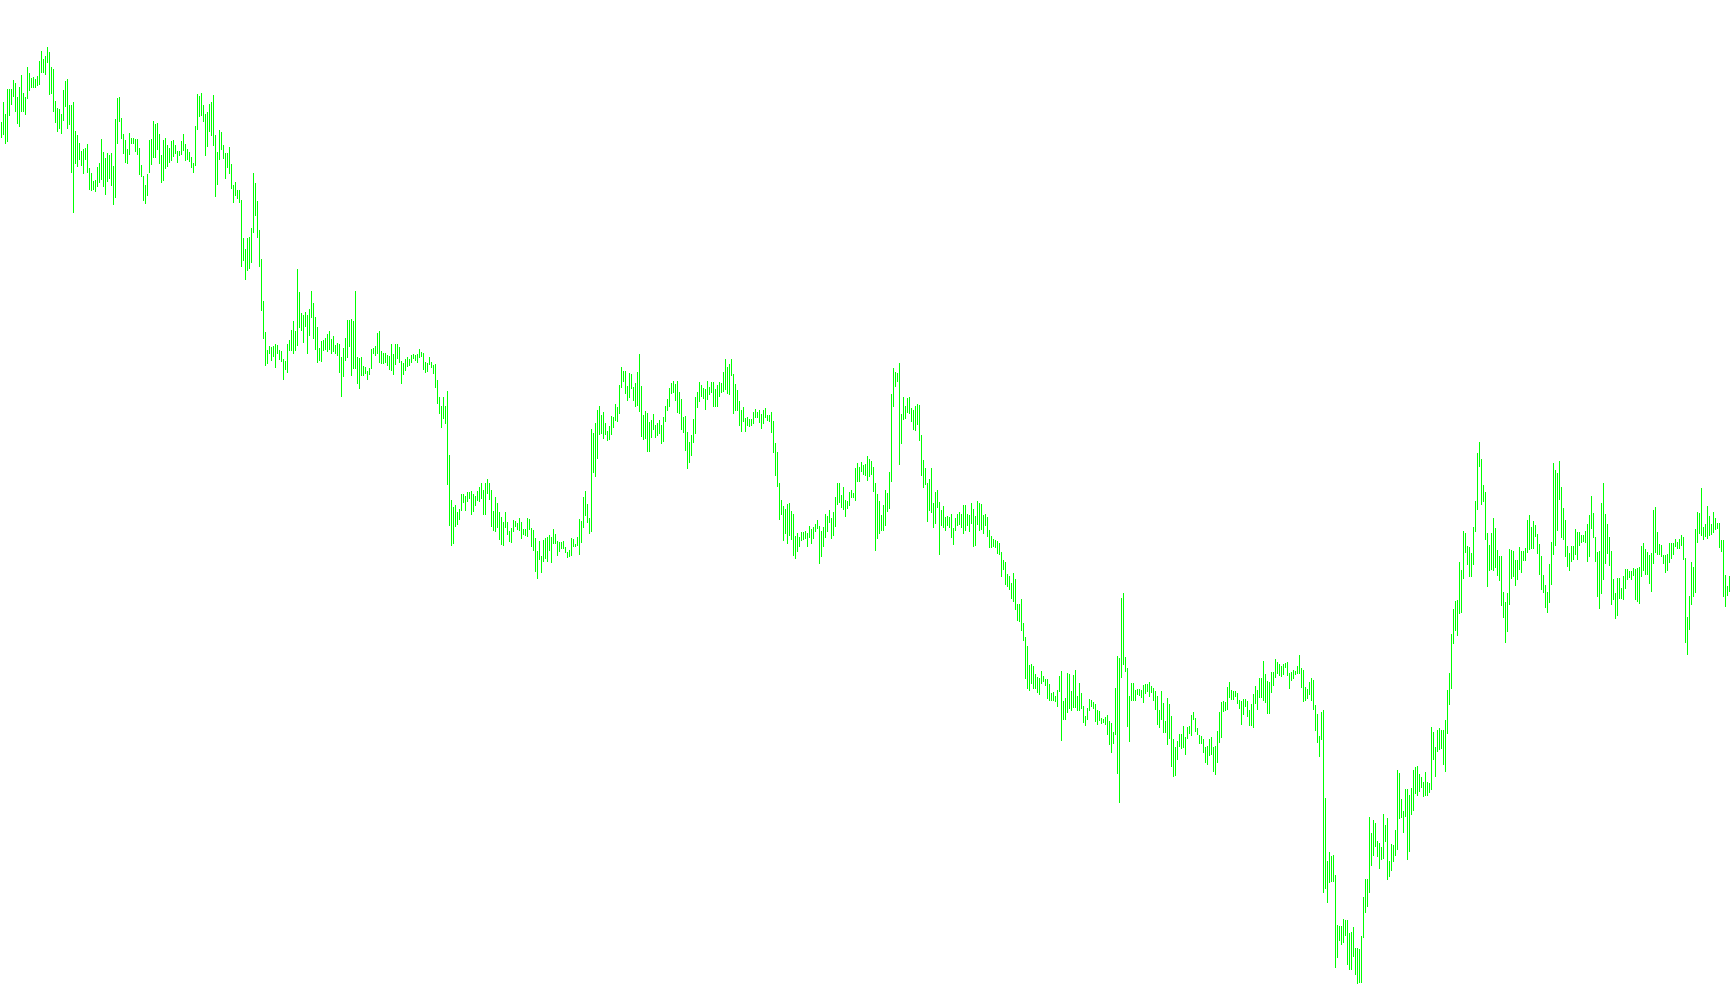
This script is designed to function as a visual trend indicator for trading charts, specifically identifying shifts in market momentum and price direction. Instead of providing a simple "up or down" arrow, it analyzes historical price action to determine the strength of the current trend and marks specific price levels accordingly.
Core Logic Overview
The tool operates by analyzing price volatility and momentum over a rolling window of data. It focuses on identifying "significant moves"—moments where the price breaks away from its recent average behavior—to decide how the market should be interpreted.
How the Analysis Works
The script follows a multi-step process to interpret market data:
1. Volatility Assessment The tool first calculates the "Average Range" of the market over the last 10 bars. This establishes a baseline for what constitutes a "normal" price movement in the current environment. It uses this average as a yardstick to filter out minor market noise from actual significant trends.
2. Identifying Trend Breakouts The script looks for two specific types of aggressive price movements:
- Gap Analysis: It checks if the opening price of a candle is significantly different from the closing price of the previous candle (relative to the average range).
- Momentum Analysis: It checks if the price has moved a substantial distance over a short period compared to its recent average.
3. Dynamic Sensitivity Adjustment Depending on whether these significant breakouts are detected, the script automatically adjusts its internal sensitivity. If a strong breakout is identified, it "tightens" its logic to react more quickly to new movements; if the market is drifting without clear breakouts, it stays in a more "relaxed" state to avoid false signals.
4. Momentum Scoring Once the sensitivity is set, the script uses a specialized momentum calculation (derived from a weighted percentage calculation). It measures how far the current price has moved relative to its historical range.
Visual Representation
The final output of this logic is displayed as two distinct histogram lines:
- High-Trend Identification: When the momentum score exceeds a specific upper threshold, the script identifies a strong trend and plots a boundary based on the high and low prices of that period.
- Low-Trend Identification: Conversely, if the momentum score falls below a specific lower threshold, it indicates a trend in the opposite direction.
In essence, the tool acts as a filter that ignores "choppy" sideways movement and highlights periods where price momentum has reached a statistically significant level, helping traders visualize the current directional bias of the market.
//+------------------------------------------------------------------+
//| ASCTrend1
//| Ramdass - Conversion only
//+------------------------------------------------------------------+

#property indicator_chart_window
#property indicator_buffers 2
#property indicator_color1 Red
#property indicator_color2 Lime

//---- input parameters
extern int RISK=3;
extern int CountBars=300;

//---- buffers
double val1[];
double val2[];

//+------------------------------------------------------------------+
//| Custom indicator initialization function                         |
//+------------------------------------------------------------------+
int init()
  {
//---- indicator line
   IndicatorBuffers(2);
   SetIndexStyle(0,DRAW_HISTOGRAM,0,1);
   SetIndexStyle(1,DRAW_HISTOGRAM,0,1);
   SetIndexBuffer(0,val1);
   SetIndexBuffer(1,val2);

//----
   return(0);
  }
//+------------------------------------------------------------------+
//| ASCTrend1                                                  |
//+------------------------------------------------------------------+
int start()
  {
   if (CountBars>=Bars) CountBars=Bars;
   SetIndexDrawBegin(0,Bars-CountBars+11+1);
   SetIndexDrawBegin(1,Bars-CountBars+11+1);
   int i,shift,counted_bars=IndicatorCounted();
   int Counter,i1,value10,value11;
   double value1,x1,x2;
   double value2,value3;
   double TrueCount,Range,AvgRange,MRO1,MRO2;

   value10=3+RISK*2;
   x1=67+RISK;
   x2=33-RISK;
   value11=value10;
//----
   if(Bars<=value11+1) return(0);
//---- initial zero
   if(counted_bars<value11+1)
   {
      for(i=1;i<=0;i++) val1[CountBars-i]=0.0;
      for(i=1;i<=0;i++) val2[CountBars-i]=0.0;
   }
//----
   shift=CountBars-11-1;
   while(shift>=0)
     {

   Counter=shift;
	Range=0.0;
	AvgRange=0.0;
	for (Counter=shift; Counter<=shift+9; Counter++) AvgRange=AvgRange+MathAbs(High[Counter]-Low[Counter]);

	Range=AvgRange/10;
	Counter=shift;
	TrueCount=0;
	while (Counter<shift+9 && TrueCount<1)
		{if (MathAbs(Open[Counter]-Close[Counter+1])>=Range*2.0) TrueCount=TrueCount+1;
		Counter=Counter+1;
		}
	if (TrueCount>=1) {MRO1=Counter;} else {MRO1=-1;}
	Counter=shift;
	TrueCount=0;
	while (Counter<shift+6 && TrueCount<1)
		{if (MathAbs(Close[Counter+3]-Close[Counter])>=Range*4.6) TrueCount=TrueCount+1;
		Counter=Counter+1;
		}
	if (TrueCount>=1) {MRO2=Counter;} else {MRO2=-1;}
	if (MRO1>-1) {value11=3;} else {value11=value10;}
	if (MRO2>-1) {value11=4;} else {value11=value10;}
	value2=100-MathAbs(iWPR(NULL,0,value11,shift)); // PercentR(value11=9)
   val1[shift]=0;
	val2[shift]=0;
	if (value2>x1)
		{
		val1[shift]=Low[shift]; val2[shift]=High[shift];
		}
	if (value2<x2)
		{
		val1[shift]=High[shift]; val2[shift]=Low[shift];
		}

      shift--;
     }

   return(0);
  }
//+------------------------------------------------------------------+
Comments