as_HHLL
Download script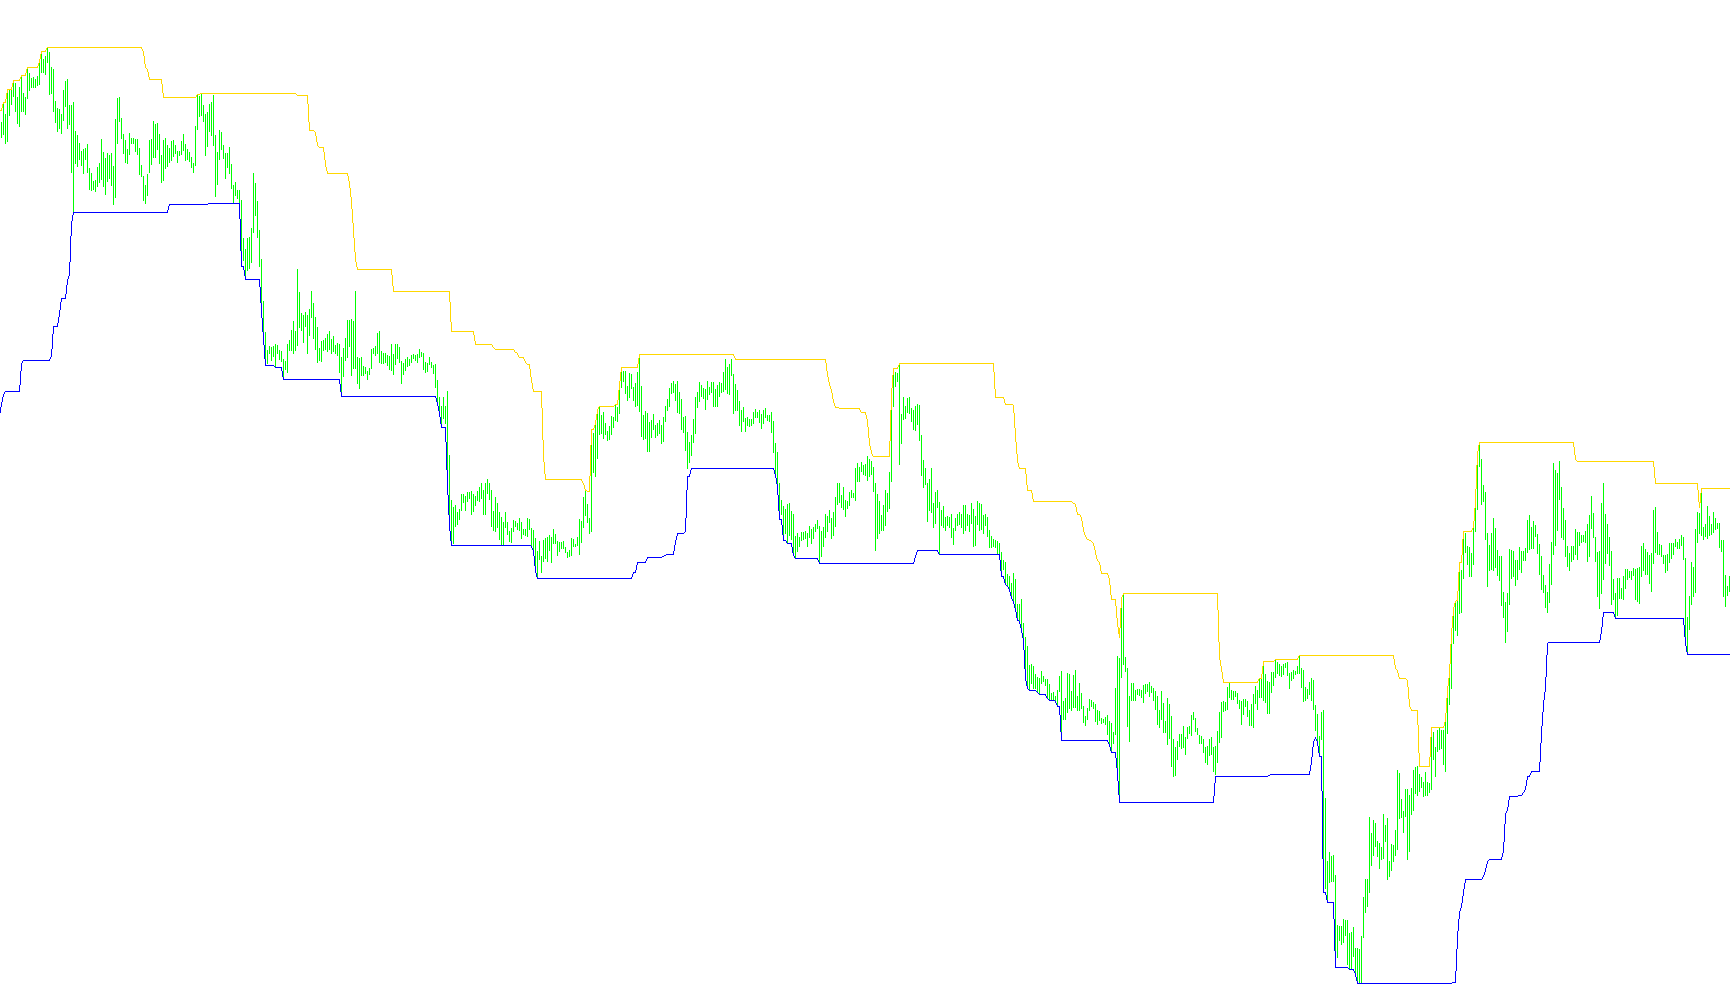
This tool is designed as a visual overlay for trading charts to help identify key price levels based on historical price action. It functions by scanning the market to pinpoint specific highs and lows over a defined period, making it easier for traders to visualize structural boundaries.
Core Functionality
The script analyzes the price history of a specific timeframe to establish three primary data points:
- Resistance Levels (Highs): The tool identifies the highest price reached within a user-defined lookback period. It draws a reference line at this peak, adjusted slightly by the current market spread if the user chooses to include it. This helps in identifying potential "ceilings" where the price may face selling pressure.
- Support Levels (Lows): Similarly, the tool identifies the lowest price reached within that same period. It marks these points as reference lines, highlighting potential "floors" where the price might find buying interest.
- Median Equilibrium (Optional): The script includes a feature to calculate and display the exact midpoint between the identified high and low. This represents the equilibrium zone of that specific price range, which can be used to determine if the market is trading in the upper or lower half of its recent range.
Key Features & Customization
- Adjustable Lookback Range: Users can define the "window" of time the tool looks at (the number of candles/bars). A larger window captures broader market trends, while a smaller window focuses on immediate, short-term price movements.
- Spread Awareness: The logic includes a toggle to factor in the current market spread. When enabled, it ensures that the identified high levels account for the difference between the bid and ask prices, providing a more accurate representation of actual tradable prices.
- Visual Distinction: Each of these three data points (Highs, Lows, and Midpoints) is assigned a distinct color on the chart, allowing for clear visual organization and quick identification during live trading.
How it Works in Practice
Instead of looking at every single candle manually, the script automatically "scans" back from the current price to find the extremes. It then projects these levels onto your current chart as horizontal guides. This allows you to see, at a glance, where the most significant boundaries were established in recent history, assisting in the identification of potential reversal zones or breakout points.
#property indicator_chart_window
#property indicator_buffers 3
#property indicator_color1 Red
#property indicator_color2 Blue
#property indicator_color3 Gold
//--------------------------------------
extern int p=48;
extern bool SA=false;
extern bool SPR=false;
//--------------------------------------
double hh[],ll[],ss[];
double spr;
//*******************************************
int init()
{
   SetIndexBuffer(0,hh);
   SetIndexBuffer(1,ll);
   SetIndexBuffer(2,ss);
   return(0);
}
//*******************************************
int start()
{
   int cbi,IC=IndicatorCounted();
   if (Bars-IC<3) cbi=Bars-IC-1; else
   {
      if (SPR) spr=MarketInfo(Symbol(),MODE_SPREAD)*Point; else spr=0.0;
      cbi=Bars-p-1;
   }
   //------------------------------------
   for(int i=cbi; i>=0; i--)
   {
      hh[i]=High[iHighest(NULL,0,MODE_HIGH,p,i)]+spr;
      ll[i]=Low[iLowest(NULL,0,MODE_LOW,p,i)];
      if (SA) ss[i]=(hh[i]+ll[i])/2;
   }
   //------------------------------------
   return(0);
}
//********************************************
Comments