AntiAlligator
Indicator

AntiAlligator

iAlligator

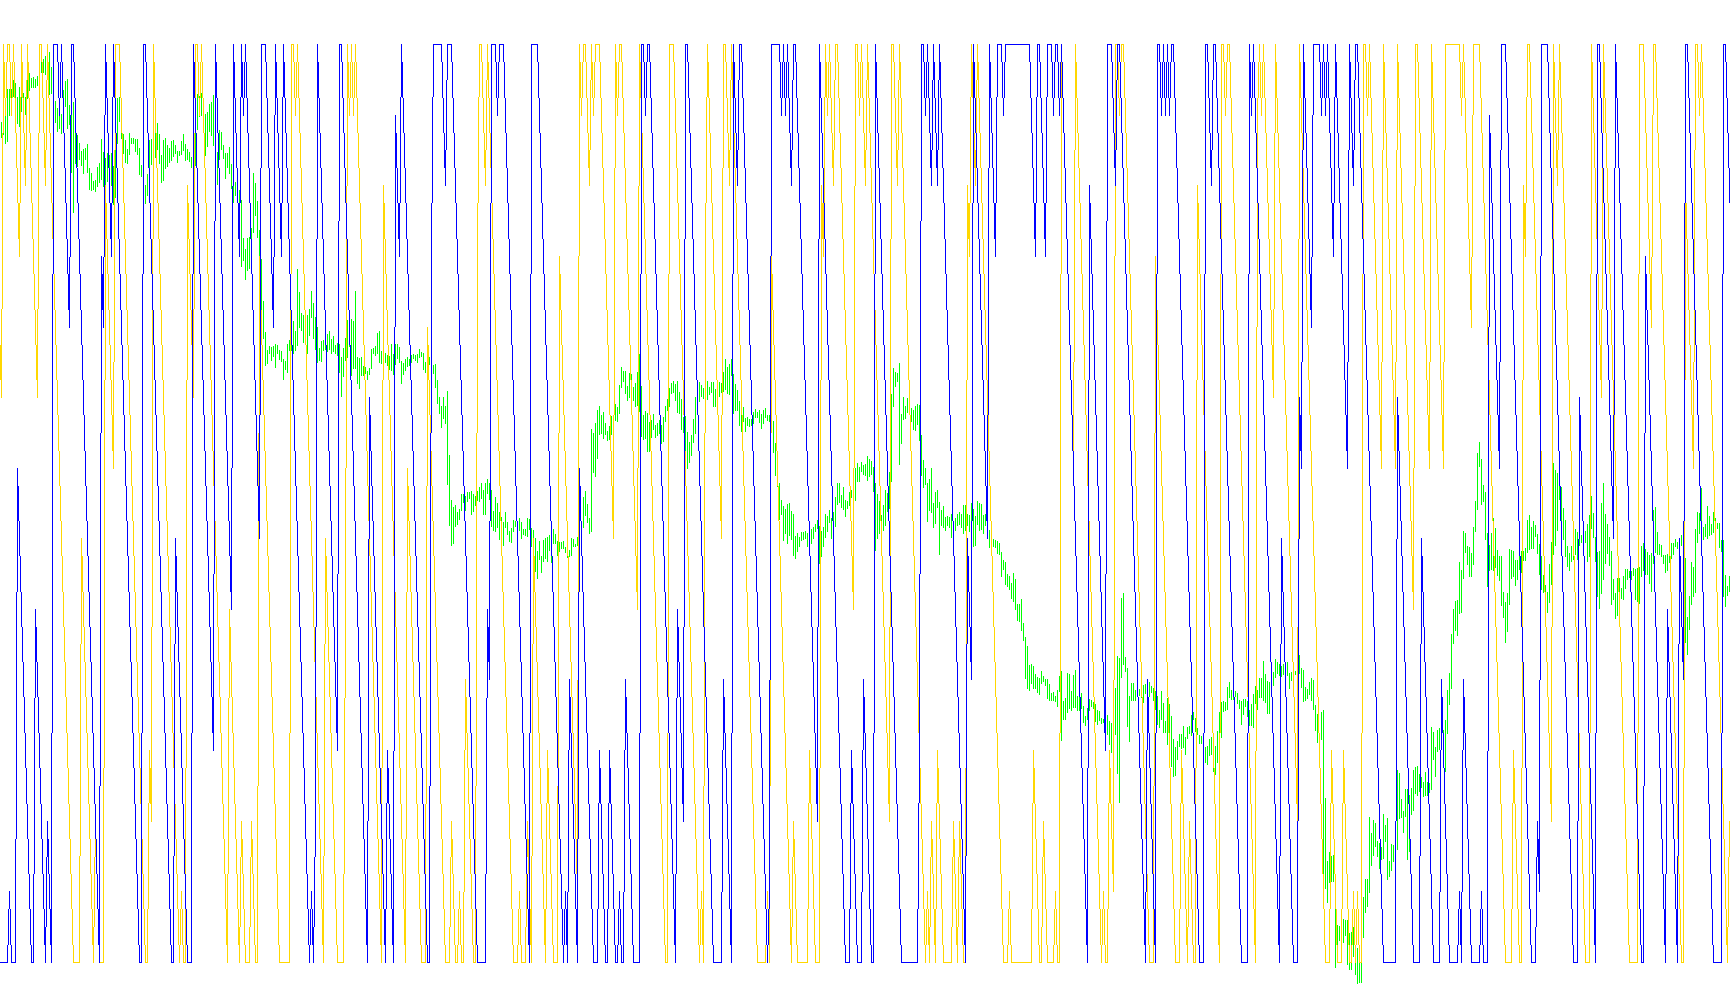
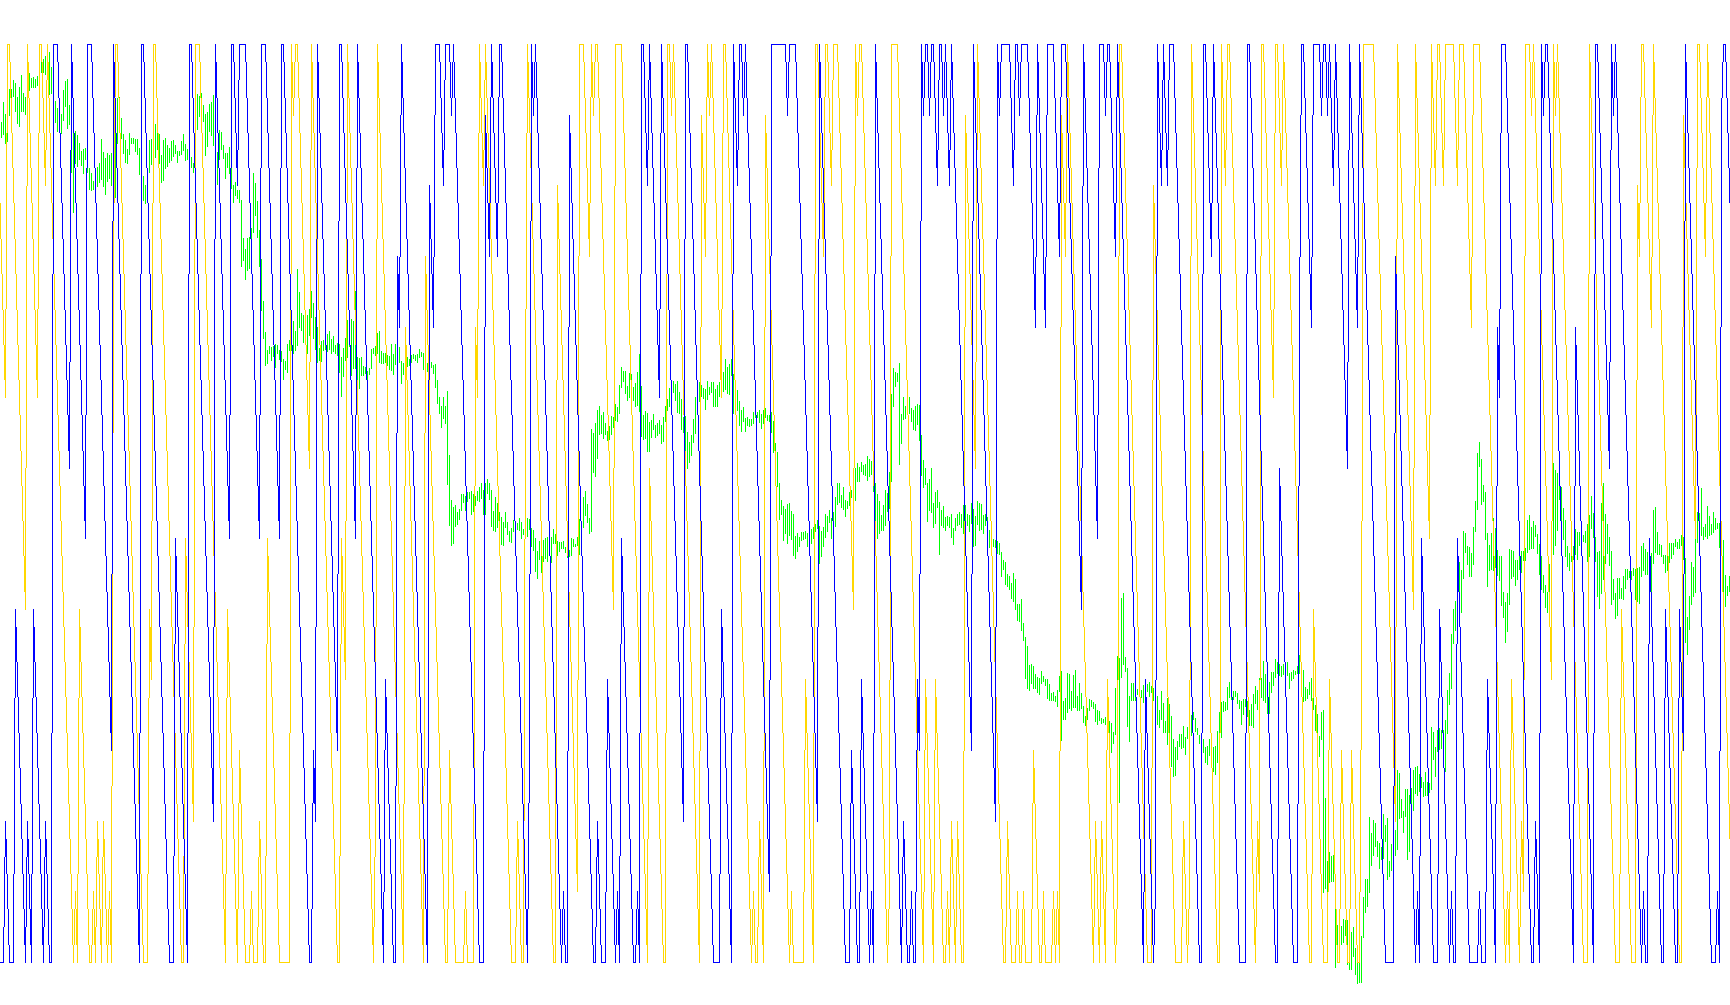
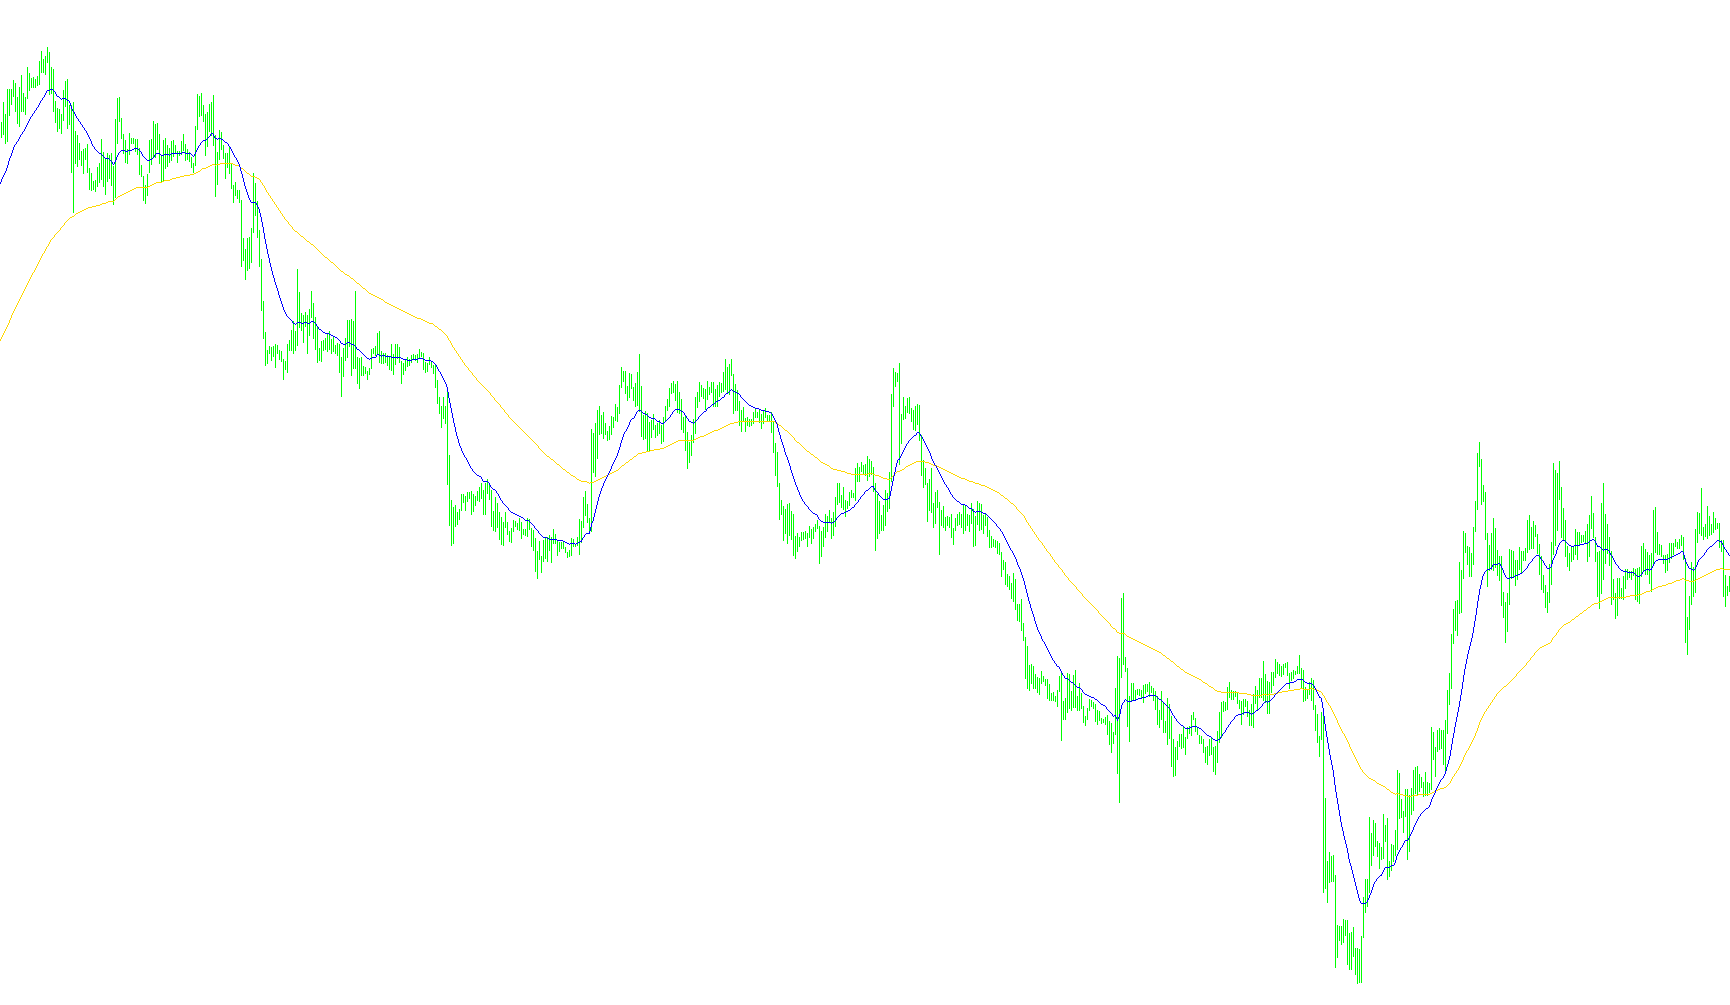
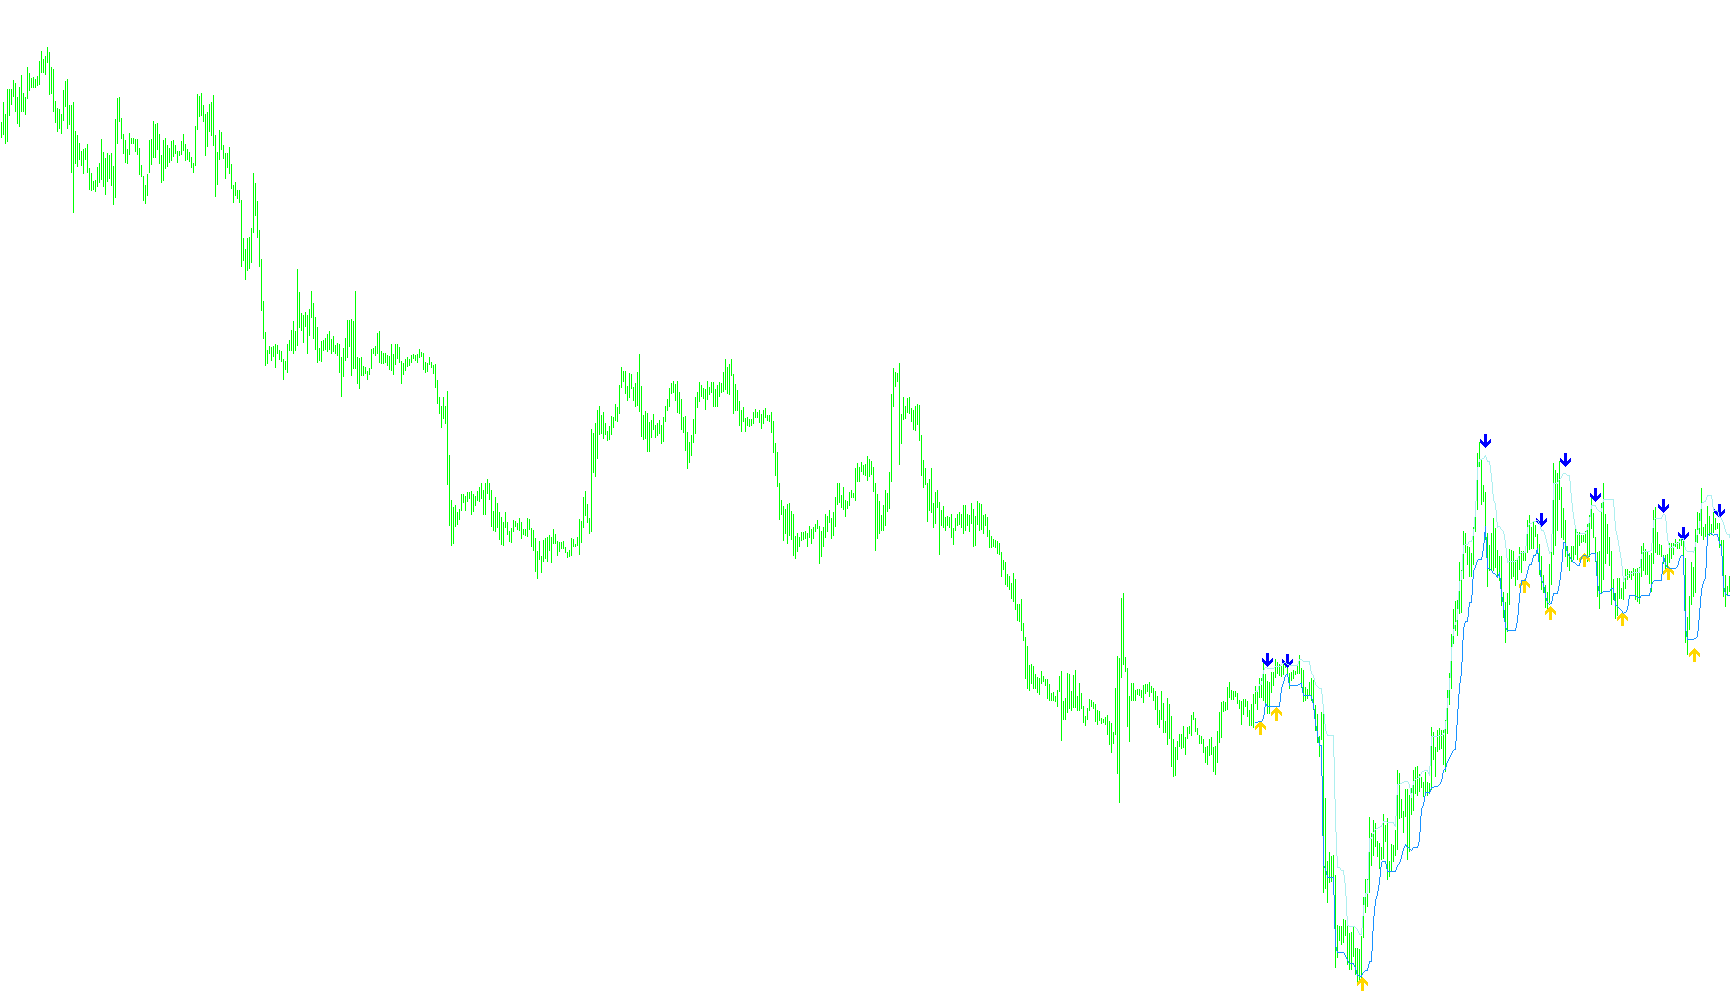
This indicator identifies trend exhaustion and price-action pivots by calculating the divergence between SMA-based Alligator components and previous candle mean price levels.

AnyMA_Rsi_R2_Indi_Opt
Indicator

AnyMA_Rsi_R2_Indi_Opt

iMAiMAOnArrayiRSI

This indicator identifies trend reversal entries by filtering Hull Moving Average momentum against progressive RSI velocity shifts and primary trend bias.

AO-AC(AM)
Indicator

AO-AC(AM)

iMAiMAOnArray

This indicator identifies trend exhaustion and momentum shifts by calculating the velocity differences between Accelerator and Decelerator oscillators using dual-period moving average offsets.

AO-Esp-MTF_v1.2
Indicator

AO-Esp-MTF_v1.2

iMA

This tool calculates the Awesome Oscillator across higher timeframes by measuring the differential between dual moving averages to identify trend reversals and momentum shifts.

AO2
Indicator

AO2

iMA

This indicator visualizes trend direction by calculating the difference between short and long moving averages across two distinct temporal scales, adjusted dynamically by timeframe magnification.

AO_alert
Indicator

AO_alert

iMA

This indicator identifies trend reversals by calculating the differential between 5 and 34 period moving averages and visualizing momentum shifts through dual-color histograms.

AO_Email Alerted
Indicator

AO_Email Alerted

iMAiMAOnArray

This indicator monitors the Awesome Oscillator for momentum shifts, triggering real-time alerts and emails upon zero-line crossovers and signal line intersections.

AO_FozzySignal
Indicator

AO_FozzySignal

iMAOnArrayiRSI

This indicator identifies bullish and bearish reversals by detecting momentum crossovers of a smoothed RSI relative to its own Bollinger Band envelope.

AO_FozzySignalALL
Indicator

AO_FozzySignalALL

iMAOnArrayiRSI

This indicator synthesizes Relative Strength Index dynamics with Bollinger Band volatility envelopes to generate precise momentum crossover signals and trend reversals.

AO_FozzySignal_BT
Indicator

AO_FozzySignal_BT

iMAOnArrayiRSI

This indicator identifies momentum shifts by calculating a Bollinger Band overlay on a smoothed Relative Strength Index to detect price exhaustion and crossovers.

AO_MFI_MA_Ron_01
Indicator

AO_MFI_MA_Ron_01

iAOiMFIiMA

This indicator identifies directional shifts by detecting simultaneous bullish momentum and high-volume flow synchronization alongside dual exponential moving average tracking.

AO_YestHiLo2Lot
Indicator

AO_YestHiLo2Lot

This indicator projects daily price boundaries and dynamic profit targets by calculating structural gaps between high and low extremes.

Arbitraz
Indicator

Arbitraz

This indicator calculates the real-time product of the closing prices between the GBPUSD and EURGBP currency pairs to visualize composite market dynamics.

Arbitraz_v1
Indicator

Arbitraz_v1

This indicator calculates and visualizes the instantaneous product of the closing prices of GBPUSD and EURGBP to highlight combined currency value dynamics.

Indicator

Aroon Up & Dn

Indicator

Aroon Bars

Indicator

Aroon Bars_v1

Aroon Horn
Indicator

Aroon Horn

This indicator quantifies the recency of price extremes by calculating the percentage of time elapsed since the highest and lowest peaks within a defined lookback window.

Aroon Horn_v1
Indicator

Aroon Horn_v1

This indicator quantifies the time-distance between current price extremes and their recent historical occurrences to measure trend strength and persistence.

Indicator

Aroon Oscilator

Aroon Oscilator_v1
Indicator

Aroon Oscilator_v1

This indicator quantifies price strength by calculating the ratio between period highs and lows, categorizing momentum into distinct visual zones based on a customizable threshold filter.

Aroon Oscilator_v1_2
Indicator

Aroon Oscilator_v1_2

This indicator quantifies price velocity by calculating the normalized variance between local highs and lows against a defined threshold filter to identify trend exhaustion.

Aroon Oscilator_v1_v1
Indicator

Aroon Oscilator_v1_v1

This indicator quantifies price range volatility by normalizing high and low extremes over a specific period and isolating momentum intensity through a multi-tier threshold filter.

Indicator

Aroon Oscilator_v2

Indicator

Aroon oscillator - arrows main chart

iATR
Indicator

Aroon oscillator

Indicator

Aroon Up & Dn

Aroon
Indicator

Aroon

Calculates the percentage of time elapsed since the highest and lowest price points over a rolling period to quantify trend velocity.

Aroon_Alert
Indicator

Aroon_Alert

This indicator quantifies the recency of structural highs and lows over a rolling window to identify trend exhaustion or acceleration.

Indicator

Aroon_Horn

Aroon_Horn2
Indicator

Aroon_Horn2

This indicator quantifies trend strength by measuring the proximity of recent price extremes to the current candle within a fixed lookback period.

Aroon_Horn2_v1
Indicator

Aroon_Horn2_v1

This indicator quantifies the velocity of price reaching new extremes by measuring the proximity of recent highs and lows relative to a defined historical window.

Aroon_Horn_Oscillator_v1
Indicator

Aroon_Horn_Oscillator_v1

This indicator quantifies price momentum by isolating the divergence between historical highs and lows into three distinct visual signals based on a specific filter threshold.

Aroon_Horn_Oscillator_v1_001
Indicator

Aroon_Horn_Oscillator_v1_001

This indicator quantifies trend velocity by calculating the percentage distance between period highs and lows, then isolating distinct bullish, bearish, and neutral phases via a volatility threshold.

Indicator

Aroon_Horn_v1

Aroon_Oscilator_v1
Indicator

Aroon_Oscilator_v1

This indicator quantifies price velocity by calculating a normalized oscillator based on extreme high and low reach within a specific period, then segregating the data into distinct visual buffers when it exceeds defined momentum thresholds.

Aroon_Oscillator_v1
Indicator

Aroon_Oscillator_v1

This indicator quantifies price strength by calculating the ratio between recent highs and lows, then segregating the resulting oscillator into three distinct zones based on a user-defined volatility filter.

Aroon_Up_Down
Indicator

Aroon_Up_Down

This indicator quantifies the recency of price extremes by calculating the temporal distance between current candles and the highest high or lowest low within a specified window to measure trend strength.

Indicator

Aroon_v1

Aroon_v1_2
Indicator

Aroon_v1_2

This indicator quantifies trend strength by measuring the proximity of recent highs and lows relative to a specific lookback window.

Aroon_v1_v1
Indicator

Aroon_v1_v1

Calculates relative price velocity by measuring the distance of recent high and low peaks from the current bar within a defined rolling window.

Aroon_v3
Indicator

Aroon_v3

This indicator quantifies the time elapsed since the highest and lowest price points occurred within a specific window to measure trend velocity and potential exhaustion.

Indicator

Aroon__Up_&_Dn

ArrayTest
Indicator

ArrayTest

iMA

This indicator visualizes the divergence between two distinct exponential moving averages to identify shifts in price velocity and trend acceleration.

ArrayTest_v1
Indicator

ArrayTest_v1

iMA

This indicator identifies trend shifts by calculating the divergence between a fast and slow exponential moving average to quantify price acceleration.

arrows&curves lucas1
Indicator

arrows&curves lucas1

This indicator identifies trend shifts by detecting price breaches of a dynamically calculated risk-adjusted volatility channel while simultaneously plotting Fibonacci-based support and resistance boundaries.

arrows_&_curves_v.28_lukas1
Indicator

arrows_&_curves_v.28_lukas1

This indicator identifies trend reversals and momentum shifts by monitoring price breakouts relative to dynamic high-low channels with multi-layered buffer zones.

arrows_&_curves_v14
Indicator

arrows_&_curves_v14

This indicator identifies trend reversals by detecting price breaches of a volatility-adjusted high and low boundary system calculated over a rolling period.

Indicator

ARROW_RSI-8_CROSS-55 45

iRSI
Indicator

ARROW_RSI-8_CROSS-55 45alarton

iRSI