ATFX_Breakout_Robot___Ver_1_Build_05
Indicator

ATFX_Breakout_Robot___Ver_1_Build_05

This expert advisor leverages an external DLL library to execute price breakout strategies governed by a time-sensitive security authentication layer.
ATM Machine Modified
Indicator

ATM Machine Modified

iCCI
ATM_4Sessions
Indicator

ATM_4Sessions

This indicator dynamically renders shaded background rectangles over specific historical time frames to highlight high-activity trading periods and identify price extremes within defined sessions.

ATM_BreakOut-asianBox
Indicator

ATM_BreakOut-asianBox

This indicator maps historical price action by plotting high-low boundaries and open-close levels for specific multi-period timeframes to identify structural breakout zones.

ATM_BreakOut-FrankfurtBox
Indicator

ATM_BreakOut-FrankfurtBox

This indicator identifies historical price boundaries and dynamic breakout zones by plotting high, low, open, and close rectangles across specific multi-day trading periods.

ATM_BreakOut-NYcloseBox
Indicator

ATM_BreakOut-NYcloseBox

Visualizes historical price extremes and open/close levels across specific time windows to identify breakout zones and volatility shifts.

ATM_BreakOut_BOX_5
Indicator

ATM_BreakOut_BOX_5

This indicator dynamically projects historical high-low boundaries and open-close price levels across specific chronological windows to identify structural break-out zones.

ATM_DualBollingerBands
Indicator

ATM_DualBollingerBands

iMA

This indicator projects two distinct sets of volatility boundaries using independent standard deviation multipliers over a primary simple moving average base.

ATM_HiLoXTF
Indicator

ATM_HiLoXTF

This indicator dynamically plots the high, low, and median price levels of specific multi-hour intervals to identify volatility boundaries and breakout opportunities.

ATM_LRCpath
Indicator

ATM_LRCpath

iStdDev

This indicator employs a Gauss elimination matrix to calculate a high-order polynomial regression curve that maps price trajectory dynamics and projects dynamic volatility envelopes.

ATM_MAdot
Indicator

ATM_MAdot

This indicator calculates and visualizes four distinct types of moving averages—Simple, Exponential, Smoothed, and Linear Weighted—using closing prices to identify underlying price trends.

ATM_maHPF
Indicator

ATM_maHPF

iMAiMAOnArray

This indicator synthesizes multiple advanced moving average types—including Hull, Jurik, and T3—with a cross-over logic that triggers visual signals based on price deviations from a step-calculated mean.

ATM_maLPF
Indicator

ATM_maLPF

iMAiMAOnArray

This indicator identifies momentum shifts by comparing a customizable moving average—ranging from SMA to Jurik and Hull—against its own localized average over a defined step period.

ATM_OHMLC
Indicator

ATM_OHMLC

This indicator projects significant price levels including daily opens, yesterday's extremes, and calculated support and resistance based on previous session volatility.

ATM_Pure_RSI_Alert
Indicator

ATM_Pure_RSI_Alert

iRSI

This indicator triggers real-time visual and audible notifications when the Relative Strength Index breaches predefined overbought and oversold price action extremes.

ATM_Pure_WPR_Alert_v2
Indicator

ATM_Pure_WPR_Alert_v2

This indicator monitors the Williams %R oscillator to trigger visual markers and real-time notifications when price action reaches specific overbought or oversold thresholds.

ATM_Regular_News_Times
Indicator

ATM_Regular_News_Times

Visually demarcates key global market sessions on the chart by identifying high and low price extremes between specific temporal boundaries.

ATM_RSI_LiDo
Indicator

ATM_RSI_LiDo

iRSI

A dual-layered Relative Strength Index visualizer that maps smoothed price velocity against multi-tiered threshold zones to identify overextended market conditions.

ATM_SessionsGMT+2
Indicator

ATM_SessionsGMT+2

Visually delineates specific trading windows by projecting historical high and low boundaries across customizable time blocks.

ATM_ShowTime
Indicator

ATM_ShowTime

This indicator calculates and displays the precise remaining minutes until the current price bar completes based on real-time clock synchronization.

ATM_TLineAudioFallingAlert
Indicator

ATM_TLineAudioFallingAlert

This indicator monitors the real-time distance between current market pricing and a dynamic trendline to trigger an audible notification when price enters a specified pip threshold.

ATM_TLineAudioFallingAlert_v1
Indicator

ATM_TLineAudioFallingAlert_v1

This indicator monitors real-time price interaction with a dynamic downward trendline, triggering an audible alert when the market rate enters a specified pip range of the line.

ATM_TLineAudioRisingAlert
Indicator

ATM_TLineAudioRisingAlert

This indicator monitors real-time price action against a dynamically projected trendline and triggers audible or email notifications when market volatility enters a specified pip range.

ATM_TLineAudioRisingAlert_v1
Indicator

ATM_TLineAudioRisingAlert_v1

Triggers real-time audio and email notifications when market price enters a predefined pip range relative to a projected ascending trendline.

Indicator

ATM_TSRdata

iMA
ATM_XpMA
Indicator

ATM_XpMA

iMAiMAOnArray

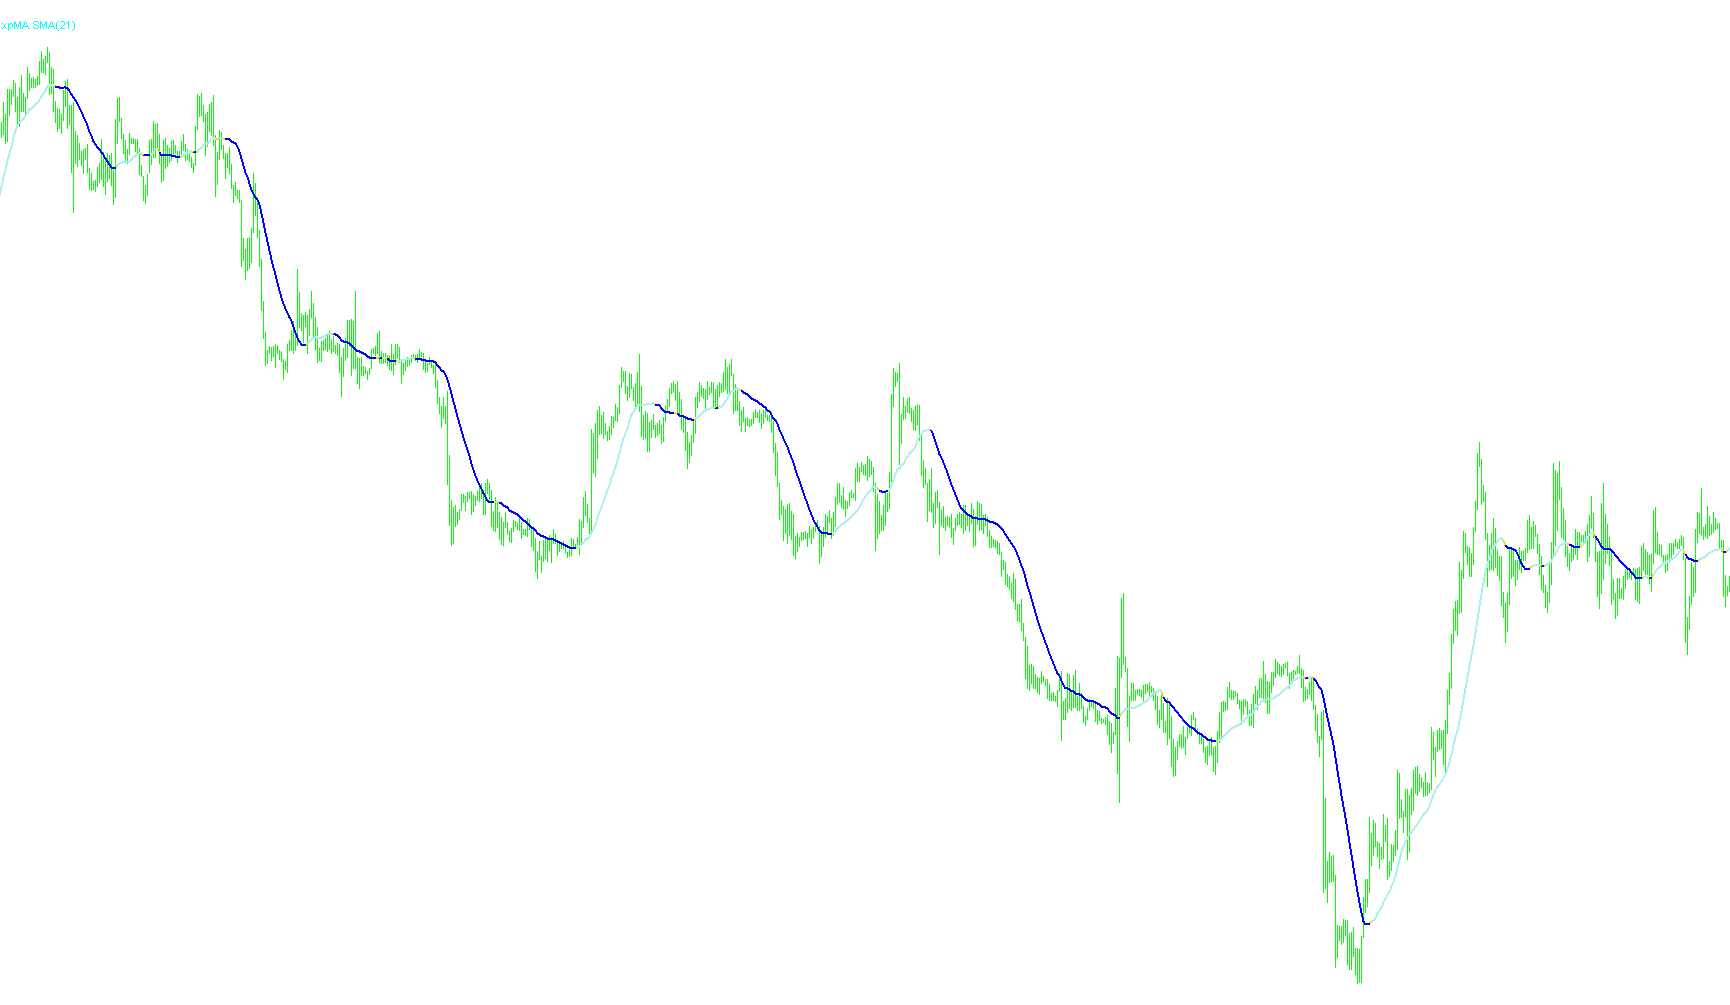
This indicator synthesizes multiple advanced moving average types with a dynamic look-back filter to generate directional trade signals via arrow markers and alerts.

ATM_xpMAv10bVS_25LWMAmedian
Indicator

ATM_xpMAv10bVS_25LWMAmedian

iMAiMAOnArray

This indicator identifies trend shifts by comparing a customizable moving average against a smoothed local mean to generate directional signals and price breach alerts.

ATR Channels
Indicator

ATR Channels

iATRiMA

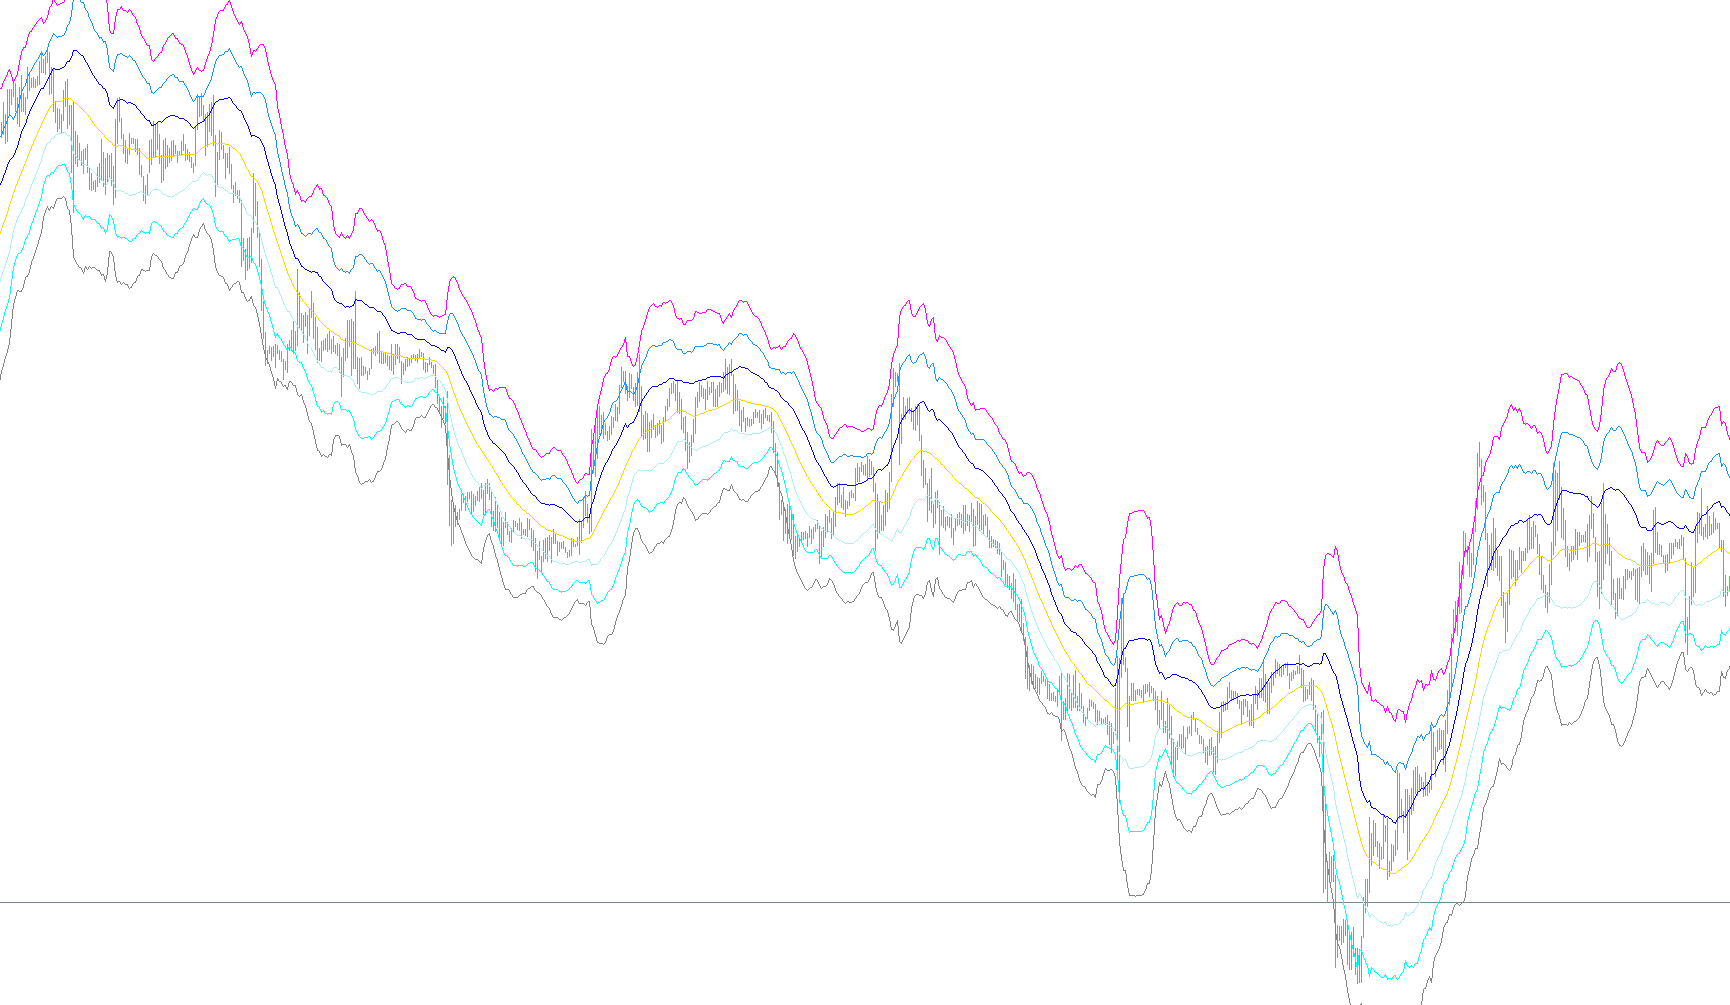
This indicator projects three distinct dynamic price bands based on linear weighted moving averages and multiple ATR multipliers to visualize market volatility extremes.

ATR Channels_v1
Indicator

ATR Channels_v1

iATRiMA

This indicator overlays a central moving average with three distinct volatility bands calculated by projecting multiple ATR multipliers to identify price extremes.

ATR Channels_v2
Indicator

ATR Channels_v2

iATRiMA

This indicator plots a dynamic central moving average flanked by three distinct tiers of ATR-based volatility bands to visualize price expansion and contraction.

ATR CountBack
Indicator

ATR CountBack

iMAOnArray

This indicator calculates the Average True Range by aggregating price extremes across specific historical offsets and higher timeframe dimensions to measure latent market volatility.

ATR Darma
Indicator

ATR Darma

iATRiMAOnArray

This indicator calculates the average true range and overlays a secondary moving average to identify smoothed volatility trends and fluctuations.

ATR Levels custom
Indicator

ATR Levels custom

iATR

This indicator projects dynamic horizontal support and resistance levels by calculating Average True Range offsets from previous daily high, low, and temporal price data.

ATR Levels
Indicator

ATR Levels

iATR

This indicator calculates and plots horizontal support and resistance levels based on daily Average True Range (ATR) deviations relative to previous day's high and low price action.

Indicator

ATR Levels2

iATR
Indicator

ATR Levels4

iATR
ATR Levels_v1
Indicator

ATR Levels_v1

iATR

This indicator calculates dynamic support and resistance levels by projecting Average True Range values onto daily price data to identify key volatility boundaries.

ATR MA Oscillator
Indicator

ATR MA Oscillator

iMAOnArray

This indicator quantifies volatility dynamics by calculating the differential between a primary Average True Range mean and its secondary smoothing signal line.

ATR ratio
Indicator

ATR ratio

iATR

This indicator quantifies relative market turbulence by calculating the quotient of a short-term Average True Range against a long-term Average True Range to identify expansion or contraction phases.

ATR ratio_v1
Indicator

ATR ratio_v1

iATR

Quantifies relative price expansion by calculating the quotient of a short-term Average True Range against a long-term baseline to identify volatility spikes.

ATR-MQLS
Indicator

ATR-MQLS

iMAOnArray

This indicator calculates separate Simple Moving Average smoothing for bullish and bearish price ranges to visualize directional volatility dynamics.

ATR
Indicator

ATR

iMAOnArray

This indicator quantifies market turbulence by calculating the mean distance between price extremes and previous closing values over a rolling temporal window.

ATRStops_v1.1
Indicator

ATRStops_v1.1

iATR

This algorithm identifies trend direction by calculating rolling volatility envelopes based on Average True Range and locks the trailing support or resistance levels to prevent premature exit signals.

ATRStops_v1.1_001
Indicator

ATRStops_v1.1_001

iATR

The algorithm identifies market direction by tracking price breakouts relative to high and low extremes modified by a dynamic Average True Range multiplier.

Indicator

ATRstops_v1.1_MTF

Indicator

ATRStops_v11.1 + alert

iATR
ATRStops_v11.1
Indicator

ATRStops_v11.1

iATR

This indicator identifies trend shifts by evaluating price breaches of volatility-weighted boundaries derived from Average True Range extremes.

ATRStops_v1[1][1].1
Indicator

ATRStops_v1[1][1].1

iATR

This indicator identifies structural trend shifts by calculating price boundaries based on the Average True Range and maintaining non-decreasing floor levels for bullish trends or non-increasing ceiling levels for bearish moves.

Atr_3v1_3
Indicator

Atr_3v1_3

iATR

This indicator identifies high-intensity market activity by correlating relative Average True Range expansions with normalized volume spikes to highlight significant price momentum shifts.

Atr_3v1_3_time
Indicator

Atr_3v1_3_time

iATR

This indicator identifies market anomalies by calculating the ratio of instantaneous Average True Range and trading volume against historical hourly averages to detect significant price action intensity.