Atr_3v1_4
Indicator

Atr_3v1_4

iATR

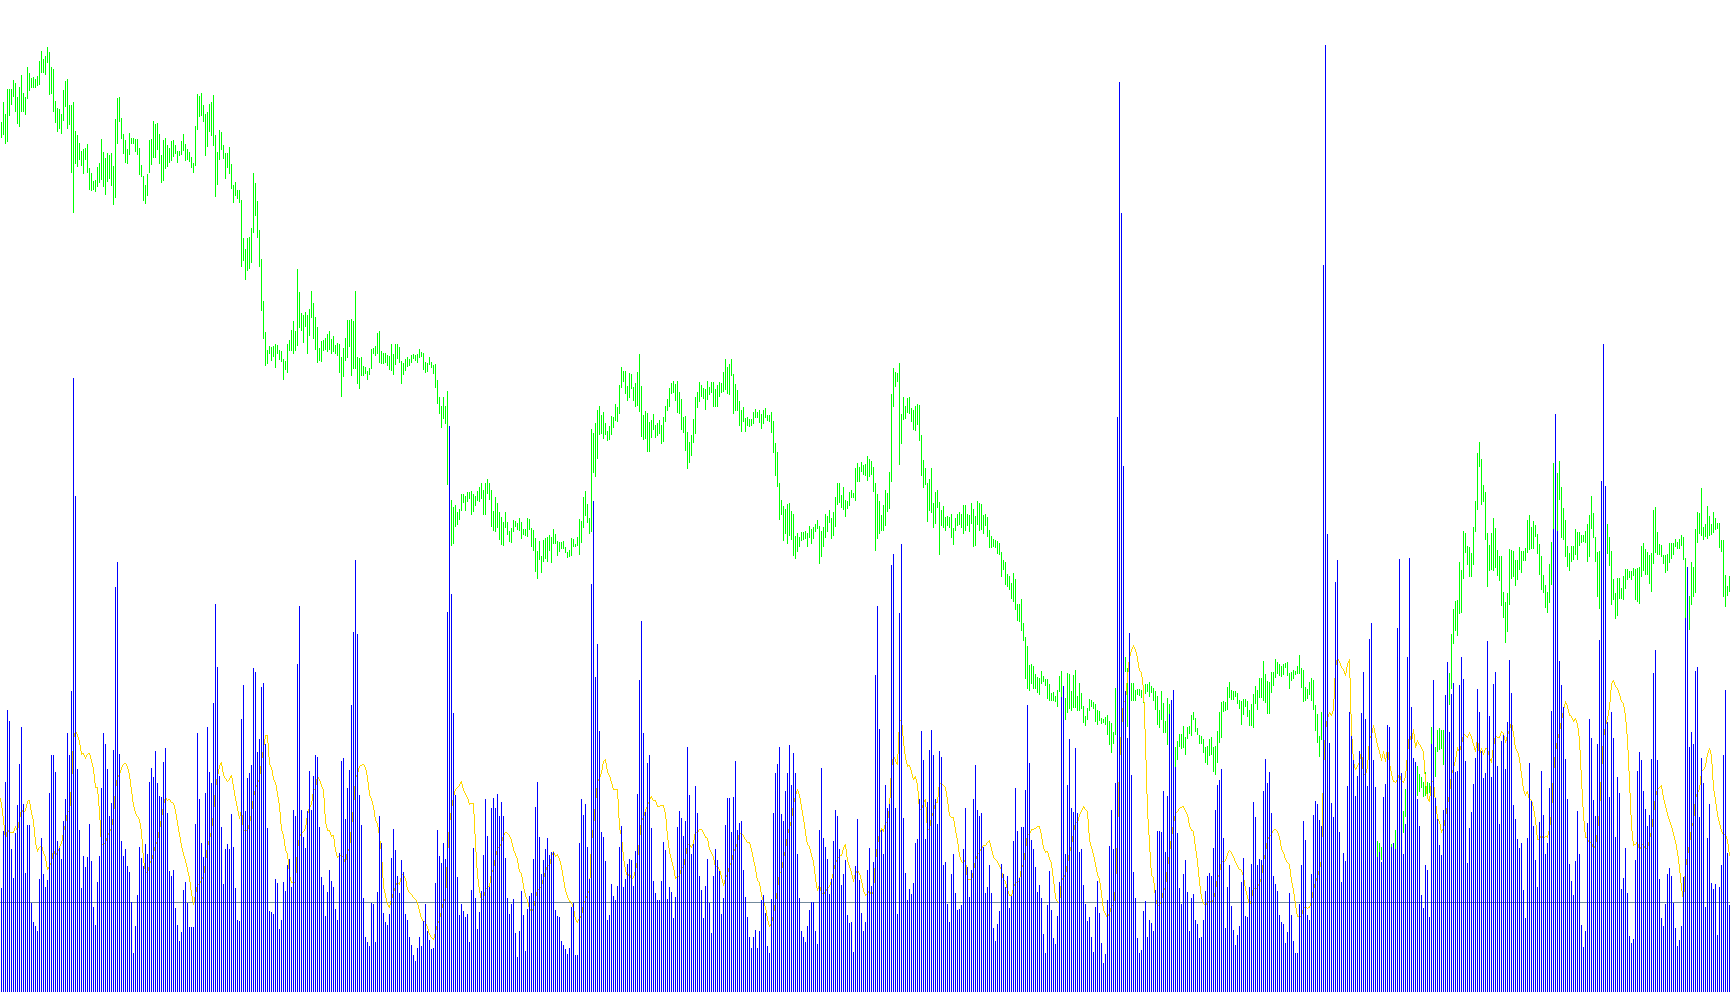
This indicator quantifies the relationship between normalized relative volume and localized average true range to identify momentum shifts and price exhaustion.

ATR_Bands
Indicator

ATR_Bands

iATRiMA

This indicator constructs self-adjusting bands by superimposing a multiplier of the Average True Range onto an Exponential Moving Average to visualize price extremes based on current market variance.

ATR_Channels
Indicator

ATR_Channels

iATRiMA

This indicator plots a central linear weighted moving average flanked by three distinct sets of expansion bands calculated via variable Average True Range multipliers.

ATR_Channels_VarTFs_mtf
Indicator

ATR_Channels_VarTFs_mtf

iATRiMA

This indicator projects triple volatility bands and a moving average by calculating Average True Range from higher timeframes relative to a secondary base timeframe.

ATR_Channels_VarTFs_mtf_TMA
Indicator

ATR_Channels_VarTFs_mtf_TMA

iATR

This indicator projects three nested volatility channels based on ATR variance and a centered moving average across multiple timeframes to visualize price expansion limits.

ATR_Chart_Daily
Indicator

ATR_Chart_Daily

iATR

This indicator extracts and displays the current and previous Average True Range values from the daily timeframe directly onto the chart as text objects.

ATR_Chart_Labeled
Indicator

ATR_Chart_Labeled

iMAOnArray

This indicator calculates and displays the smoothed Average True Range alongside real-time text labels to monitor current and previous volatility levels.

ATR_Levels
Indicator

ATR_Levels

iATR

The indicator projects horizontal support and resistance levels by anchoring daily price extremes with ATR-based volatility offsets across different timeframes.

ATR_ratio
Indicator

ATR_ratio

iATR

Quantifies the relative magnitude of short-term price fluctuation against long-term variance to identify expansion phases.

ATR_Ratio_v1
Indicator

ATR_Ratio_v1

iATRiMAOnArray

This indicator calculates the relative ratio between a fast and slow Average True Range to identify momentum shifts in market volatility dynamics.

ATR_Ratio_v1a
Indicator

ATR_Ratio_v1a

iATRiMAOnArray

This indicator quantifies relative market turbulence by calculating the ratio between a fast and slow Average True Range, smoothed through a moving average to identify shifting volatility dynamics.

ATR_Ratio_v2
Indicator

ATR_Ratio_v2

iATRiStdDevOnArray

This indicator quantifies relative volatility dynamics by calculating the ratio between fast and slow Average True Range values, supplemented by a secondary standard deviation variance analysis.

ATR_Separate_Labeled
Indicator

ATR_Separate_Labeled

iMAOnArray

This indicator calculates the Average True Range and projects it onto a separate sub-window while displaying real-time current and previous period volatility values as on-chart text labels.

ATR_SL_CHANEL
Indicator

ATR_SL_CHANEL

iATR

This indicator dynamically constructs upper and lower price boundaries by calculating the distance from the 10-period extreme price points using a multiplier of the Average True Range.

ATR_x2
Indicator

ATR_x2

iMAOnArray

Quantifies market price fluctuations by calculating a smoothed moving average of the maximum distance between high-low ranges and previous closing prices.

ATR_x2LHist_mtf
Indicator

ATR_x2LHist_mtf

iATR
ATR_x3LHist_mtf
Indicator

ATR_x3LHist_mtf

iATR

This indicator overlays three distinct Average True Range values across specified timeframes to visualize historical price expansion and volatility dynamics simultaneously.

Indicator

Attrib1

iMA
Indicator

Attrib2

iMA
Indicator

Attrib2a

iMA
Indicator

Attrib2b

iMA
Indicator

Attrib2_001

iMA
Indicator

Attrib3

iMA
Indicator

Attrib3a

iMA
Indicator

Attrib3b

iMA
Indicator

Attrib4

iMA
Indicator

Attrib4a

iMA
Indicator

Attrib4b

iMA
Indicator

AttribInd_2d

iMA
Indicator

AttribInd_2e

iMA
Indicator

AttribInd_3d

iMA
Indicator

AttribInd_3e

iMA
Indicator

AttribInd_3e_1

iMA
Indicator

AttribInd_4d

iMA
Indicator

AttribInd_4e

iMA
Attrib_to_File2_AUDUSD
Indicator

Attrib_to_File2_AUDUSD

iMA

This script iterates through a predefined array of currency pairs to extract and export synchronized Moving Average values across multiple timeframes into a structured CSV file.

Attrib_to_File2_EURCHF
Indicator

Attrib_to_File2_EURCHF

iMA

This script iterates through specified assets to extract and log historical price data alongside SMA values across multiple timeframes into a CSV file.

Attrib_to_File2_EURJPY
Indicator

Attrib_to_File2_EURJPY

iMA

Iterates through specified currency symbols to extract historical price data and multi-period Simple Moving Average values, recording them into localized CSV files.

Attrib_to_File2_GBPUSD
Indicator

Attrib_to_File2_GBPUSD

iMA

This script iterates through predefined currency pairs to extract and export historical price action and various Simple Moving Average values across M1, M5, H1, and H4 timeframes into a structured CSV file.

Attrib_to_File3_EURUSD
Indicator

Attrib_to_File3_EURUSD

iMA

Extracts and synchronizes Simple Moving Average values across multiple timeframes into a structured CSV file based on historical price points.

Attrib_to_File4_EURUSD
Indicator

Attrib_to_File4_EURUSD

iMA

This script extracts and saves historical price data alongside the arithmetic differences between multiple Simple Moving Averages across 5-minute, 1-hour, and 4-hour timeframes into a CSV file.

at_Itp4
Indicator

at_Itp4

The algorithm employs a recursive midpoint averaging technique combined with Lagrange polynomial interpolation to synthesize continuous price trajectories across discrete time intervals.

at_Itp4_Env
Indicator

at_Itp4_Env

This indicator constructs a smooth price path using quadratic interpolation across multi-period segments to generate dynamic upper and lower volatility boundaries.

at_Itp4_Env_v1
Indicator

at_Itp4_Env_v1

This indicator generates a smoothed price boundary by applying Lagrange polynomial interpolation to filtered price data to create dynamic upper and lower volatility channels.

at_ZDn
Indicator

at_ZDn

This indicator calculates a hybrid price trajectory by averaging a forward-recursive exponential moving average with a backward-reconstructed trendline to identify structural pivot points.

at_ZDnsw
Indicator

at_ZDnsw

This indicator utilizes a nested recursive EMA calculation to identify and project structural pivot points by detecting localized price reversals.

AudioAlerts20090201
Indicator

AudioAlerts20090201

iMACDiMAiStochastic

This indicator executes multi-factor confluence logic by synchronizing MACD trend shifts, Stochastic oscillator thresholds, and dual Exponential Moving Average crossovers to trigger precise entry alerts.

Indicator

AudioPrice

Indicator

AudioPrice_v1

Auto Fibo_Coodonates
Indicator

Auto Fibo_Coodonates

This indicator automatically projects Fibonacci retracement levels by identifying the highest and lowest price extremes over a user-defined rolling temporal window.