ASCTrendK_v1
Download script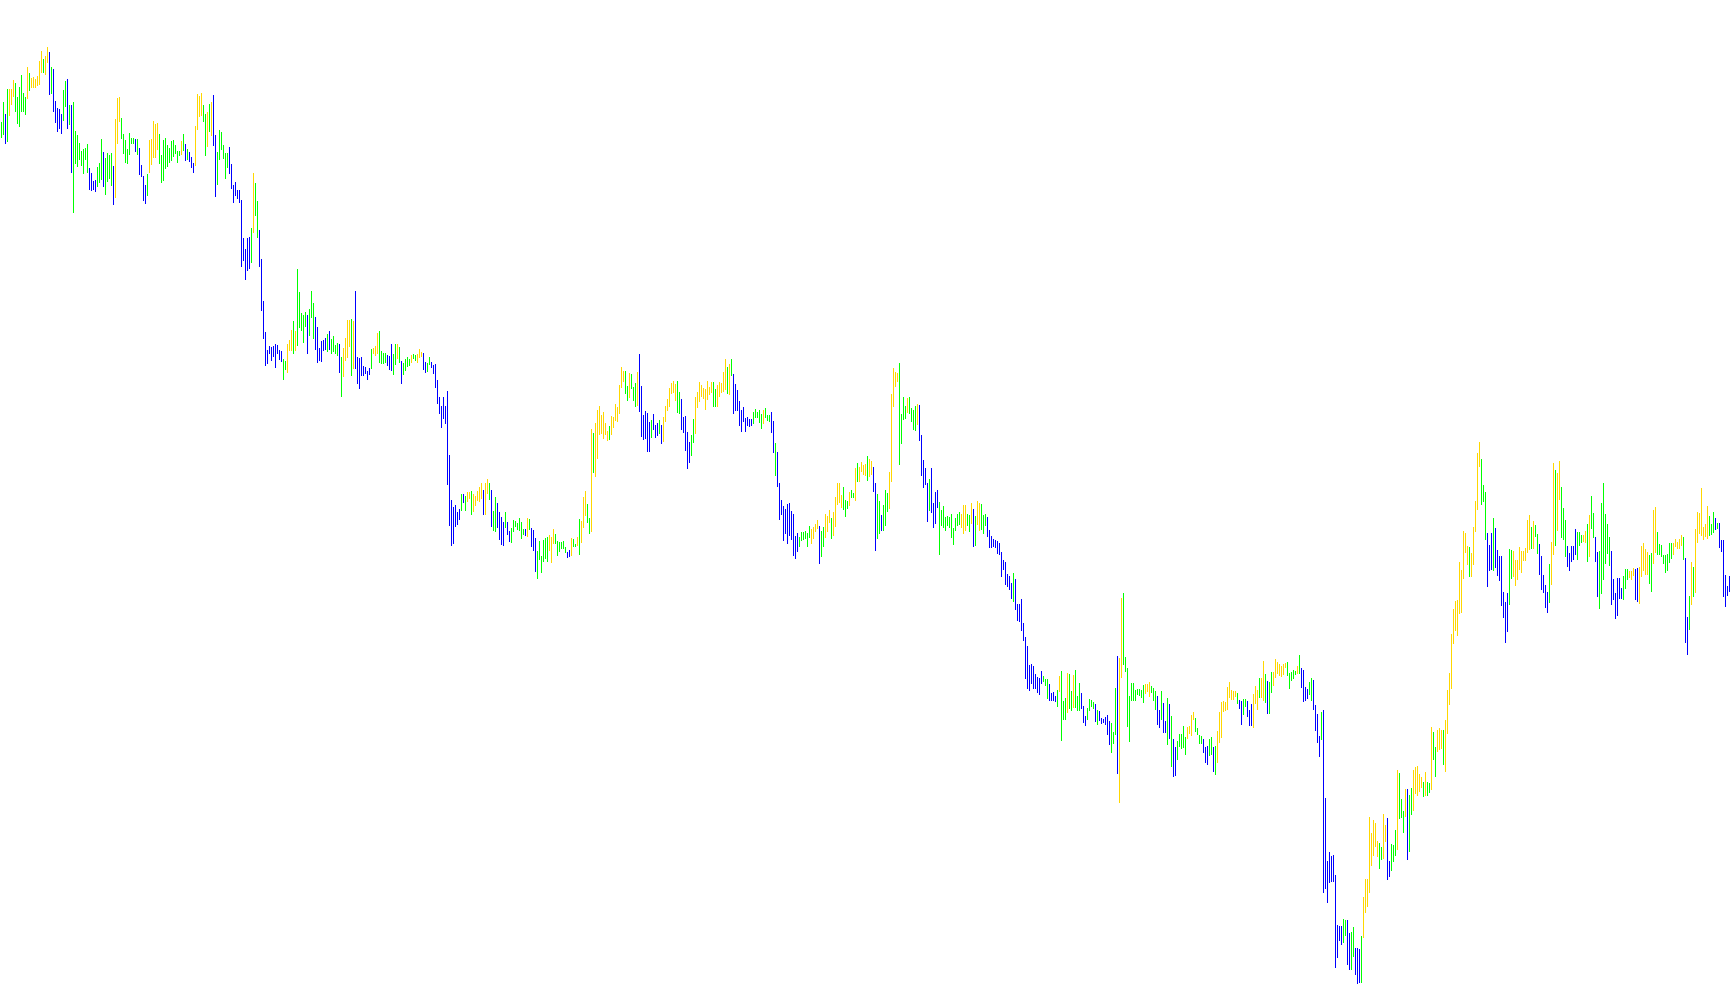
The ASCTrend1 indicator is designed to provide a visual representation of market momentum and trend direction by analyzing price fluctuations over specific timeframes. Rather than relying on simple moving averages, it employs a sophisticated logic that evaluates the volatility and strength of price movements to determine whether the current market behavior is bullish or bearish.
Core Logic and Methodology
The tool functions by processing historical price data—specifically looking at the highs, lows, and closing prices over the last several candles—to establish a baseline for "normal" market activity. It calculates an average range of price movement within a 10-bar window; this serves as a yardstick to measure whether current price changes are significant or just standard noise.
Dynamic Adaptability
A key feature of this script is its ability to adjust its sensitivity based on the intensity of the market:
- Volatility Detection: The script monitors for sudden, large gaps in price movement. If it detects a jump that is double the average range, it automatically tightens its parameters to react more quickly to the change.
- Momentum Scaling: It also checks for sustained price trends over a shorter window. If a significant move is detected (nearly five times the average range), it further adjusts its internal period settings. This ensures that the indicator remains responsive during fast-moving "breakout" periods while staying stable during slow, consolidating markets.
Trend Identification
The tool uses a weighted calculation to generate a momentum value. It compares this value against specific thresholds (defined by a user-adjustable risk factor) to categorize the trend:
- Bullish Bias: When the calculated momentum falls below a specific lower threshold, the indicator identifies an upward trend.
- Bearish Bias: When the momentum rises above a specific upper threshold, it identifies a downward trend.
Visual Output
The results are presented on your chart as two distinct histograms: one for the "Trend Up" and one for the "Trend Down." By monitoring these visual cues, users can see at a glance whether the current market pressure is leaning toward a rise or a fall, allowing for a clearer understanding of the prevailing market sentiment based on both historical average volatility and real-time momentum shifts.
/*-----------------------------+
|			       |
| Shared by www.Aptrafx.com    |
|			       |
+------------------------------*/

//+------------------------------------------------------------------+
//|                                                    ASCTrend1.mq4 |
//|                                              thanks to komposter |C0Rpus - big thanks CHANGE2002, STEPAN and SERSH
//|                                             komposterius@mail.ru |
//+------------------------------------------------------------------+
#property copyright "thanks to komposter"
#property link      "komposterius@mail.ru"

#property indicator_chart_window
#property indicator_buffers 2
#property indicator_color1 Lime
#property indicator_color2 Red

extern double RISK = 3;

double buf0[]; //ASC_Trend_Up
double buf1[]; //ASC_Trend_Down

int init()
{
	IndicatorShortName( "ASCTrend1" );
	IndicatorDigits ( MarketInfo( Symbol(), MODE_DIGITS ) );

	SetIndexBuffer( 0 , buf0 );
	SetIndexStyle ( 0 , DRAW_HISTOGRAM );
	SetIndexDrawBegin( 0 , 12 );
	SetIndexLabel( 0 , "ASC_Trend_Up");

	SetIndexBuffer( 1 , buf1 );
	SetIndexStyle ( 1 , DRAW_HISTOGRAM );
	SetIndexDrawBegin( 1 , 12 );
	SetIndexLabel( 1 , "ASC_Trend_Down");

return(0);
}

int start()
{
	int counted_bars=IndicatorCounted();
	if ( Bars <= 100 ) return(-1);
	if ( counted_bars < 0 ) return(-1);
	if ( counted_bars > 0 ) counted_bars -- ;

   int limit = Bars - 12;
   if ( counted_bars > 0 ) { limit = Bars - counted_bars - 12; }

	double x1 = 67 + RISK, x2 = 33 - RISK;
	for ( int i = limit; i >= 0; i -- )
	{
		double ASC_Trend_Up = 0, ASC_Trend_Down = 0, SummRange = 0, AvgRange = 0;

		for ( int u = i + 9; u >= i; u -- )
		{ SummRange += High[u] - Low[u]; }
		AvgRange = SummRange / 10;

		int WprPeriod = 3 + RISK * 2;

		for ( u = i + 9; u >= i; u -- )
		{
			if ( MathAbs( Open[u] - Close[u+1] ) >= AvgRange * 2 )
			{ WprPeriod = 3; break; }
		}

		for ( u = i + 6; u >= i; u -- )
		{
			if ( MathAbs( Close[u+3] - Close[u] ) >= AvgRange * 4.6 )
			{ WprPeriod = 4; break; }
		}

		double WprAbs = 100 + iWPR( Symbol(), 0, WprPeriod, i );

		if ( WprAbs < x2 )
		{
			ASC_Trend_Up=Low[i];
			ASC_Trend_Down=High[i];
		}
		if ( WprAbs > x1 )
		{
			ASC_Trend_Down=Low[i];
			ASC_Trend_Up=High[i];
		}

		buf0[i] = ASC_Trend_Up;
		buf1[i] = ASC_Trend_Down;
	}
return(0);
}

int deinit()
{
return(0);
}
Comments