Ask_Shadow_v2
Download script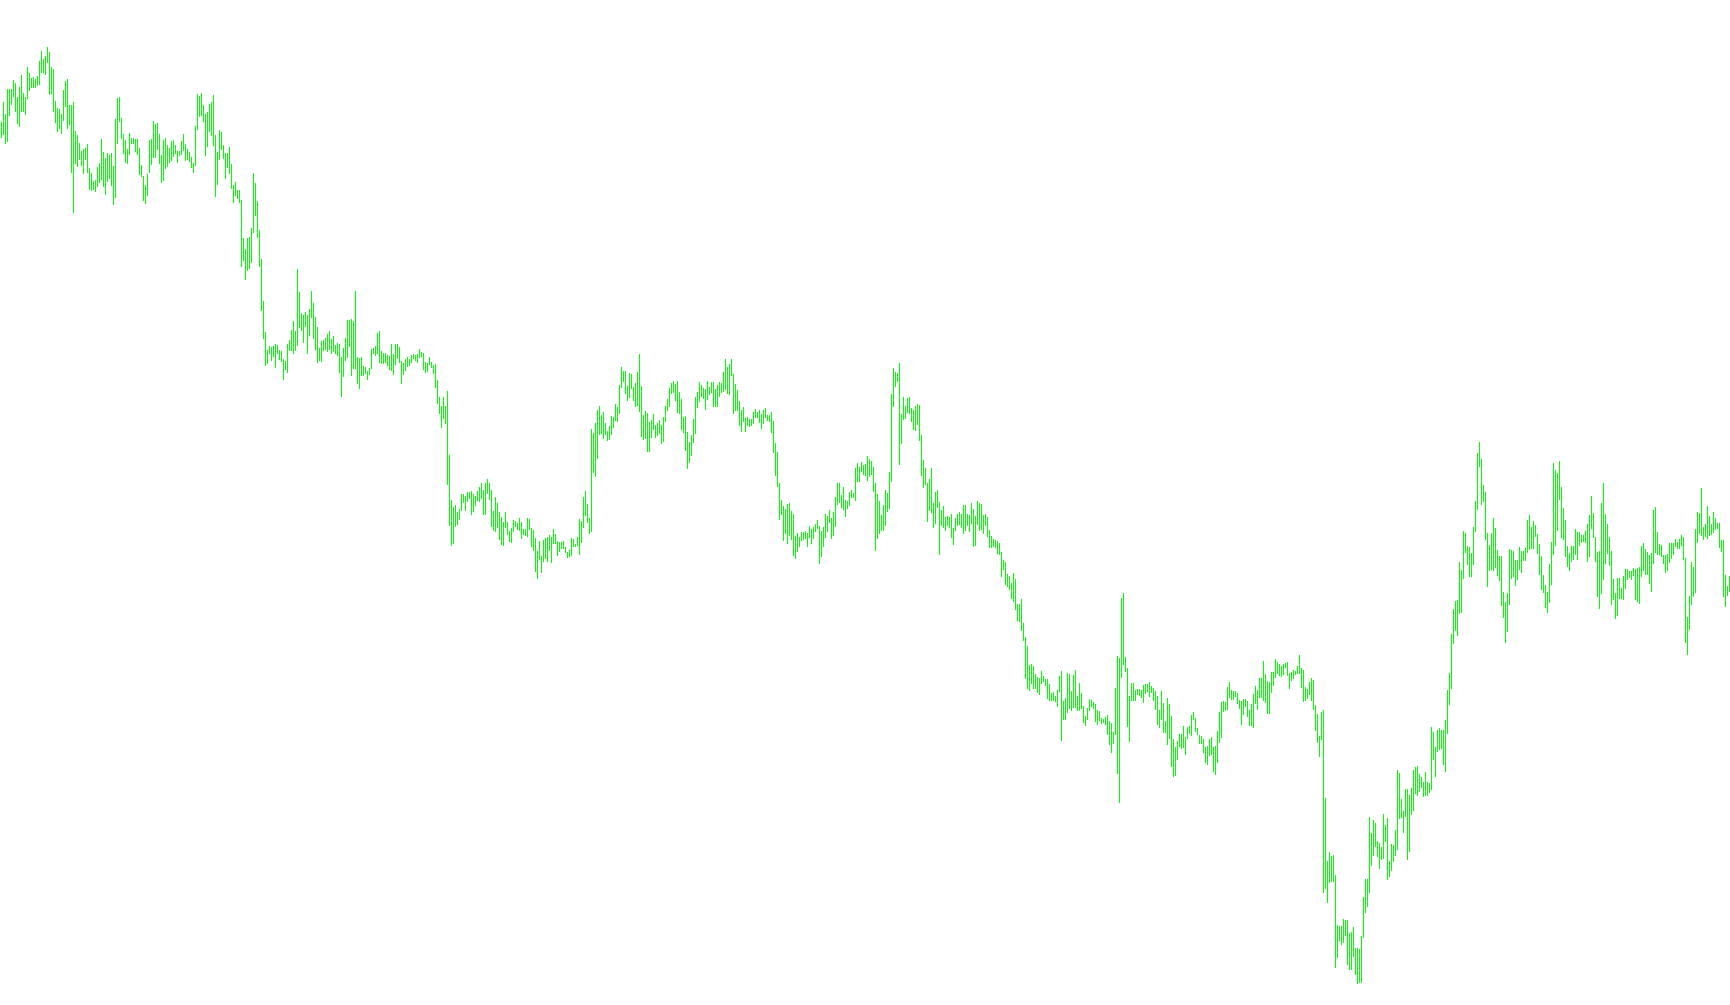
This tool is designed to provide traders with a visual representation of price levels adjusted for the "spread"—the difference between the asking price and the bidding price in the financial markets.
Core Logic Overview
The primary purpose of this script is to illustrate the discrepancy between what a trader sees on a standard chart and the actual price at which a trade can be executed. In most trading platforms, the visual high of a candle represents a specific price point; however, because of the spread, the "real" price accessible to a buyer is often slightly higher than what is displayed.
How it Works
The script performs a continuous calculation across every candle on your chart by following these steps:
- Spread Detection: The tool automatically calculates the current "spread" (the gap between the Ask and Bid prices) in real-time.
- Price Mapping: For every historical and current candle, it identifies the highest price reached (the "High").
- Dynamic Adjustment: It then takes that high price and adds the value of the current spread to it.
- Visual Output: The script plots two distinct values as a histogram on your chart:
- The standard high of the candle.
- The adjusted "Top Plus" price (the High plus the Spread).
Purpose for the Trader
By highlighting these two levels simultaneously, the tool helps traders visualize the "true" ceiling of price action. It ensures that you are accounting for transaction costs (the spread) when analyzing price resistance and volatility, providing a more accurate view of where the market actually stands compared to the raw data shown on a standard price chart.
//+------------------------------------------------------------------+
//|                                                   Ask_Shadow.mq4 |
//|                              transport_david , David W Honeywell |
//|                                        transport.david@gmail.com |
//+------------------------------------------------------------------+
#property copyright "transport_david , David W Honeywell"
#property link      "transport.david@gmail.com"
//----
#property indicator_chart_window
#property indicator_buffers 2
#property indicator_color1 Red
#property indicator_color2 Red
//---- input parameters
//---- buffers
double ExtMapBuffer1[];
double ExtMapBuffer2[];
//+------------------------------------------------------------------+
//| Custom indicator initialization function                         |
//+------------------------------------------------------------------+
int init()
  {
//---- indicators
   SetIndexStyle(0,DRAW_HISTOGRAM, 0, 1, Coral);
   SetIndexBuffer(0, ExtMapBuffer1);
   SetIndexStyle(1,DRAW_HISTOGRAM, 0, 1, Coral);
   SetIndexBuffer(1, ExtMapBuffer2);
//----
   return(0);
  }
//+------------------------------------------------------------------+
//| Custor indicator deinitialization function                       |
//+------------------------------------------------------------------+
int deinit()
  {
//----
//----
   return(0);
  }
//+------------------------------------------------------------------+
//| Custom indicator iteration function                              |
//+------------------------------------------------------------------+
int start()
  {
   double spread, Top, TopPlus;
   int counted_bars=IndicatorCounted();
   if  (counted_bars<0) return(-1);
   if  (counted_bars>0) counted_bars--;
   int i;
//----
   for(i=counted_bars-1; i>=0; i--)
     {
      spread=(Ask-Bid);
      TopPlus=(High[i]+spread);
      Top=(High[i]);
      ExtMapBuffer1[i]=TopPlus;
      ExtMapBuffer2[i]=Top;
     }
//----
   return(0);
  }
//+------------------------------------------------------------------+
Comments