ASKBID_v2
Download script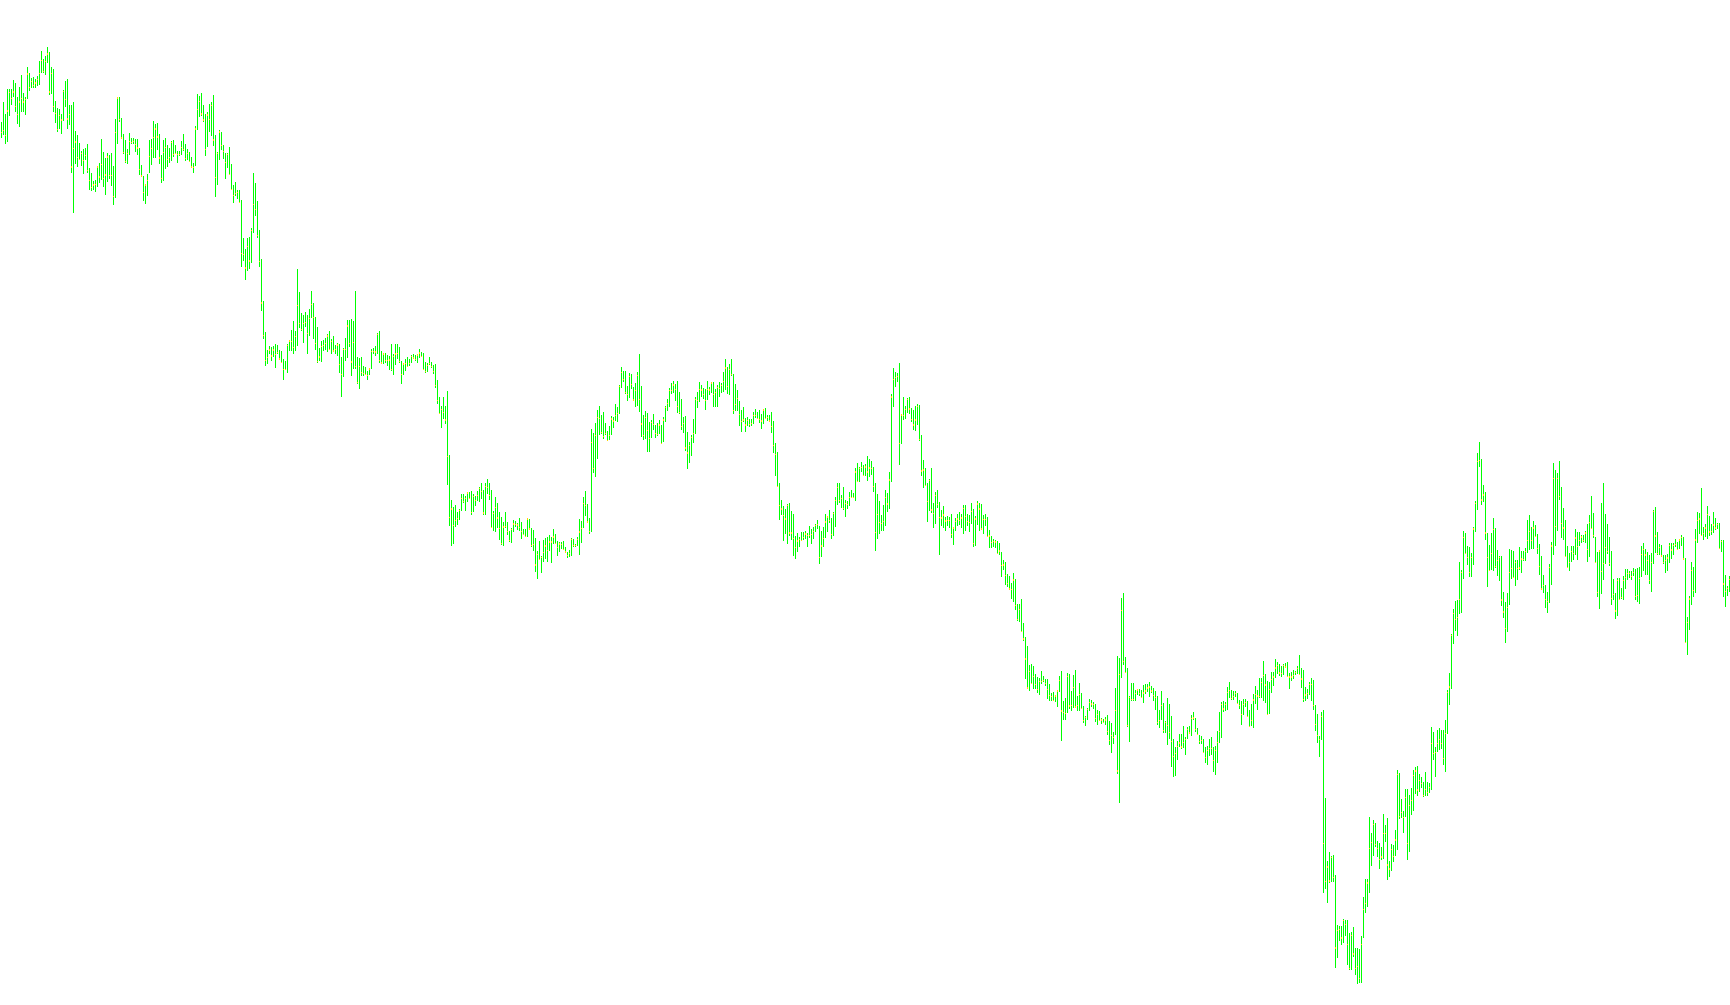
This tool is designed to provide a clearer visual representation of market pricing by highlighting the difference between the buying and selling prices directly on your trading chart.
How It Works
In standard forex or asset trading, there is often a small gap between the price at which you can sell an instrument and the price at which you can buy it. While most basic charts only show a single "closing" price, this script adds a visual layer that accounts for the Spread—the actual cost of entering a trade.
Key Features & Logic
- Dynamic Spread Calculation: The script automatically detects the current spread of the specific asset you are viewing. It calculates this based on the smallest unit of price movement available in the market.
- Historical Visualization: Upon loading, the tool scans your existing chart history. It identifies the closing prices for all past bars and reconstructs the "Ask" price (the price to buy) by adding the calculated spread to those historical values.
- Real-Time Updates: The script continuously monitors the current live market data. It ensures that the most recent bar on your screen reflects the exact, real-time Bid and Ask prices currently being offered by the broker.
- Visual Representation: Instead of cluttering the screen with complex numbers, the logic translates this data into a clear histogram format. This allows you to see the "execution zone" visually, making it easier to understand where your trade will actually be filled compared to the standard market price.
By using this tool, you gain a more accurate visual perspective of market liquidity and entry costs, ensuring that the prices you see on your screen more closely align with the actual reality of live trading execution.
Miscellaneous
9
Views
0
Downloads
0
Favorites
ASKBID_v2
//+------------------------------------------------------------------+
//|                        Bars with Ask                             |
//+------------------------------------------------------------------+
#property  indicator_chart_window
#property  indicator_buffers 2
#property  indicator_color1  Blue // öâåò 1
#property  indicator_color2  Blue // öâåò 2
#property  indicator_width1  5 // òîëùèíà 1-é ëèíèè
#property  indicator_width2  5 // òîëùèíà 2-é ëèíèè
double _Ask[],_Bid[];
double Spread;
//+------------------------------------------------------------------+
//| Custom indicator initialization function                         |
//+------------------------------------------------------------------+
int init()
{
  SetIndexStyle(0,DRAW_HISTOGRAM);                  // èçìåíåíî
  SetIndexBuffer(0,_Ask);
  SetIndexStyle(1,DRAW_HISTOGRAM);                  // èçìåíåíî
  SetIndexBuffer(1,_Bid);

  Spread=MarketInfo(Symbol(),MODE_SPREAD)*Point;
  return(0);
}

int start()
{
  int i,counted_bars=IndicatorCounted();

  if(counted_bars==0)
  {
    for(i=Bars; i>0; i--)
    {
      _Bid[i]=Close[i];
      _Ask[i]=Close[i]+Spread;
    }
  }

  _Ask[0]=Ask; _Bid[0]=Bid;

 //Comment("High DAY",MarketInfo(Symbol(),MODE_HIGH),"\n","Low DAY",MarketInfo(Symbol(),MODE_LOW));
 return(0);
}
Comments