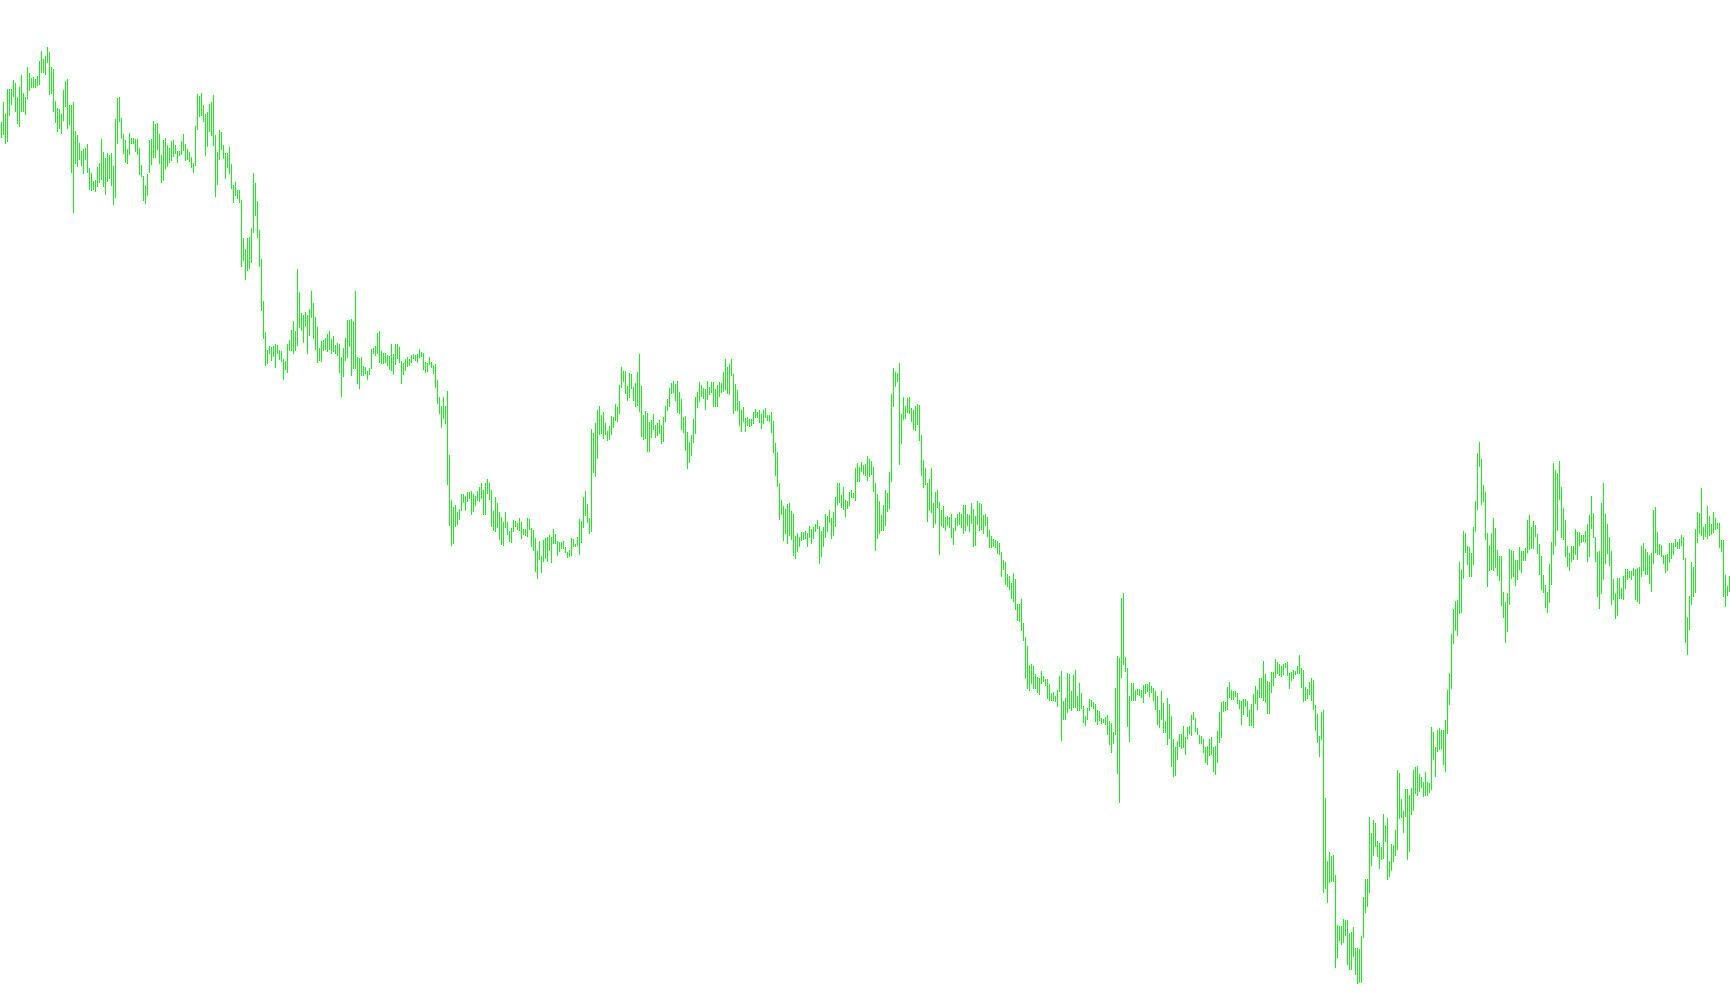
The ASCtrend indicator is designed to identify trend reversals by analyzing price volatility and momentum shifts. It works by constantly scanning historical market data to distinguish between "noisy" price movements and significant structural trends, ultimately providing visual signals on your chart.
Core Logic Breakdown
1. Volatility Measurement Instead of looking at a single price candle in isolation, the script calculates a rolling average range. It examines the difference between the highs and lows over a set window of 10 bars. This allows the tool to understand what a "normal" price movement looks like for that specific asset at that specific time.
2. Significant Move Detection The script employs two distinct mathematical tests to validate whether a move is important enough to act upon:
- Gap/Breakout Check: It looks for instances where the distance between the current price and a previous candle exceeds twice the average range.
- Momentum Velocity: It measures the distance covered over several bars; if the price moves more than 4.6 times the average range within a short timeframe, it flags this as a high-velocity trend change.
3. Dynamic Momentum Scaling The tool utilizes a smoothed momentum oscillator (WPR) but adjusts its sensitivity dynamically. Based on the "Risk" settings provided by the user, the script modifies how it weighs these price movements. If it detects a significant move (based on the tests mentioned above), it lowers the weight of the momentum calculation to react more sharply to the new trend; otherwise, it maintains a broader view to filter out minor fluctuations.
4. Trend Reversal Identification The indicator identifies signals by monitoring the "Overbought" and "Oversold" thresholds (adjustable via the risk factor).
- Buy Signal: When the momentum shows the market has dipped significantly below the lower threshold and then begins to move back toward the neutral zone, it identifies a potential upward trend.
- Sell Signal: Conversely, when momentum reaches the upper threshold and begins to retreat, it identifies a potential downward trend.
5. Alert System To ensure traders do not have to watch the screen constantly, the script includes an automated alert system. When a confirmed trend reversal is detected on the most recent price bars, it triggers a pop-up notification providing the specific symbol and timeframe of the signal.
//+------------------------------------------------------------------+
//|                                                     ASCtrend.mq4 |
//|                      Copyright © 2005, MetaQuotes Software Corp. |
//|                                        http://www.metaquotes.net |
//+------------------------------------------------------------------+
#property copyright "Copyright © 2005, MetaQuotes Software Corp."
#property link      "http://www.metaquotes.net"
#property indicator_chart_window
#property indicator_buffers 2
#property indicator_color1 Aqua
#property indicator_color2 Magenta

extern int RISK=4;
extern int AllBars=250;
int up=0,dn=0;
double val1buffer[];
double val2buffer[];
//+------------------------------------------------------------------+
//| Custom indicator initialization function                         |
//+------------------------------------------------------------------+
int init()
  {
//---- indicators
      SetIndexStyle(0,DRAW_ARROW,EMPTY);
      SetIndexArrow(0,108);
      SetIndexBuffer(0, val1buffer);

      SetIndexStyle(1,DRAW_ARROW,EMPTY);
      SetIndexArrow(1,108);
      SetIndexBuffer(1, val2buffer);
      return(0);
  }
//+------------------------------------------------------------------+
//| Custom indicator deinitialization function                       |
//+------------------------------------------------------------------+
int deinit()
   {
     return(0);
   }
//+------------------------------------------------------------------+
//| Custom indicator iteration function                              |
//+------------------------------------------------------------------+
// int    counted_bars=IndicatorCounted();

int start()
{

   double value2;
   double value3;
   double value10=10;
   double value11;
   double x1=70;
   double x2=30;
   int TrueCount;
   int counter;
   int MRO1;
   int MRO2;
   int i1;
   double Range;
   double AvgRange;
   double val1;
   double val2;
   double Table_value2[500][2];
   int counted_bars=IndicatorCounted();

   value10=3+RISK*2;
   x1=67+RISK;
   x2=33-RISK;
   value11=value10;
  //----------------------------

   if(counted_bars<0) return (-1);
   if(counted_bars>0) counted_bars--;       //last bar recounted
   int i;
   int shift = Bars-counted_bars-1;
   if (shift > AllBars) shift = AllBars;

  for(i=shift; i>0; i--)
   {


      counter=i;
      Range=0;
      AvgRange=0;
      for (counter=i ;counter<=i+9;counter++)
      {
         AvgRange=AvgRange+MathAbs(High[counter]-Low[counter]);
      }
      Range=AvgRange/10;


      counter=i;
      TrueCount=0;
      while (counter<i+9 && TrueCount<1)
      {
         if (MathAbs(Open[counter]-Close[counter+1])>=Range*2.0 )
               TrueCount++;
         counter++;
      }

      if (TrueCount>=1)
            MRO1=counter ;
      else
            MRO1=-1;

      counter=i;
      TrueCount=0;
      while (counter<i+6 && TrueCount<1)
      {
           if(MathAbs(Close[counter+3]-Close[counter])>=Range*4.6)
            {TrueCount++;}
           counter++;
      }

      if(TrueCount>=1)
            MRO2=counter;
      else
            MRO2=-1;

      if (MRO1>-1)
            value11=3;
      else
            value11=value10;

      if (MRO2>-1)
            value11=4;
      else
           value11=value10;


      value2=100-MathAbs(iWPR(NULL,0,value11,i));
      Table_value2[i][0]=i;
      Table_value2[i][1]=value2;
      val1=0;
      val2=0;
      value3=0;
      //-------------------     val1
      if (value2<x2 )  //  x2 = 30
      {
         i1=1;
         while (Table_value2[i+i1][1]>=x2 && Table_value2[i+i1][1]<=x1)
         {i1++;}

         if (Table_value2[i+i1][1]>x1)
         {
            value3=High[i]+Range*0.5;
            val1=value3;
         }
      }

      //-------------------     val2
      if ( value2>x1) // x1 = 70
      {
            i1=1;
            while (Table_value2[i+i1][1]>=x2 && Table_value2[i+i1][1]<=x1)
            {i1++;}

            if (Table_value2[i+i1][1]< x2)
            {
               value3=Low[i]-Range*0.5;
               val2=value3;
            }
      }


      if (val2!=0 && up==0 )
      {
           val1buffer[i]= val2-1*Point;
           up=1;
           dn=0;
           if(shift<=2)
           {
            Alert (Symbol()," ",Period(),"M  Asctrend BUY ");
            }
      }
      if (val1 !=0 && dn==0)
      {

            val2buffer[i]= val1+1*Point;
            dn=1;
            up=0;
            if(shift<=2)
            {
            Alert (Symbol()," ",Period(),"M   Asctrend SELL ");
            }
       }

   }
return(0);

}
Comments