ASCTrend1_v2
Download script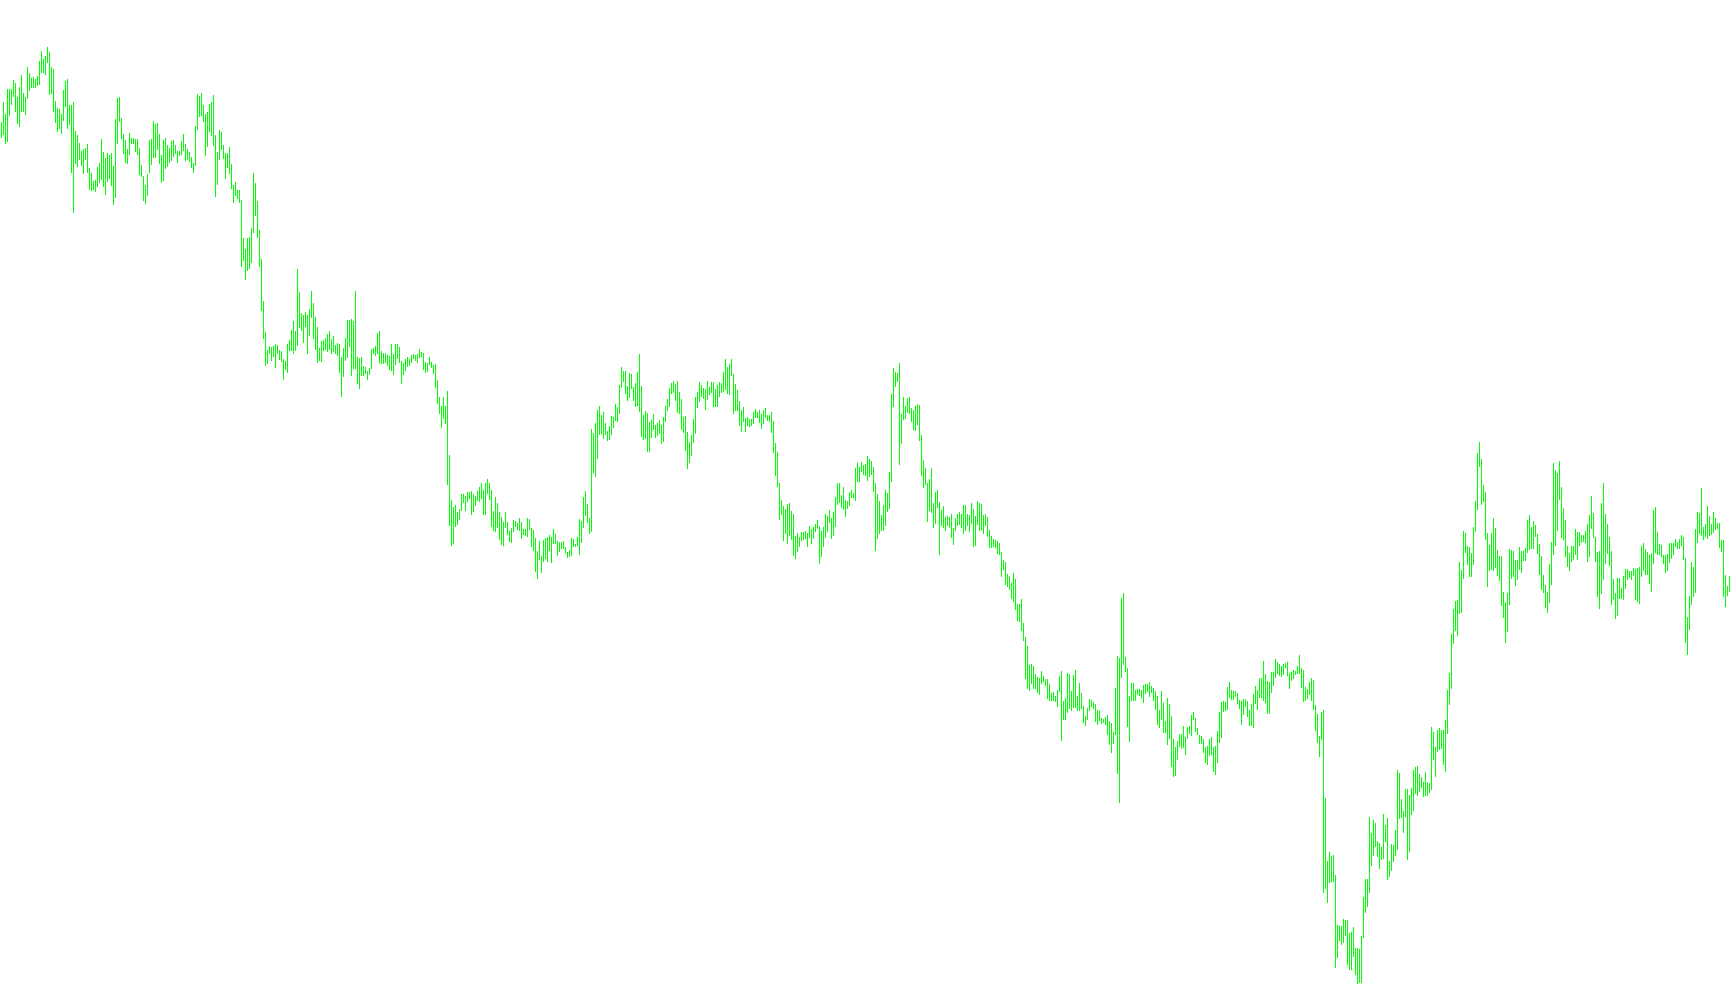
This tool is designed to analyze market trends by identifying the intensity of price movements relative to recent volatility. Instead of simply looking at where the price is going, it evaluates the "strength" and "speed" of the current momentum to determine if the market is in a significant trending state or merely fluctuating.
How the Logic Works
The script operates through a series of mathematical steps to filter out market noise and highlight meaningful trends:
1. Volatility Measurement First, the tool looks at a small window of recent price bars (specifically the last 10 candles). It calculates the average range—the distance between the highest and lowest prices—during this period. This provides a baseline for "normal" market activity.
2. Movement Verification The logic then checks for two specific types of significant moves:
- Price Gaps: It looks for instances where the difference between the opening price of one candle and the closing price of the previous one is significantly larger than the average range.
- Trend Velocity: It checks if the price has moved a substantial distance (nearly five times the average range) over a specific period.
If the market meets these criteria, the tool acknowledges a high-momentum state. If the movement is sluggish or lacks significant "stretch," it treats the market as less active.
3. Momentum Analysis The script uses these findings to adjust a momentum indicator (specifically a Weighted Percentage Oscillator). By dynamically changing the calculation settings based on whether a strong trend is detected, the tool attempts to react faster during volatile breakouts while remaining stable during slow markets.
4. Visual Representation Finally, the logic translates these calculations into visual signals on your chart:
- The script compares the current momentum score against two predefined "risk" thresholds.
- When the momentum exceeds a high upper threshold, it identifies a strong trend in one direction.
- When it falls below a low lower threshold, it identifies a strong trend in the opposite direction.
- The resulting visual elements highlight the high and low points of these price candles to make it easier for a trader to see where the strongest directional pressure is occurring.
//+------------------------------------------------------------------+
//| ASCTrend1
//| Ramdass - Conversion only
//+------------------------------------------------------------------+

#property indicator_chart_window
#property indicator_buffers 2
#property indicator_color1 Magenta
#property indicator_color2 Aqua

//---- input parameters
extern int RISK=3;
extern int CountBars=300;

//---- buffers
double val1[];
double val2[];

//+------------------------------------------------------------------+
//| Custom indicator initialization function                         |
//+------------------------------------------------------------------+
int init()
  {
//---- indicator line
   IndicatorBuffers(2);
   SetIndexStyle(0,DRAW_HISTOGRAM,0,1);
   SetIndexStyle(1,DRAW_HISTOGRAM,0,1);
   SetIndexBuffer(0,val1);
   SetIndexBuffer(1,val2);

//----
   return(0);
  }
//+------------------------------------------------------------------+
//| ASCTrend1                                                  |
//+------------------------------------------------------------------+
int start()
  {
   if (CountBars>=Bars) CountBars=Bars;
   SetIndexDrawBegin(0,Bars-CountBars+11+1);
   SetIndexDrawBegin(1,Bars-CountBars+11+1);
   int i,shift,counted_bars=IndicatorCounted();
   int Counter,i1,value10,value11;
   double value1,x1,x2;
   double value2,value3;
   double TrueCount,Range,AvgRange,MRO1,MRO2;

   value10=3+RISK*2;
   x1=67+RISK;
   x2=33-RISK;
   value11=value10;
//----
   if(Bars<=value11+1) return(0);
//---- initial zero
   if(counted_bars<value11+1)
   {
      for(i=1;i<=0;i++) val1[CountBars-i]=0.0;
      for(i=1;i<=0;i++) val2[CountBars-i]=0.0;
   }
//----
   shift=CountBars-11-1;
   while(shift>=0)
     {

   Counter=shift;
	Range=0.0;
	AvgRange=0.0;
	for (Counter=shift; Counter<=shift+9; Counter++) AvgRange=AvgRange+MathAbs(High[Counter]-Low[Counter]);

	Range=AvgRange/10;
	Counter=shift;
	TrueCount=0;
	while (Counter<shift+9 && TrueCount<1)
		{if (MathAbs(Open[Counter]-Close[Counter+1])>=Range*2.0) TrueCount=TrueCount+1;
		Counter=Counter+1;
		}
	if (TrueCount>=1) {MRO1=Counter;} else {MRO1=-1;}
	Counter=shift;
	TrueCount=0;
	while (Counter<shift+6 && TrueCount<1)
		{if (MathAbs(Close[Counter+3]-Close[Counter])>=Range*4.6) TrueCount=TrueCount+1;
		Counter=Counter+1;
		}
	if (TrueCount>=1) {MRO2=Counter;} else {MRO2=-1;}
	if (MRO1>-1) {value11=3;} else {value11=value10;}
	if (MRO2>-1) {value11=4;} else {value11=value10;}
	value2=100-MathAbs(iWPR(NULL,0,value11,shift)); // PercentR(value11=9)
   val1[shift]=0;
	val2[shift]=0;
	if (value2>x1)
		{
		val1[shift]=Low[shift]; val2[shift]=High[shift];
		}
	if (value2<x2)
		{
		val1[shift]=High[shift]; val2[shift]=Low[shift];
		}

      shift--;
     }

   return(0);
  }
//+------------------------------------------------------------------+
Comments