AllMinutes_v1
Indicator

AllMinutes_v1

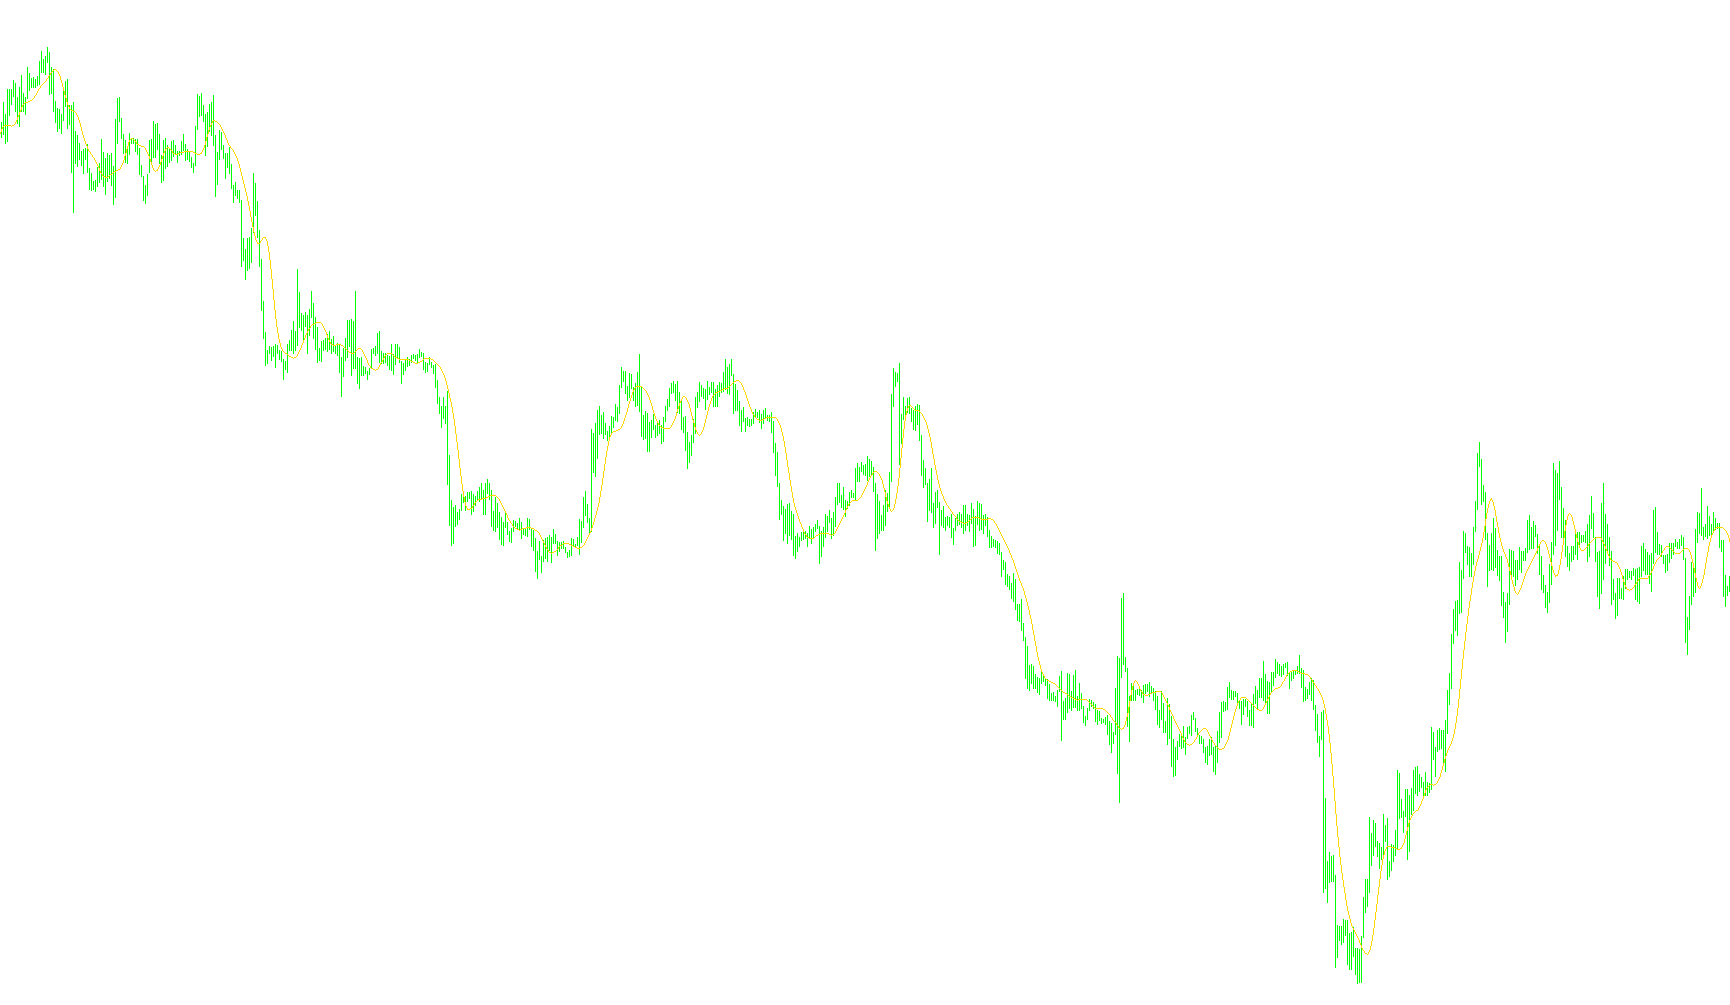
This script synchronizes and exports real-time price action across multiple requested symbols and timeframes into dedicated binary historical files, while optionally filtering out weekend data.

Indicator

AllOrdersControl

AllPivots_v1
Indicator

AllPivots_v1

This indicator projects daily historical support and resistance levels, including standard pivot points, intermediate median lines, and the Camarilla breakdown range based on previous period volatility.

AllPivots_v1_001
Indicator

AllPivots_v1_001

This indicator projects daily price equilibrium points by calculating standard pivot levels, custom midpoints, and Camarilla range boundaries based on historical high, low, and close data.

AllPivots_v1_v1
Indicator

AllPivots_v1_v1

This indicator dynamically projects daily Pivot Points, Camarilla levels, and intermediate price boundaries using historical high, low, and closing data to identify potential reversal zones.

AllPivots_v1_v2
Indicator

AllPivots_v1_v2

This indicator calculates and projects daily floor pivots, Fibonacci-adjacent resistance/support levels, and Camarilla range boundaries based on historical high, low, and closing price data.

AllPivots_v2
Indicator

AllPivots_v2

This indicator projects historical and projected price levels by calculating standard pivots, Fibonacci-style midpoints, and Camarilla range extensions based on multi-timeframe volatility.

AllPivots_v2_ modified
Indicator

AllPivots_v2_ modified

This indicator dynamically projects historical and current price levels by calculating Pivot Points, Middle Range markers, and Camarilla zones across multiple timeframes.

AllPivots_v2_001
Indicator

AllPivots_v2_001

This indicator dynamically projects daily pivot levels, support/resistance boundaries, and Fibonacci retracement zones based on historical price extremes.

All_ADX
Indicator

All_ADX

iADX

This indicator synchronizes and visualizes the Average Directional Index (ADX), +DI, and -DI values across multiple timeframes simultaneously to provide a comprehensive overview of trend strength and direction.

All_CCI
Indicator

All_CCI

iCCI

This indicator synchronizes and overlays Commodity Channel Index values across multiple concurrent timeframes to visualize trend strength and momentum alignment.
Indicator

all_ForecastOscillator

Indicator

All_QQE v1.0

All_RSI
Indicator

All_RSI

iRSI

This indicator synchronizes and visualizes simultaneous Relative Strength Index values across multiple temporal dimensions within a single unified window.
Indicator

All_Stoch_indi_NoAlert

iStochastic
All_usd_pair
Indicator

All_usd_pair

This indicator calculates and plots the weighted convergence of multiple USD pairs onto a single base currency by normalizing their relative price movements.

All_usd_pair2
Indicator

All_usd_pair2

This indicator harmonizes disparate currency pairs onto a single unified scale by calculating relative price coefficients based on moving average centers.

All_usd_pair_v1
Indicator

All_usd_pair_v1

This indicator calculates and normalizes real-time exchange rates for multiple USD pairs into a unified coordinate system using moving average center-point synchronization.

Indicator

All_Woodies_CCI_v1.0.MM1

iCCIiMA
Alma
Indicator

Alma

iMA

This indicator calculates a trend line by applying a Gaussian distribution weight to a series of simple moving averages, optimizing the balance between noise reduction and lag minimization.

ALMA_v1
Indicator

ALMA_v1

iMA

This algorithm applies a weighted moving average utilizing a Gaussian distribution to prioritize recent price data while employing dynamic standard deviation filtering to minimize signal noise during lateral movements.

Alternative Ichimoku
Indicator

Alternative Ichimoku

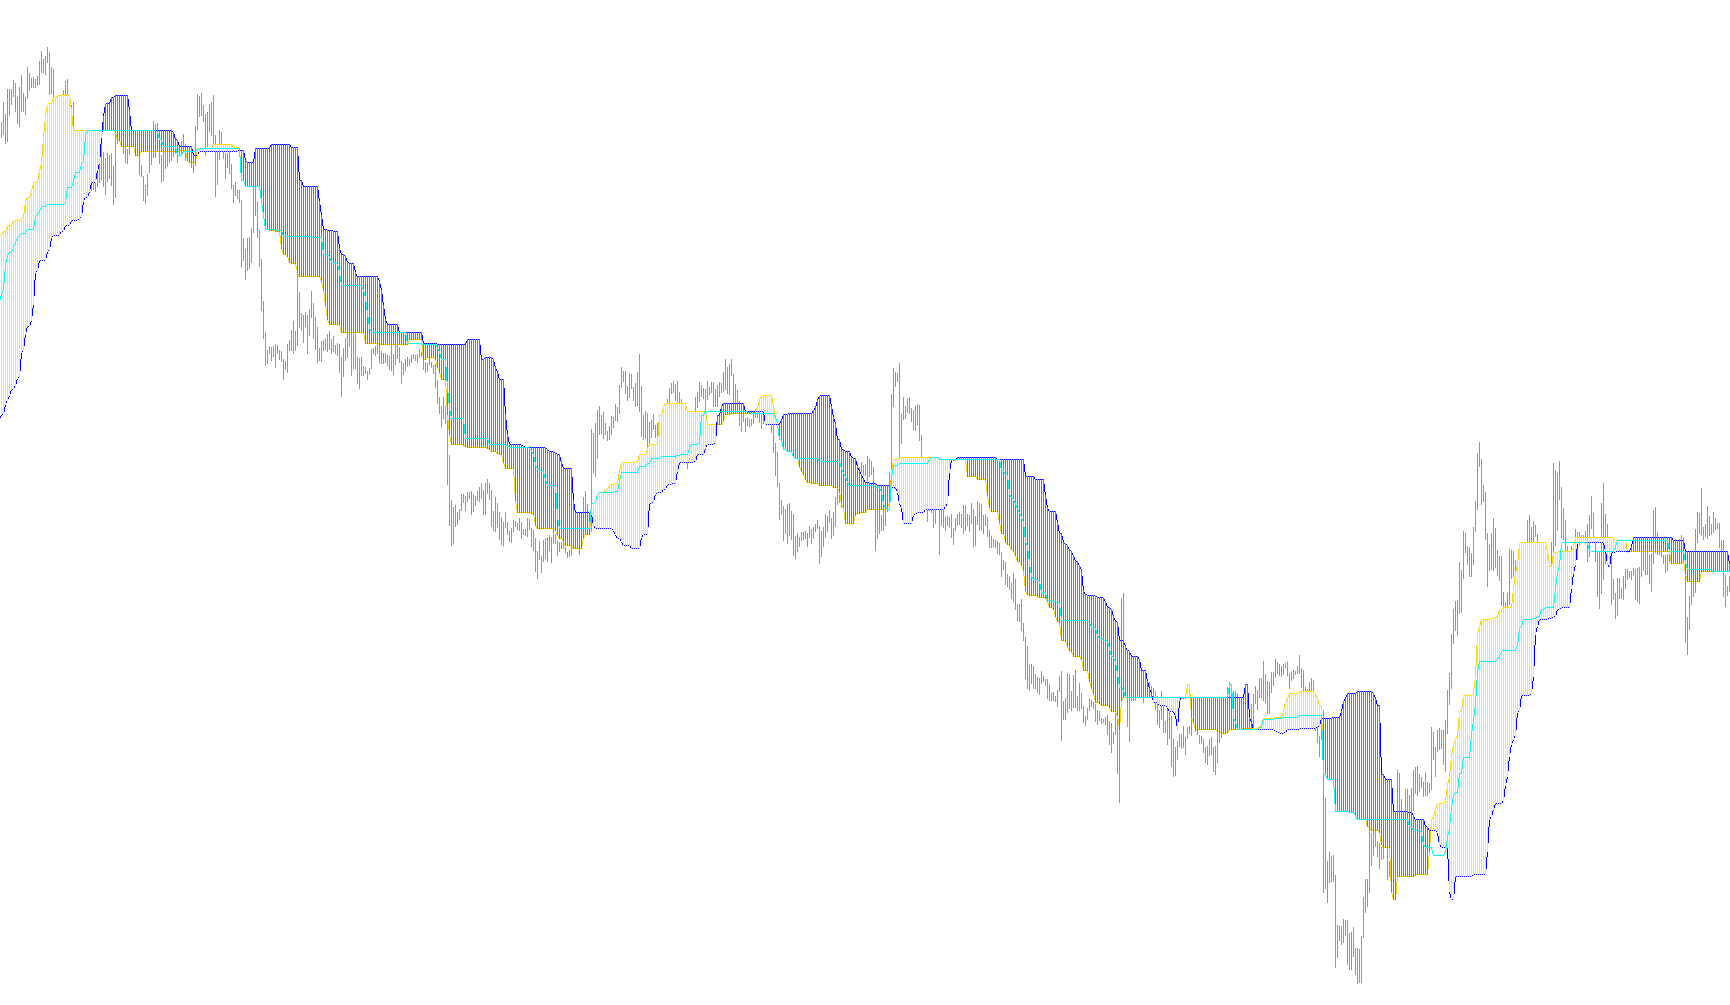
The algorithm identifies price equilibrium by comparing current high-low midpoints against historical offsets to detect volatility shifts and potential trend reversals.

Alternative_Ichimoku
Indicator

Alternative_Ichimoku

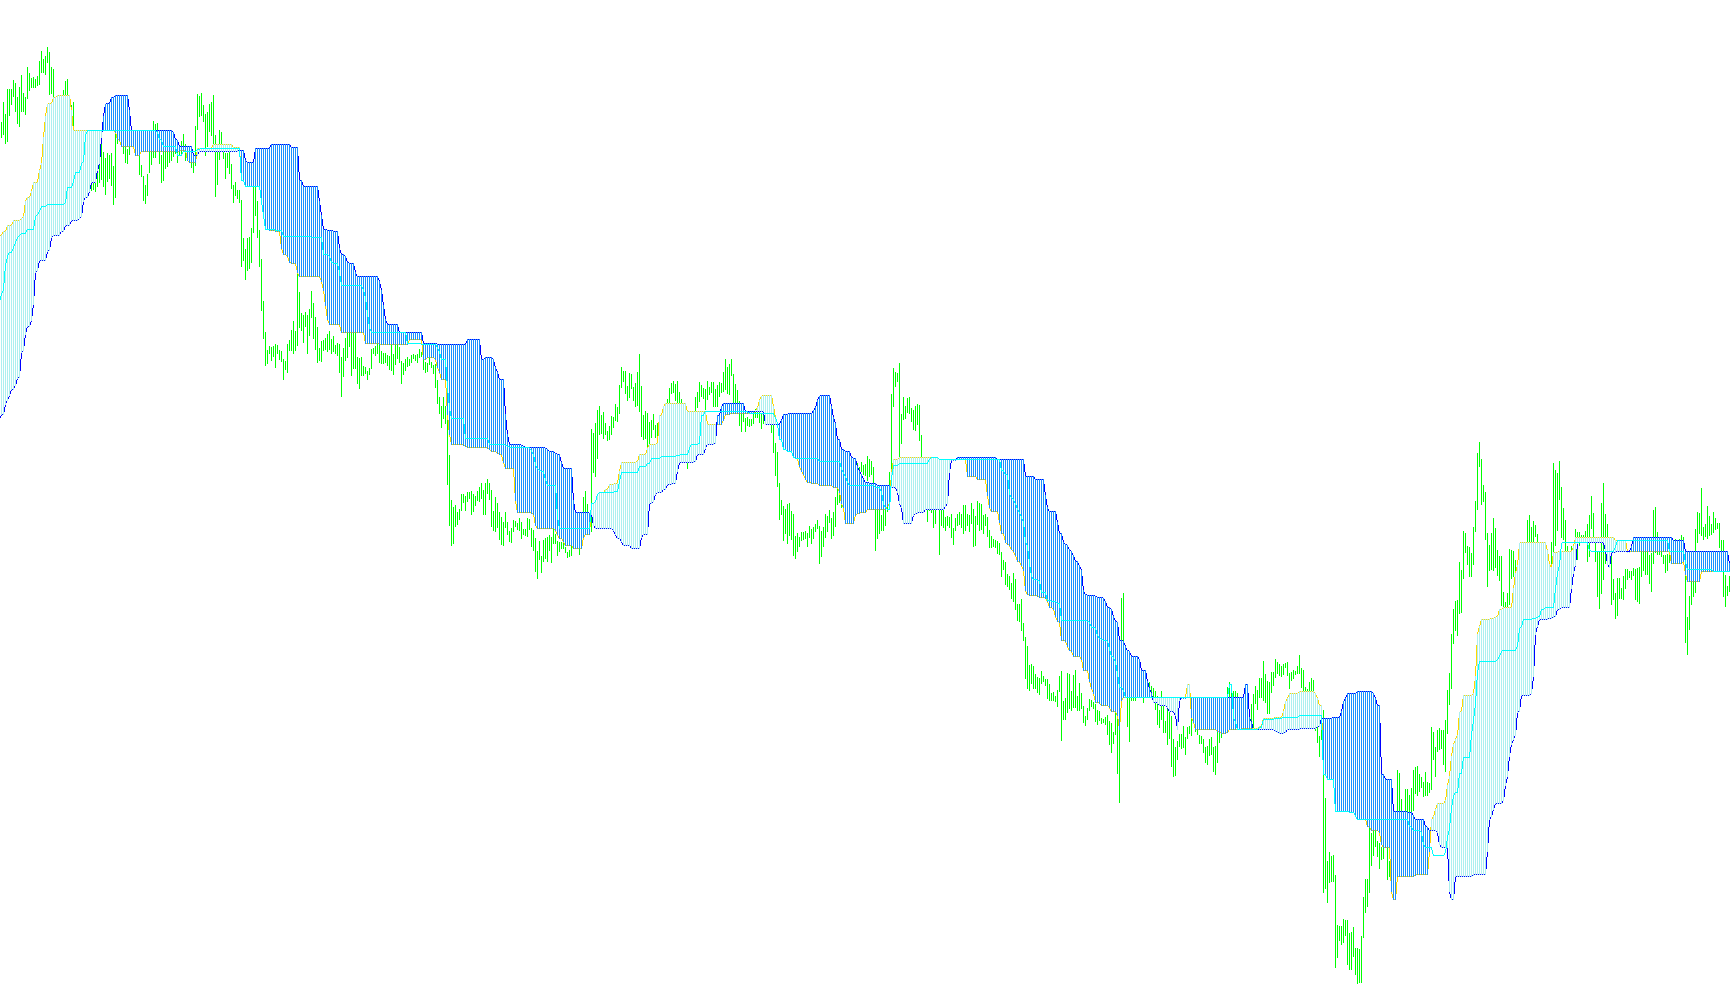
This indicator identifies price equilibrium by calculating multi-period high-low averages and projecting a dynamic volatility-based stop-order threshold.

Alternative_Ichimoku_v06
Indicator

Alternative_Ichimoku_v06

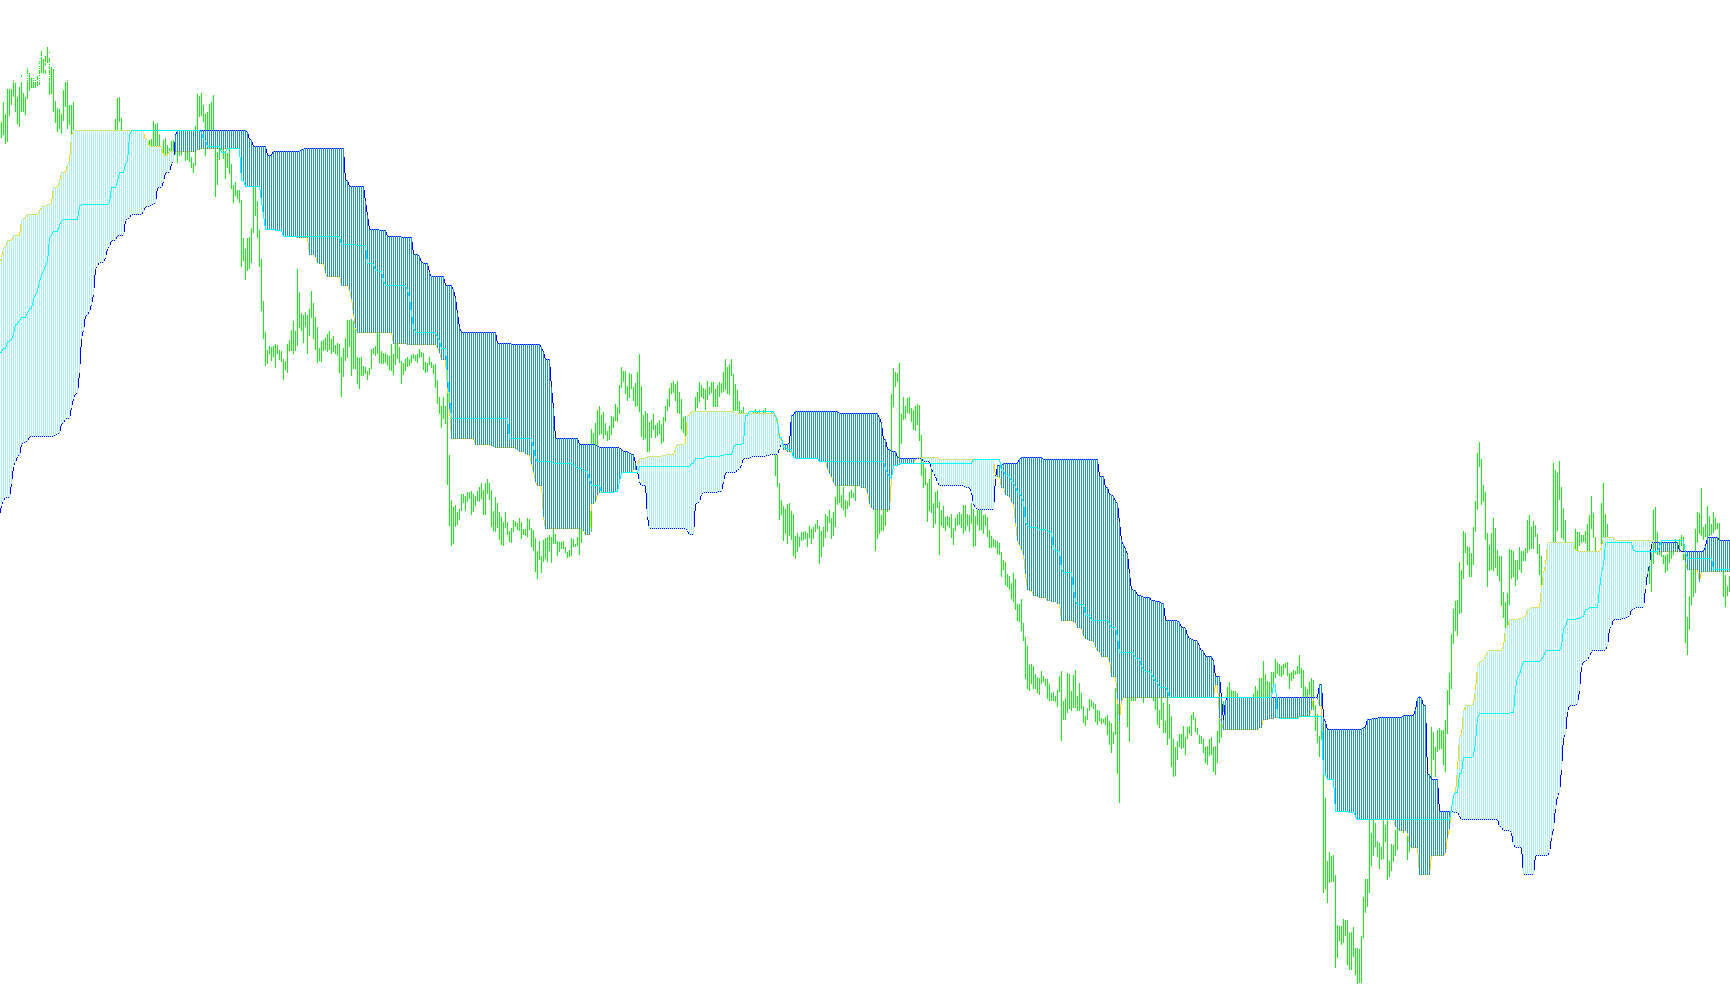
This indicator identifies multi-period price equilibrium by calculating dual midpoint averages and identifying dynamic stop-order zones based on historical high-low extremes.

Alternative_Ichimoku_v06_v1
Indicator

Alternative_Ichimoku_v06_v1

The indicator identifies price equilibrium by calculating and projecting midpoints from two distinct historical lookback windows to visualize momentum shifts and structural boundaries.

Alternative_Ichimoku_v07
Indicator

Alternative_Ichimoku_v07

This indicator identifies price equilibrium by calculating dual mid-point averages from nested high-low ranges and mapping them against volatility-adjusted stop-order boundaries.

Alternative_Ichimoku_v07_v1
Indicator

Alternative_Ichimoku_v07_v1

This indicator identifies potential price reversals and trend shifts by mapping the median price levels of two distinct historical periods alongside a volatility-adjusted stop-order boundary.

AltrTrend
Indicator

AltrTrend

iADX

This indicator identifies structural price breakouts by calculating a high-low range average based on the inverse of the ADX value and filtering signals through percentage-based volatility envelopes.

AltrTrend3
Indicator

AltrTrend3

iADX

The algorithm identifies structural trend reversals by evaluating price action against dynamic upper and lower bounds derived from ADX-weighted volatility ranges.

AltrTrend_Signal_v2_2-Alert
Indicator

AltrTrend_Signal_v2_2-Alert

iADX

The algorithm identifies trend reversals by detecting price closures outside of a dynamically adjusted range based on ADX-weighted historical extremes and relative volatility.

AltrTrend_Signal_v2_2
Indicator

AltrTrend_Signal_v2_2

iADX

Identifies trend reversals by calculating price breaches beyond dynamically adjusted upper and lower boundaries derived from iADX-based lookback periods and localized range expansions.

AltrTrend_Signal_v2_2_v1
Indicator

AltrTrend_Signal_v2_2_v1

iADX

The logic identifies trend reversals by calculating a dynamic lookback period based on ADX strength and marking price breaches of high/low volatility boundaries.

AltrTrend_Signal_v2_2_v2
Indicator

AltrTrend_Signal_v2_2_v2

iADX

The indicator identifies trend reversals by calculating price extremes over an ADX-modulated period and triggering signals when the market close breaches dynamically adjusted volatility thresholds.

AltrTrend_Signal_v2_2_v4
Indicator

AltrTrend_Signal_v2_2_v4

iADX

The algorithm identifies trend reversals by detecting price breaches of dynamically calculated high-low boundaries adjusted for ATR-based volatility and ADX-driven lookback periods.

Indicator

AltrTrend_Signal_v2_3

iADX
Indicator

AltrTrend_Signal_v2_3_v1

iADX
AltrTrend_v1
Indicator

AltrTrend_v1

iADX

This indicator identifies price breakouts by calculating a dynamic lookback period based on ADX values and filtering significant highs and lows against a percentage-based volatility threshold.

alx_RSI_BANDS_MA
Indicator

alx_RSI_BANDS_MA

iMAiMAOnArrayiRSI

This indicator overlays Moving Average and Bollinger Bands directly onto the RSI values to identify volatility envelopes and trend shifts within momentum data.

AMA & AMA sig
Indicator

AMA & AMA sig

This indicator calculates an adaptive moving average by normalizing price fluctuations against local volatility noise to generate dynamic trend signals.

AMA & AMA sig_001
Indicator

AMA & AMA sig_001

This indicator calculates an adaptive moving average by weighing price fluctuations against localized volatility noise to generate high-precision directional signals.

AMA & AMA sig_v1
Indicator

AMA & AMA sig_v1

This indicator utilizes a dynamic smoothing algorithm that weighs price volatility against market noise to generate non-linear trend signals and directional arrows.

AMA Trend Line wo Range
Indicator

AMA Trend Line wo Range

This indicator calculates a non-linear moving average that dynamically adjusts its responsiveness based on relative price noise, error rates, and volatility thresholds to eliminate market jitter.

AMA
Indicator

AMA

This indicator calculates a non-linear moving average that dynamically adjusts its responsiveness based on the ratio of current price displacement to local volatility noise.

AMASig
Indicator

AMASig

This indicator identifies directional price momentum by calculating an Adaptive Moving Average that adjusts its smoothing coefficient based on the ratio of signal displacement to market noise.

AMA_&_AMA_sig
Indicator

AMA_&_AMA_sig

This indicator calculates an Adaptive Moving Average using an efficiency ratio to dynamically adjust smoothing while providing threshold-based directional signals.

Indicator

AMA_001

AMA_002
Indicator

AMA_002

The indicator calculates a self-adjusting moving average by normalizing the ratio of price displacement against local volatility to generate dynamic trend signals and momentum triggers.

AMA_003
Indicator

AMA_003

This indicator calculates an adaptive moving average by weighting price fluctuations against local volatility to identify trend reversals and momentum shifts.

AMA_Bands
Indicator

AMA_Bands

This indicator employs an Adaptive Moving Average combined with dual-layered standard deviation bands to identify momentum shifts and volatility extremes through efficiency ratio weighting.

AMA_Bands_v1
Indicator

AMA_Bands_v1

This indicator utilizes an Adaptive Moving Average (AMA) combined with dual-layered Bollinger Bands to identify trend momentum shifts and volatility extremes through first-derivative signal analysis.